
Key takeaways
ICT Charter Price Action Model 7 teaches traders to interpret one-minute charts as dealing ranges rather than independent candle signals, describing apparent lower-timeframe clutter as time-based distortion rather than random noise.
Read the full summary
ICT Charter Price Action Model 7 teaches traders to interpret one-minute charts as dealing ranges rather than independent candle signals, describing apparent lower-timeframe clutter as time-based distortion rather than random noise. Model 7 focuses on the sell-side expansion of the market maker sell model through accumulation or reaccumulation, upward displacement into a premium fair value gap, reversal on the buy side, distribution or redistribution, and downward expansion toward equal lows or other sell-side liquidity. Key references include prior buying ranges, a down-close candle and its midpoint or consequent encroachment, range boundaries, displacement below reaccumulation, and fair value gaps used as possible retracement areas. ICT visually compresses prolonged sideways action without creating replacement candles to show two time-elongated distribution phases and argues that 30-second, one-minute, or two-second charts may print different candle counts while preserving the same underlying price range. He defines tape reading as tracking the ebb and flow of micro dealing ranges, with the practical exercise of marking a prior range, recording revisits or exits, and prioritizing displacement, redistribution, and liquidity objectives over labeling every candle. The historical chart example relates to August 31, 2019, while the lesson video was uploaded January 31, 2024, and the transcript does not independently verify chart geometry, entries, fills, algorithmic control, or institutional behavior claims.
How we researched this article
BestProps used document-based research from primary firm sources, checked September 24, 2026. The complete source list, scope, limitations, and commercial-state record appear near the end of this article.
In ICT Charter Price Action Model 7 – Supplementary Lesson, ICT explains how he interprets a one-minute chart through price ranges rather than treating every candle as an independent signal. The central lesson is that lower-timeframe price action may appear cluttered because time stretches a relatively compact price process across many candles. ICT calls this “distortion,” distinguishing it from random noise.
The recording uses a historical chart example that ICT identifies in the narration as relating to August 31, 2019. The video itself was uploaded on January 31, 2024, so the upload date should not be confused with the date of the market example.
ICT Price Action Lesson on Reading Ranges
ICT introduces the distinction between noise and distortion at 1:59. In his terminology, “noise” would imply that the lower-timeframe movement carries no interpretable structure. He instead argues that the structure is present but can be difficult to recognize when a narrow range persists across numerous one-minute candles.
His proposed solution is to focus on the price range being traded and on previously established areas of buying or accumulation. Rather than searching every candle for another order block or fair value gap, he carries earlier reference ranges forward and observes whether price remains inside them, revisits them, or breaks away from them.
This becomes explicit at 16:23, where ICT says the displayed section contains multiple possible candle-based reference points but should instead be treated as a broader skewed range — in his words, “this entire range here to here is skewed… there’s actually two portions of price action in here… you cannot see it readily because of all this elongation because of time.” He interprets the chart as containing two distribution phases that are visually elongated by time.
How ICT Model 7 Fits the Sell Model
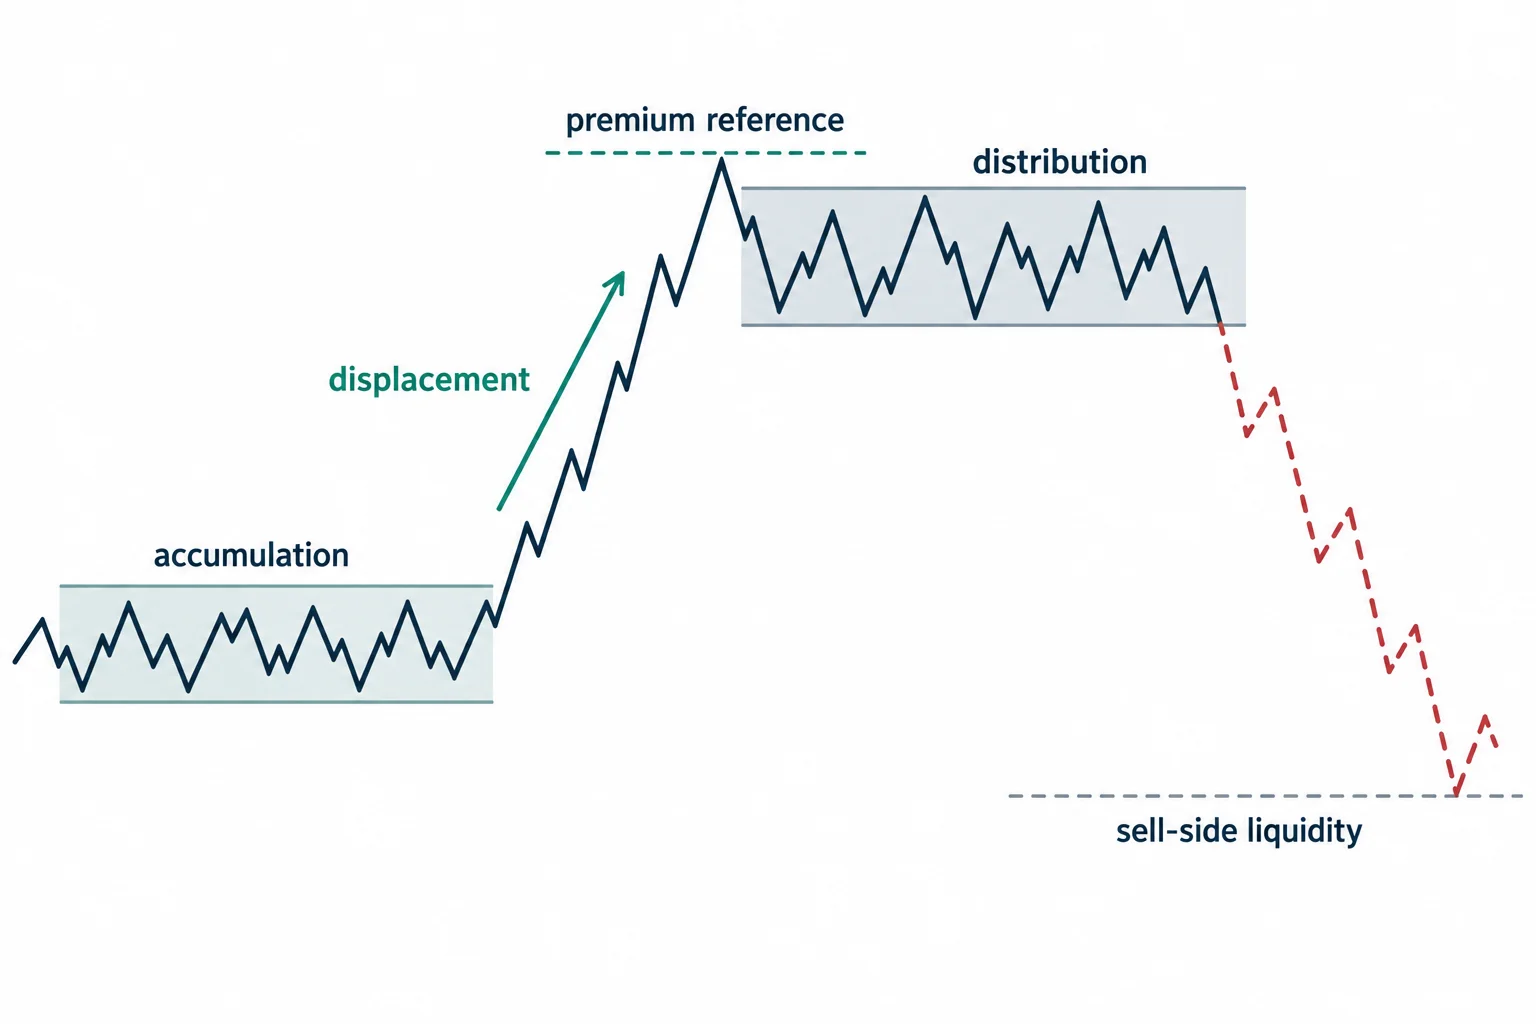
ICT describes Price Action Model 7 as concentrating on the sell-side expansion of what he calls the market maker sell model. In the example, his conceptual sequence is:
- An initial area of accumulation or reaccumulation of long positions.
- Upward displacement toward a premium reference, described in the lesson as a fair value gap.
- A reversal area on what ICT calls the buy side of the curve.
- One or more distribution or redistribution ranges.
- Downward expansion toward equal lows or other sell-side liquidity.
At 13:52, ICT directly states that Model 7 focuses on the sell-side expansion. He then uses a prior down-close candle and its midpoint (called consequent encroachment in his framework) as one reference for the area where he expected selling to emerge.
The important qualification is that these are ICT’s interpretations of the displayed chart. The transcript alone cannot verify the unseen chart geometry, his entries, fills, or the precise sequence of prices.
How ICT Price Action Reveals Structure by Compressing Time
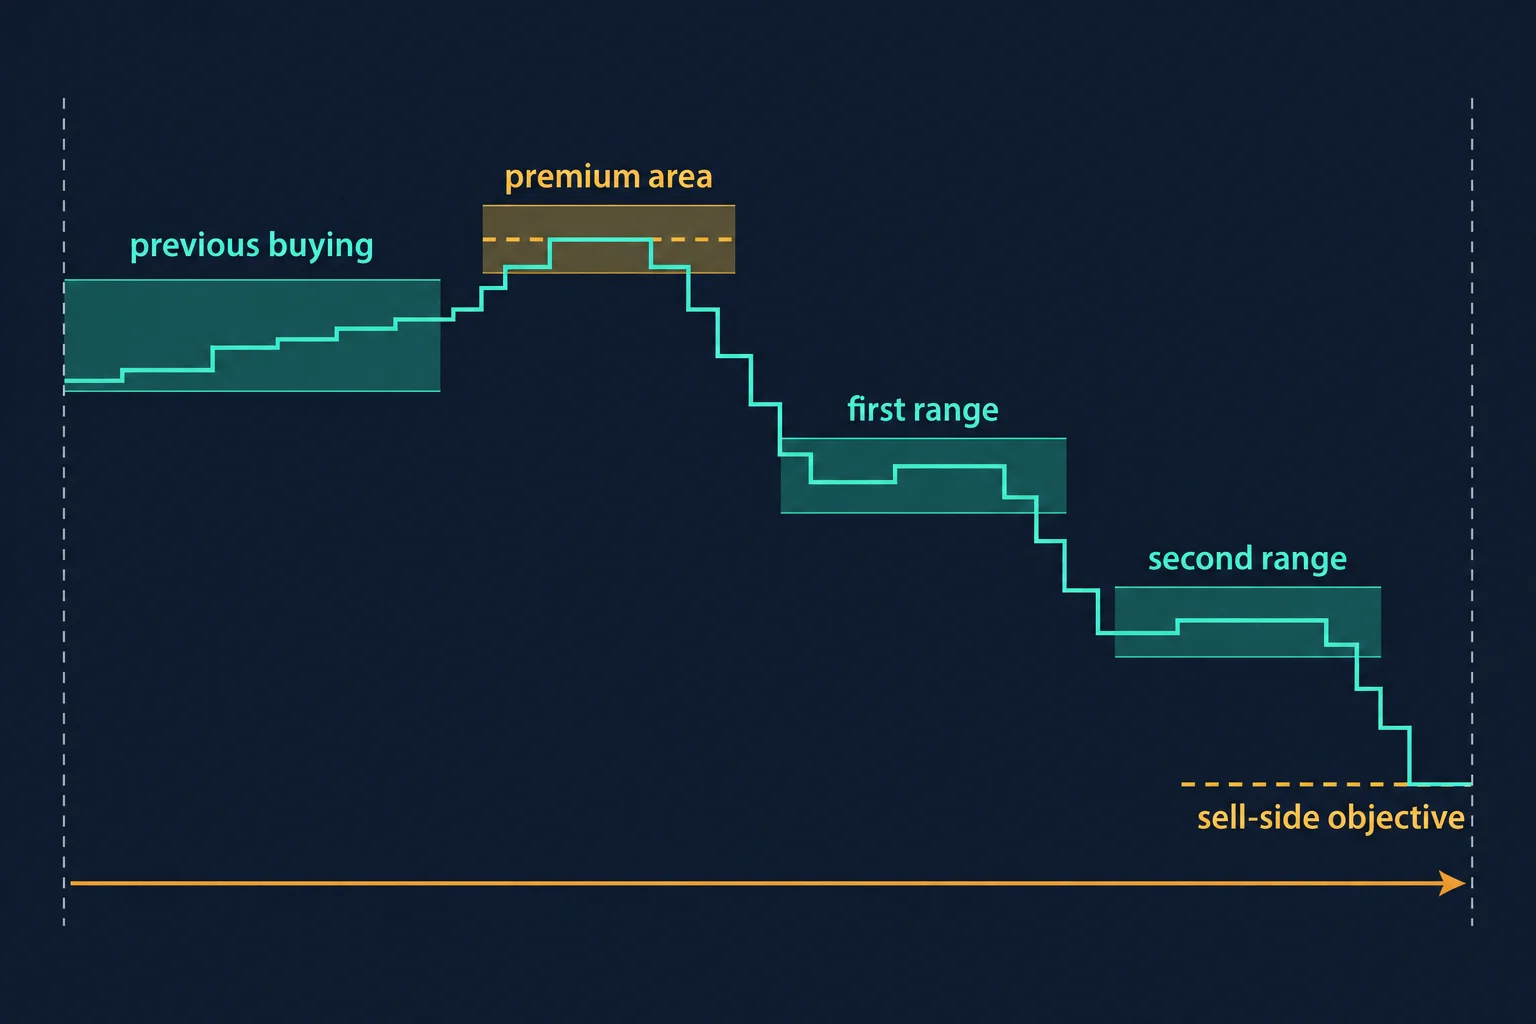
A major part of the presentation involves visually compressing the chart. ICT clarifies that he is not creating replacement candles; he is removing the prolonged sideways portion to illustrate how the remaining price swings resemble his standard sell-model diagram. He summarizes the compressed sequence at 22:42.
This is a teaching device rather than a charting rule. Its purpose is to separate two dimensions:
- Price: the boundaries and internal levels of a dealing range.
- Time: how long price remains within that range and how many candles are printed.
ICT argues that changing from a one-minute chart to a 30-second or two-second chart would multiply the number of candles without necessarily changing the underlying price range. From his perspective, the timeframe displays the delivery of price but does not itself cause the setup.
What ICT Price Action Tape Reading Means
The first portion of the lesson provides historical context. ICT recounts monitoring quote updates while placing orders by telephone, before modern point-and-click execution. He says that following changing highs, lows, and current quotations taught him to think in ranges without relying on a visual chart.
Near 30:24, he gives his clearest definition of tape reading: understanding the ebb and flow of micro dealing ranges as they form over time. He describes floor traders recording new intraday highs and lows and maintaining a mental map of the day’s evolving range.
Applied to the one-minute example, that means identifying the range first and then watching for displacement beyond a boundary. Around 36:44, ICT focuses on the body of a candle associated with prior reaccumulation. A break below the bottom of that range is interpreted as displacement; a resulting imbalance or fair value gap then becomes a possible retracement reference within his model.
Practical Takeaways From the ICT Supplementary Lesson
A general chart-reading exercise derived from the lesson is to reduce the number of observations being tracked. Instead of labeling every candle, a student could mark a prior range, define its upper and lower boundaries, and record how price behaves when it revisits or exits that area. This can make the difference between range analysis and candle-by-candle pattern hunting easier to study.
That exercise does not establish that the market is algorithmically controlled in the specific manner ICT proposes, nor does it validate claims about institutional or interbank behavior. Those claims are part of ICT’s market interpretation. The most supportable lesson from the transcript is methodological: his Model 7 analysis prioritizes dealing ranges, displacement, redistribution, and a liquidity objective while treating the number of lower-timeframe candles as potentially distracting.
Watch the original recording
The video mapped to this article is ICT Charter Price Action Model 7 – Supplementary Lesson, a public upload on the channel The Inner Circle Trader. Its watch page records an upload date of 31 January 2024 Pacific time and a running time of about 40 minutes 51 seconds, and it remains publicly available. Every timestamp link above points into that recording. The transcript used for this guide was produced by local automatic speech recognition of the complete original audio rather than from YouTube captions, so its wording and numbers should be treated as automated. The recording’s charts and on-screen annotations were not examined by this review.
Reference sources and provenance
These references support specific points in the guide above. None of them is an ICT publication, none endorses or tests the approach, and none is offered as evidence for the statements made in the recording.
What the recording does and does not establish
The lesson is an interpretation of one historical chart, not a measured result. Investor.gov, the U.S. Securities and Exchange Commission’s investor education site, describes day trading as “extremely risky” and states that it “can result in substantial financial losses in a very short period of time”.[2] That framing is quoted as general risk context for a method built on intraday execution; it makes no claim about the speaker.
Why the chart narrative is not a performance record
The August 2019 sequence is recounted from the speaker’s own annotations, and the recording supplies no account statement, trade log or independently verified fill. U.S. rules on presenting simulated or hypothetical trading performance require disclosure that such results “have certain inherent limitations” and that simulated programs “are designed with the benefit of hindsight”.[4] That rule governs advertising by regulated advisers, not a YouTube lesson, and is cited only to explain why a retrospective chart walkthrough is not evidence of a repeatable edge.
Base rates in an intraday currency example
The illustration is an intraday currency chart, so the Commodity Futures Trading Commission’s retail foreign-exchange material is relevant context: the agency states that two out of three retail foreign exchange traders lose money each quarter.[3] Nothing in the recording reports a verified outcome for any session.
Source, method and limits
This article is grounded in the full timestamped transcript of the mapped upload, identified in the article metadata by video ID oheyS8MUqno and by that transcript’s SHA-256. The transcript was produced by local automatic speech recognition of the complete original audio and is not human-reviewed captioning. Two limits follow. First, the recording’s one-minute chart and its annotations were not examined by this review, so every statement about range highs, candle bodies, order blocks and liquidity levels is reported as the speaker’s reading of that chart rather than as a verified chart fact. Second, a short passage late in the lesson recites specific low readings and the one-pip difference between them; the automatic transcription renders those figures without reliable instrument context, so no price is restated here. The speaker’s account of interbank and central-bank hierarchy, and his claim that the algorithm is time-and-price based, are likewise reported as his framework rather than as established market structure. YouTube’s own help documentation explains the embedding setting that determines whether the player above is playable on an external site.[5]
Sources
- [1] Primary source: ICT Charter Price Action Model 7 – Supplementary Lesson (The Inner Circle Trader)
- [2] Investor.gov (U.S. Securities and Exchange Commission): Day Trading
- [3] U.S. Commodity Futures Trading Commission: Forex frauds
- [4] 17 CFR 4.41: Advertising by commodity pool operators and commodity trading advisors
- [5] YouTube Help: Embed videos & playlists
Any ICT, smart-money or third-party indicator, script, transcript, note set, spreadsheet or social summary circulating outside the publishing channel’s own upload page is unofficial and untested here. Dealing range, distortion, displacement, reaccumulation, redistribution, consequent encroachment, order block, fair value gap, premium array and sell-side liquidity are the speaker’s own framework and terminology. No win rate, drawdown figure, fill, position size or account result is claimed anywhere in this article.
Leveraged foreign-exchange and futures trading carries substantial risk. Reading lower-timeframe price action as ranges rather than as isolated candles changes how a chart is described; it does not remove slippage, timing error or the possibility of loss. This article is educational commentary, does not provide individualised financial advice, and reports no outcome from any session or account.

