
Key takeaways
In ICT Charter Price Action Model #4 Supplementary Lesson (posted 10 January 2024), ICT revisits the position-trading model he laid out a year earlier and argues that the same bearish May tendency he described for the British pound played out again.
Read the full summary
In ICT Charter Price Action Model #4 Supplementary Lesson (posted 10 January 2024), ICT revisits the position-trading model he laid out a year earlier and argues that the same bearish May tendency he described for the British pound played out again. The supplement adds two things the foundation lesson did not cover: how he reads commercial positioning inside a six-month range rather than off the zero line, and how he pyramids into a position trade using the premium half of a dealing range defined from the first sell signal. He states 145 pips of risk and over 430 pips of available range on the position entry, and says a four-hour refinement cut that risk to about 50 pips. Those are figures he reads off a slide that is not visible in the audio, and they are reported here as his statements rather than as verified fills. He also states plainly that he is not licensed to give that level of advice and that the example is demo trading.
How we researched this article
BestProps used document-based research from primary firm sources, checked September 20, 2026. The complete source list, scope, limitations, and commercial-state record appear near the end of this article.
ICT Supplementary Lesson Overview
At 0:37 ICT frames Model 4 as a review of material he says charter members should already have seen, and he describes it as a position-trading model rather than a frequent-entry setup. Its stage is what he calls a quarterly shift – at 0:46 he says a swing tends to form roughly every three months – and at 0:53 he couples that with a seasonal tendency and a smart-money setup.
The lesson is presented as paid charter content, not free material. At 11:13 ICT says he is speaking to the group that has already paid and that there is no sales pitch in the recording, and at 1:19:34 he says his work is not charity and that he does not want it given away. The upload date and the market example are separate facts: the watch page records the video as posted 10 January 2024, while the price example is the pound in May 2019 and the framework was first presented, by his account, in 2018.
ICT Price Action Model 4 Framework
At 3:01 he lists the components as he applies them:
- A quarterly shift – his term for a meaningful swing developing roughly every three months.
- A seasonal tendency favouring one direction in a chosen currency or commodity.
- His own reading of commercial positioning in Commitment of Traders (COT) data, which he says is not the traditional interpretation.
- SMT divergence between correlated markets, such as GBP/USD and EUR/USD, or between the pound and the US Dollar Index.
- A move through prior external-range liquidity, with an objective on the far side of the range.
At 3:06 he says the highest item on his own slide is what the automated transcript renders as “IPTA data ranges” – 20-, 40- and 60-day lookbacks. He treats the term as established vocabulary for his students rather than something he defines here, so it is left unresolved in this article too; at 51:01 onwards he refers back to it as the frame the whole example sits inside.
How ICT Identifies Bearish Price Divergence
The bearish example needs GBP to make a higher high above an older high while EUR/USD fails to make a corresponding one. At 4:13 he describes pound making that higher high while the euro fails; at 4:41 he covers the Dollar Index convention, saying that on an inverted or mirrored display you would expect a lower high, and at 5:13 that if the index is not inverted you want to see a failed lower low, in other words a higher low. That display distinction matters because a mirrored chart reverses the apparent relationship.
His objective is a monthly expansion to the downside aimed at old sell-side liquidity. At 5:31 he describes it as a monthly candle expansion targeting a daily equal low or an older sell-side liquidity pool; at 5:42 he says the COT range he uses is the last six months, and at 5:56 he puts the four conditions together – seasonal tendency, commercials heavily net short, a higher high running buy-side liquidity, and pairing orders. He states at 7:09 that he believes any one model is enough for a student, which is his framing rather than a measured result.
ICT Model 4 COT and Seasonal Selection
The clearest technical content in the supplement is how he screens commercial positioning. At 13:23 he pulls up a free chart from cotbase.com set to six months, says he has no affiliation with the site and receives no payment from it, and at 14:23 says that any tool is usable as long as it supports a trader’s study and is not grossly inaccurate.
He ignores the large-speculator line on the grounds that it mirrors the commercials, and the small-speculator line because he considers it unreliable. At 18:24 he describes the method as taking the highest and lowest commercial net positions over the last six months as the range, then seeing where the current reading sits inside it; at 19:08 he splits that range at its midpoint and shades the halves. His argument, at 19:26, is that a traditional read would call the commercials bullish whenever they are net long above the zero line, and that this gave him unhelpful signals in earlier years. This is his own interpretation of COT data. The recording contains no controlled test of it, and the article does not treat it as established.
On market selection he is specific. At 31:56 he recommends a watchlist of candidates for each month, and at 32:07 he says to study the seasonal tendencies, pick the strongest month and market, build a watchlist month by month and compare which markets tend to perform better each quarter. The practical instruction is to screen markets before looking for entries.
British Pound Price Action Model 4 Case Study
The example pairs an asserted bearish May tendency in sterling with the conditions above. At 25:48 he restates the logic as a bearish May season, a COT reading showing an excessive net short held by the commercials, and a quarterly shift in the majors; at 26:04 he says the condition is a run of an old high inside a 20-, 40- or 60-day lookback. He calls the move above the old high a Judas swing at 25:40, and at 30:31 he points to a higher low in the Dollar Index in early May as the divergence.
He presents the outcome as confirmation of what he taught the previous year, at 41:37 and 42:35. That is a claim about the value of a prior forecast, not an audited record: it rests on a slide the viewer cannot see in the audio, and no account statement, trade log or independent verification is available in this source. He also says at 37:25 that a general statement that a given year produced the big winners is not the same as a blanket claim, which is a fair caution about seasonal reasoning. At 51:26 he layers a breaker and a small fair value gap onto the same example, and at 51:42 he adds the opening price of the last up-close daily candle as another possible refinement.
ICT Model 4 Position Entry Risk Figures
From 54:31 he moves to a four-hour chart and says a position trader can use a lower timeframe for refinement without turning the model into a five-minute day trade. He then gives the numbers he reads off the slide. At 55:58 he states the original entry carries 145 pips of risk and says he dislikes that; at 56:30 he puts the available range at over 400 pips, and at 58:45 refines it to 145 pips of risk against over 430 pips of positive range. At 1:01:48 he says the four-hour refinement brings risk down to about 50 pips with the same objective, and at 1:02:07 he describes the resulting ratio as well over 10 to 1. He had earlier said at 28:26 that the pound’s May decline averages around 500 pips, and at 59:10 he notes the example came in slightly under that.
None of those figures can be checked here. They are spoken over a slide he describes at 1:01:17 as a PowerPoint that does not show the price, and he tells viewers to go into their own charts instead. There is no account statement, no fill confirmation, no slippage or commission treatment and no sample size. The article reports the numbers because they are what he said, not because they were realised in a verified account.
Refining ICT Price Action on the Four-Hour Chart
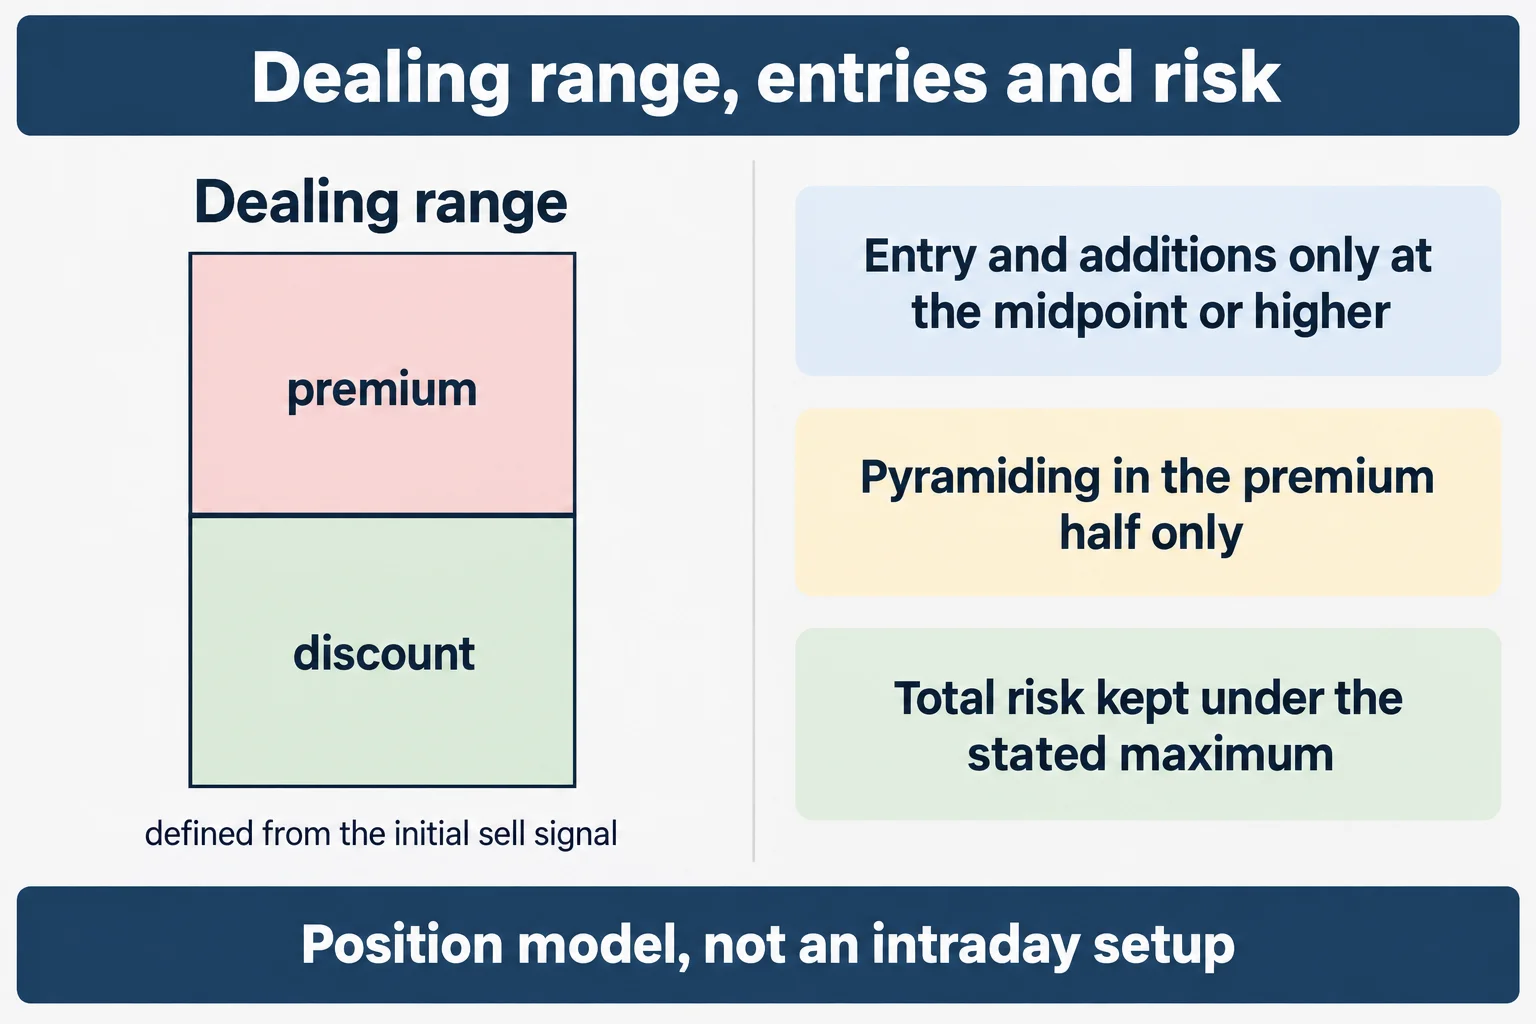
The second addition is where additions to a position are permitted. At 1:07:28 he defines the dealing range from the initial sell signal and the start of downside delivery rather than from the full low-to-high swing, explicitly excluding the stop run that preceded it. At 1:08:13 he splits that range at its midpoint and says entries and additions are allowed only at the midpoint or higher, while price is in the premium half; at 1:08:29 he restricts pyramiding to the premium half, and at 1:08:33 says the odds fall off sharply for additional entries lower down.
On sizing he gives a stated maximum and then withdraws it as advice. At 1:05:31 he says total risk across entries should not exceed a maximum exposure; at 1:05:38 he puts his own at three and a half percent, while saying at 1:05:48 that he is not suggesting that figure for anyone else and calling it far too high for most people; and at 1:05:56 he says one percent should never be exceeded unless a trader has been consistently profitable for five years. At 1:03:12 he describes the reduction in size on each additional entry, and at 1:05:13 he ties that to keeping the combined position inside the stated exposure.
He also warns against the opposite approach. From 1:05:32 backwards, at 1:03:52, he describes the pyramid style he says he was taught early on – adding ever-larger size as an account grows – and at 1:04:59 he says that approach could have left him unable to meet a brokerage obligation. He cites a grain trade he says moved about $5,000 per contract in a day.
At 1:11:31 he states that he is not licensed to give that level of advice and that the discussion is demo trading, so he declines to specify an allocation and says it is for the viewer to determine. That statement is part of the source and is the reason this article does not repeat his percentages as a recommendation.
What This ICT Model 4 Lesson Does Not Establish
The lesson is delivered over slides, and the source used here is the audio. Nothing in the article is drawn from a chart that was seen. Every level, pip figure, ratio and outcome is the speaker’s spoken statement about a presentation slide, and the transcript itself is automatic speech recognition rather than human-verified captions, so terms and numbers may be misrendered.
Several things a reader might want are absent. There is no win rate, sample size, backtest, drawdown profile or account record. There is no statement that any example was a real-money fill. The seasonal tendency is presented as a pattern that repeated, not as a tested statistical claim, and the COT method has no validation study attached. At 1:23:11 he notes that industry watch groups including the CFTC and SEC monitor public claims, and at 58:18 he says his public posts are not a signal service – both of which frame the promotional passages in the video as promotional.
The closing section is the most promotional part of the recording. At 1:19:44 he calls this the model that makes a trader rich and says other traders do not know how to ask for it, and he contrasts himself with Larry Williams, whose Robbins Cup results he discusses at 1:20:27. Those are claims about his own material’s value. They are not evidence of profitability and are reported here as assertions.
ICT Model 4 Lesson Takeaways
- Treat Model 4 as a selective position framework, not a frequent-entry setup (0:37).
- Screen by season and quarter first, then look for entries (32:07).
- Read commercial positioning inside its own six-month range rather than off the zero line – his interpretation, not a tested rule (18:24).
- Define the dealing range from the initial sell signal, and allow additions only in the premium half (1:07:28, 1:08:29).
- Take the risk discussion as a caution rather than a template: he caps his own exposure at a level he then tells viewers not to copy (1:05:38, 1:05:56).
- Ignore any pip figure or ratio from the lesson as a verified result; none of it is checkable from the source.
Watch the original recording
The recording runs about 85 minutes and is the only primary source used here. The channel is The Inner Circle Trader on YouTube.
Resources
These are the sources checked for this article. The CFTC and Investor.gov pages are general regulator and investor-education material – on trading systems sold online, on retail forex fraud, on how the Commitment of Traders reports are published, and on leverage. They are not assessments of ICT, of Model 4 or of anything said in the recording. Copies, notes, indicator bundles and second-hand summaries of this paid charter lesson circulating elsewhere are unofficial and untested here.
- [1] ICT Charter Price Action Model #4 Supplementary Lesson – The Inner Circle Trader (primary source; watch page read 15 September 2026, 85M17S)
- [2] CFTC – Commitments of Traders reports (official publication of the data the lesson reads, read 15 September 2026)
- [3] Investor.gov – Leverage (read 15 September 2026)
- [4] CFTC Learn & Protect – Forex Frauds (read 15 September 2026)
- [5] CFTC – Fraud Advisory: Commodity Trading Systems Sold on the Internet (read 15 September 2026)
This is independent educational commentary on one paid charter lesson. It is not official ICT material, it is not a tested trading system, and it is not investment advice. The speaker himself states in the recording that he is not licensed to give that level of advice and that the discussion is demo trading. Leveraged and futures trading involves substantial risk and is not suitable for everyone.


