
Key takeaways
ICT’s How New Students Should Start Part 4 presents a six-week Nasdaq screenshot routine rather than backtesting, adding one of three pillars every two weeks or logging all three immediately if already familiar, with three screenshots and roughly 20 minutes per day.
Read the full summary
ICT’s How New Students Should Start Part 4 presents a six-week Nasdaq screenshot routine rather than backtesting, adding one of three pillars every two weeks or logging all three immediately if already familiar, with three screenshots and roughly 20 minutes per day. Pillar one marks the 7.00 to 9.00 a.m. Eastern pre-market high, low, relative equal highs and lows, trending or consolidating state, post-9.30 reaction and elapsed time. Pillar two uses a one-minute regular-hours chart to box the gap between the prior day’s 4.14 p.m. close and the next 9.30 a.m. open, mark its midpoint or consequent encroachment and record whether and when price revisits it, while ICT’s approximate 70% revisit-by-10.00 claim is unsupported and explicitly offered for students to verify. Pillar three records the first fair value gap formed at or after 10.00 a.m. under the Silver Bullet framework, including any volume imbalance, formation time, first return, elapsed minutes and move in handles. Build six weeks of historical session logs and then six weeks walking forward in one market, recording exact levels, outcomes including non-revisits, dates, settings and annotations, reviewing on weekends and storing entries in a searchable electronic journal with tags. The method is observational record keeping, not a tested trading system, and the transcript provides no sample size, costs or verified performance.
How we researched this article
BestProps used document-based research from primary firm sources, checked September 13, 2026. The complete source list, scope, limitations, and commercial-state record appear near the end of this article.
In How New Students Should Start Part 4: Pillars of Daily Log Entries, ICT addresses students who feel buried by the size of his video library. He says you do not need everything he teaches before you start, and he describes the worst pattern he sees: new students rushing through as much material as possible and retaining none of it (1:53). He also notes that he demonstrates on the US futures market because it is regulated and allows clear examples, while stating that the same ideas can be applied to other markets, including CFD and forex trading, with the details adjusted (1:11).
Two framing notes matter before the specifics. First, the transcript supports what ICT says and describes; it cannot verify the charts he annotates, the statistical figure he quotes, or whether repeated logging improves a reader's results. Second, he is explicit that this stage is not backtesting, at 12:55 he calls it simply screenshotting things you want to study, and says a later video will cover how to backtest with the collected information.
ICT Daily Log Pillars on a Two-Week Schedule
ICT narrows the starting point to three phenomena and a schedule for adding them. At 2:25 he says to pick one for the first one or two weeks, add a second for the next two weeks, and introduce the third during the fifth and sixth weeks. Later he repeats the arithmetic: give it six weeks, two weeks for each one (5:12). Students who already know the concepts but still lack a routine can log all three from the start.
The daily output is deliberately small: three screenshots per day, one per pillar (7:04). His view is that if a student cannot sustain three screenshots a day, they will not sustain trading rules either. He later estimates the routine at roughly 20 minutes a day for all three, with additional time required if you are reconstructing six weeks of past sessions (26:26).
The dataset he recommends is built from both directions: six weeks of old data logged session by session, then walking forward one day at a time for another six weeks, producing twelve weeks of entries built from a single market, Nasdaq (25:03). He asks viewers to start the following Tuesday because of a Monday US market holiday (26:42). The inventory date of this upload is 4 September 2026; that holiday reference is a calendar detail from the recording, not proof of the session date, and the transcript does not establish which trading day the charts show.
ICT Daily Log Pillar One for Pre-Market Hours
The first pillar begins at 5:41. ICT draws vertical lines at 7:00 a.m. and 9:00 a.m. Eastern Time, the pre-market session window he uses, and studies only what happens between them (6:13). Inside that window he records:
- The highest high and the lowest low (6:37).
- Any relative equal highs or relative equal lows, which he calls the pools of liquidity inside that range (9:20).
- The state of the market. For a brand-new student he strips it to two options (is it trending or consolidating) while noting he also teaches reversing and expansion phases elsewhere (7:32).
- What happens after the 9:30 a.m. regular-session open, and how the marked levels were traded to, if at all (9:00, 10:53).
- The time elapsed from 9:30 until price reacted off one of those levels (12:18).
He describes the pre-market condition as a precursor to how the session may book (expansion, trend, or sideways chop) and then qualifies it in the same breath: it is not a panacea and it will not work all the time, but it should still be logged and annotated daily (10:20, 10:40).
ICT Daily Log Pillar Two for the RTH Opening Gap
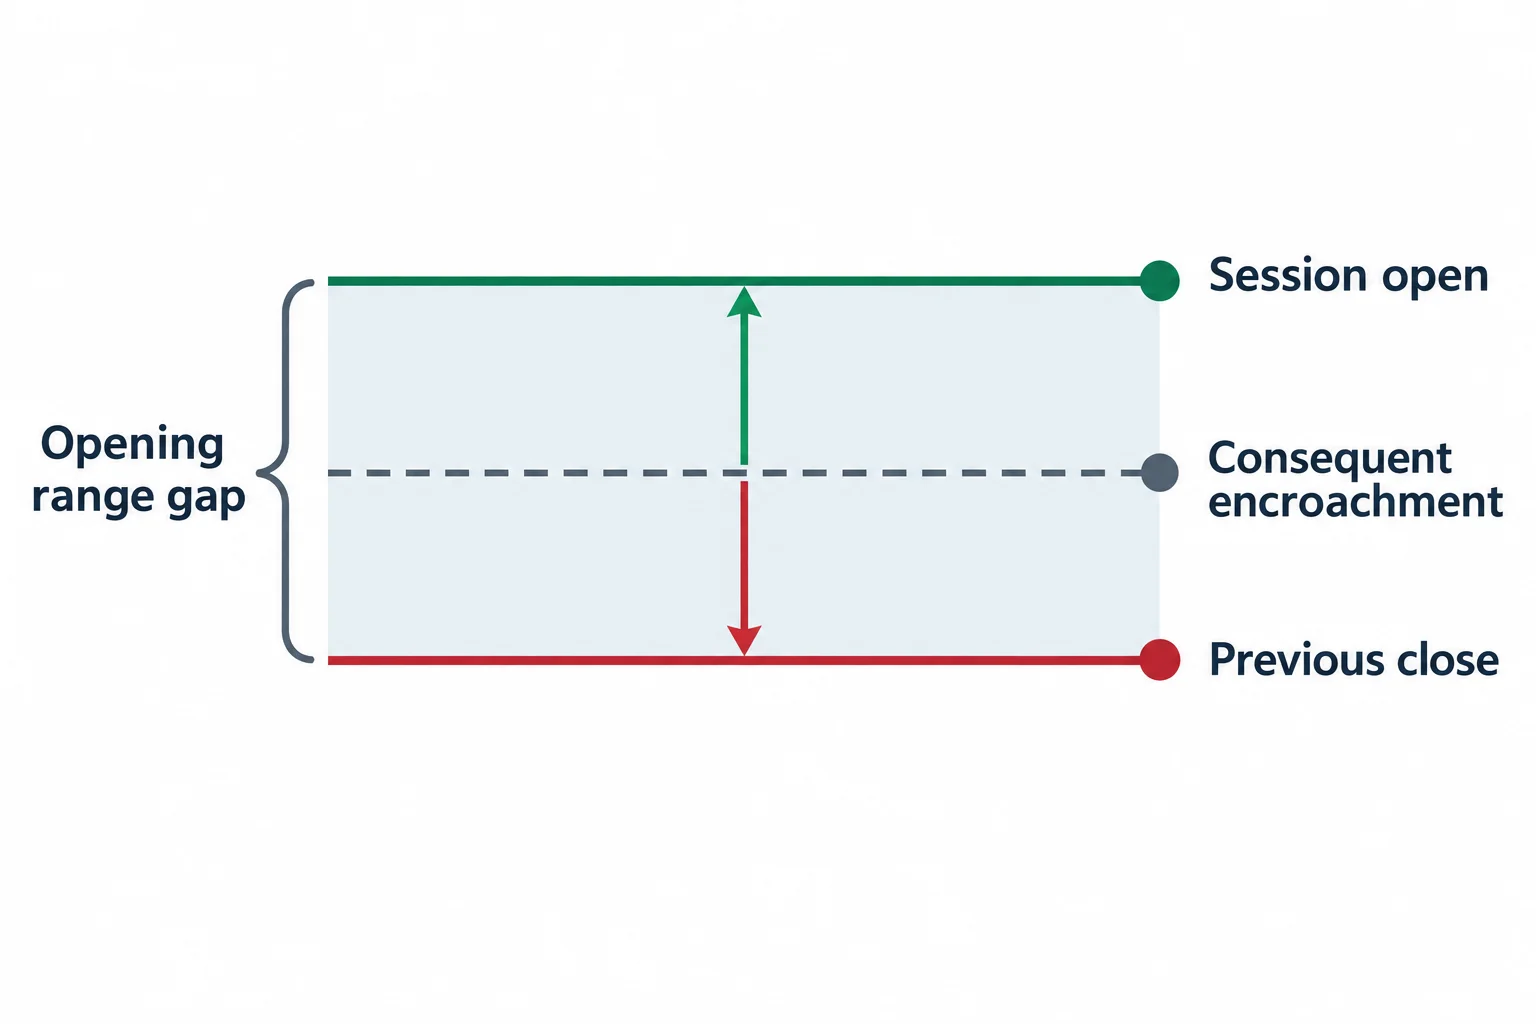
The second pillar starts at 12:50: the regular trading hours opening range gap and what he calls its consequent encroachment delivery. The procedure he demonstrates uses a one-minute chart with the session toggled from electronic trading hours to regular trading hours in the lower-right corner of the chart (13:40).
He marks the previous day's final regular-session print (the 4:14 p.m. Eastern one-minute close) against the opening price at 9:30 a.m. or later, then draws a rectangle spanning the two and switches on the rectangle's midpoint so the middle of the gap is visible (14:05, 14:36). He calls that midpoint consequent encroachment, describing it as a fancy name for the middle of the range or the inefficiency (15:44).
One inconsistency in the recording is worth flagging: while defining the gap he refers to the following day’s 9:00 a.m. Eastern price at 15:11, even though he uses 9:30 a.m. as the regular-session open everywhere else in the lesson. The transcript cannot resolve that, so the opening reference on a chart should be checked against the recording rather than assumed.
What the log should capture here is whether and when price returns to the midpoint. He says to track how often the market gets back to half its gap, and states there is about a 70% likelihood of that happening by 10:00 a.m., then immediately tells viewers not to hold him to the number, to follow along daily, and to calculate the statistic themselves at the end of the year (16:07, 16:28). No sample, instrument test or calculation accompanies the figure.
He also asks students to write their observations into the empty space they leave when framing the screenshot, giving the example of noting that this was the third time that week price reached the midpoint of the regular-session opening range gap by 10:00 a.m. (16:56, 17:10).
ICT Daily Log Pillar Three for the First Fair Value Gap
The third pillar begins at 17:47 and is the one he links to his Silver Bullet framework: the first presented fair value gap after 10:00 a.m. Eastern Time (18:44). In his stated rules, the 10:00 a.m. candle itself can form a qualifying gap, and the gap to record is the first one that appears in that hour, whether on that candle or immediately after it (18:54, 19:34). In the example on his chart the formation is on the 10:01 candle (19:43), which he treats as an example rather than a fixed timing rule.
Two annotation details he stresses: include the volume imbalance when the bodies of the candles defining the gap do not meet (19:49), and extend the zone to the right while studying, then switch the extension off and drag the box to the first time price returns into it (20:20). From there he records the formation time, how many minutes elapsed before the return, and the range in handles from the return down to the short-term low or up to the corresponding high (23:29, 23:53).
ICT Daily Log Entries to Record
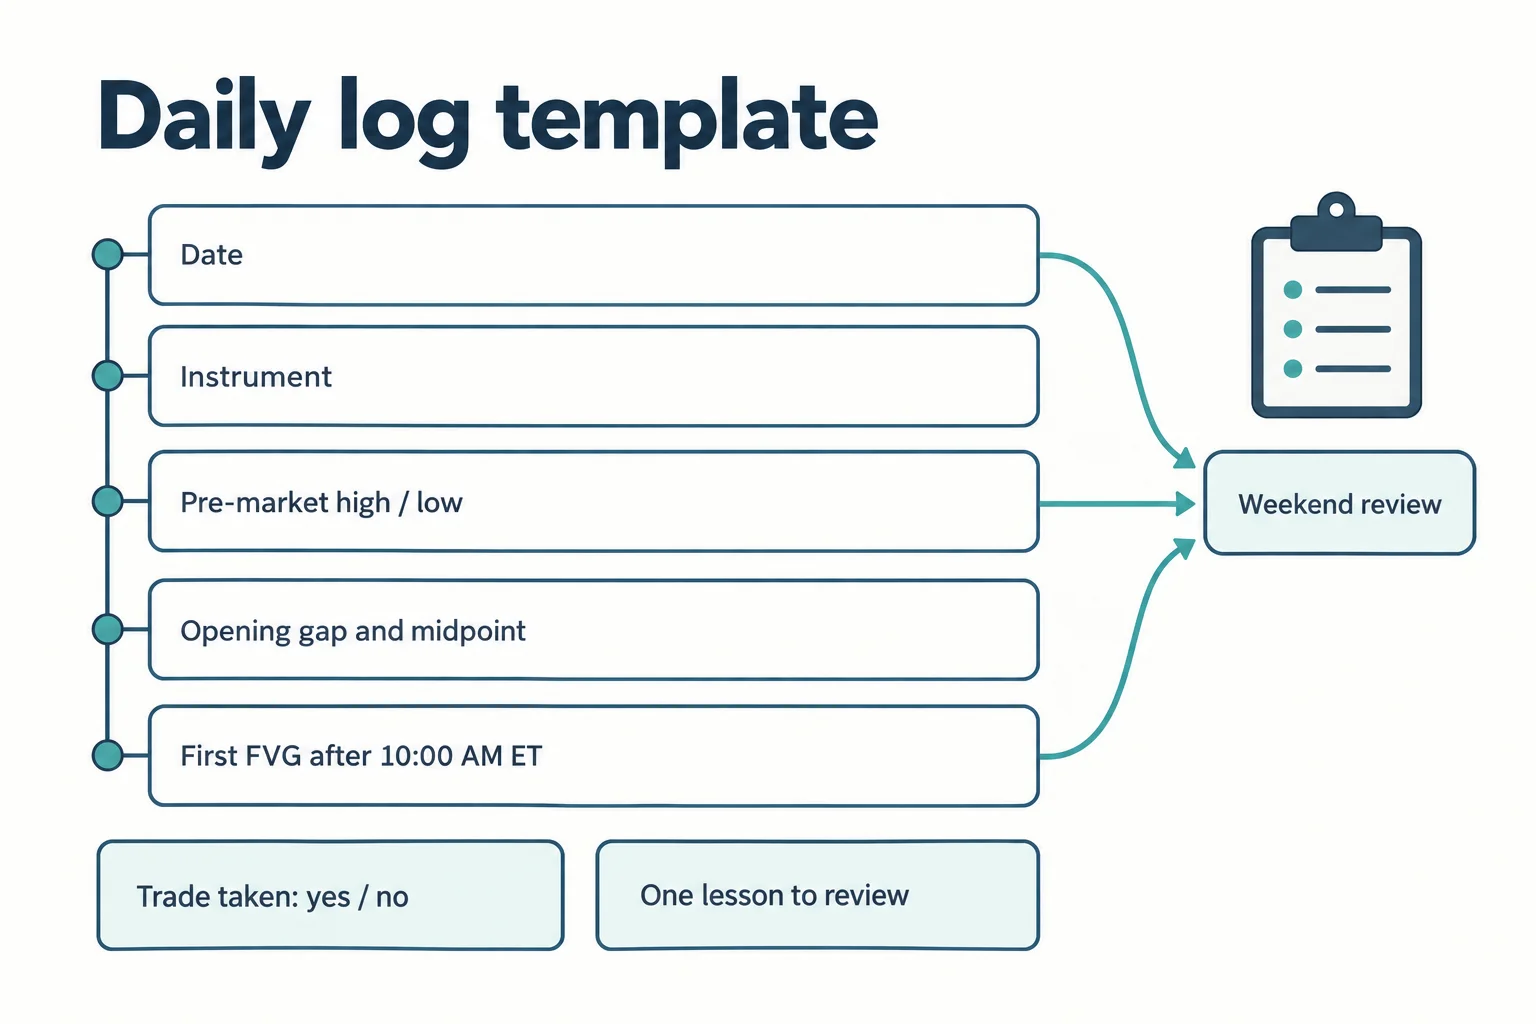
His instructions translate into a neutral, reviewable entry:
- Session details: date, market, and the time zone or session setting used.
- Pillar: pre-market phase, opening range gap midpoint, or first post-10:00 fair value gap.
- Marked levels: exact numbers for the pre-market high and low, relative equal highs and lows, gap boundaries and the midpoint, not approximations.
- State: trending, consolidating, or reversing, as of the observation window.
- Timing: formation time, first return, and elapsed minutes.
- Distance: the range covered, in handles, from the level to the extreme it reached.
- Outcome: what price did, including the cases where a level was never revisited.
- Screenshot: centered and zoomed so the annotation space is usable (27:17).
He recommends reviewing the screenshots when markets are closed, such as on a Saturday or Sunday, because details missed during the session are easier to find when price is static (17:56). On storage, he says the format is up to the student but advises an electronic journal with keyword tags so entries can be searched by date and topic, offering examples such as “silver bullet log 10 a.m.”, the pre-market session condition or phase, and pre-market liquidity pools (29:02, 29:14). He adds that he keeps leather journals himself and envies the searchability of electronic records.
What ICT Daily Log Entries Can and Cannot Establish
ICT presents the method as a way to build familiarity with recurring intraday events. His claims that the phenomena repeat, that they will “absolutely work”, and that what you record here can be transposed to any time frame or session are his interpretations (25:59, 23:16). The transcript supplies no rule set, sample size, transaction costs, or measured outcomes, and the one statistic he gives (the roughly 70% midpoint revisit) is offered with an explicit instruction not to trust the number.
Used honestly, the routine is still a reasonable record-keeping discipline: fixed observation windows, exact level values, a stated market condition, and screenshots that can be revisited. The failure mode is a journal that only contains days when something happened. A log that includes no-setup sessions, missed observations, and the cases where the pattern did not deliver is the version that can actually be reviewed against a hypothesis later.
Watch the Original ICT Daily Log Lesson
This article draws on the timestamped English captions of How New Students Should Start Part 4: Pillars of Daily Log Entries. Captions are a source for the speaker’s words, not independent proof of the charts he annotates, and generated captions can misrender his terminology.
Watch the original lesson on YouTube
The video cannot be played inside another website: when its embedded player was loaded and clicked on 13 September 2026, the player itself reported “Playback on other websites has been disabled by the video owner.” and settled on a “Watch on YouTube” prompt, with no playback progress reported. That is why no embed is reserved or left blank here; the recording is available directly on YouTube.
Watch How New Students Should Start Part 4: Pillars of Daily Log Entries on YouTube ↗
ICT Daily Log Sources and Further Reading
- The original Inner Circle Trader lesson: use the timestamp links above to compare each description with its source.
- Nasdaq Trader trading calendar: the official session and holiday calendar for the market used in the lesson, useful when reconstructing past sessions or accounting for the holiday he mentions.
- TradingView support: managing blue vertical lines: platform documentation relevant to the 7:00 a.m. and 9:00 a.m. vertical markers this routine relies on.
- TradingView support: how to turn Bar Replay on: documentation for a different review method than the screenshot log described here; the lesson keeps the two separate and covers backtesting later.
This is independent educational commentary. It is not official ICT material, a tested trading system, or a claim that any pattern described can be traded profitably.

