
Key takeaways
The Inner Circle Trader lesson presents a mechanical intraday framework built on the completed 7 a.m.
Read the full summary
The Inner Circle Trader lesson presents a mechanical intraday framework built on the completed 7 a.m. to 9 a.m. Eastern pre-session range before the 9.30 a.m. regular-hours open. After 9 a.m., traders record the window high and low, divide the range into midpoint, quarters and eighths, enable the negative 0.5 Fibonacci extension, and consider only post-window price-delivery arrays whose creating candles touch or overlap those derived levels. In the reviewed Friday session, ICT reports a projected high of 28,723, identifies a lower-quadrant array at 28,400.75, treats its small volume imbalance or suspension block as continuation evidence, and describes shorting after price reached the projected high before taking a partial and targeting 28,400. His daily-chart method projects 28,111.5 from the previous day’s range and 28,097.25 and 28,124.25 from a wick treated as a gap, using a three-trading-day lookback unless price breaches that range and favoring clusters of arrays over isolated lines. The checklist stresses fixed time-zone, session and closing-candle conventions, advance recording of subdivisions, exchange-calendar checks, separation of level touches from trade entries, and logging failures as well as successful examples. The article provides no statistical test, sample size, verified fills, position sizes, account results or independently verified track record, and all quoted levels come from an automatic transcript of an approximately 59-minute YouTube recording published August 1, 2026, so the method is a worked educational example rather than evidence of profitability or guaranteed turning points.
How we researched this article
BestProps used document-based research from primary firm sources, checked September 24, 2026. The complete source list, scope, limitations, and commercial-state record appear near the end of this article.
What ICT Part 1 Covers
In Part 1: High Precision Secrets to Intraday Price Action, ICT returns to a session reviewed on the previous day and rebuilds the chart work step by step. The recording is a Saturday session, so the market is closed while he annotates, and most of the screen time is spent on a completed Friday session that he refers to as July 31, 2026. The watch page was public when it was checked on September 13, 2026 and listed a publication date of August 1, 2026; the date spoken in the recording and the upload date are therefore different calendar days and should not be treated as a contradiction.
His organising idea is a fixed, time-based range: the two hours from 7:00 a.m. to 9:00 a.m. Eastern Time, immediately before the 9:30 a.m. regular-hours open. He measures that completed window, subdivides it, and then grades later price action against the resulting levels. The recording also contains long passages about his critics, his online persona and his promotional framing; this article concentrates on the chart method and attributes the rest where it is relevant.
Everything below is taken from the recording’s automatically generated speech transcript. Timestamps in the links open the corresponding moment in the video. That transcript is machine-produced rather than a human-reviewed caption track, so spoken numbers and unusual terms are the least reliable part of it; each level quoted here is reported as what he reads aloud, not as a verified chart coordinate.
Define the ICT Intraday Pre-Session Window
At 3:32 he calls the 9:30 a.m. Eastern open the start of the regular trading hours session, and argues that any data-driven method would work from a range with a defined beginning and end. He then names his preferred window at 3:48: the two hours immediately before that open, spelled out at 3:56 as 7:00 a.m. to 9:00 a.m. Eastern. At 4:01 he says a trader could spend an entire career working only that window.
He is explicit at 9:20 that accepting his framework does not require accepting his explanation of why it works. A viewer can treat the range and its subdivisions as a technical approach, he says, and set aside the algorithmic account of markets entirely. The distinction matters for reading this lesson: the measurements are mechanical, while the reasons he gives for them are his interpretation.
His answer to the objection that the range low could not have been known in advance comes at 10:05 and 10:23. An arbitrary range drawn after the fact carries little information, he says, while a time-bounded one is finite: once 9:00 a.m. has passed, the highest high and lowest low inside the window are simply recorded facts. That is a narrower claim than prediction. Knowing where the completed range sits does not establish where price must go next.
Measure the ICT Intraday Price Range
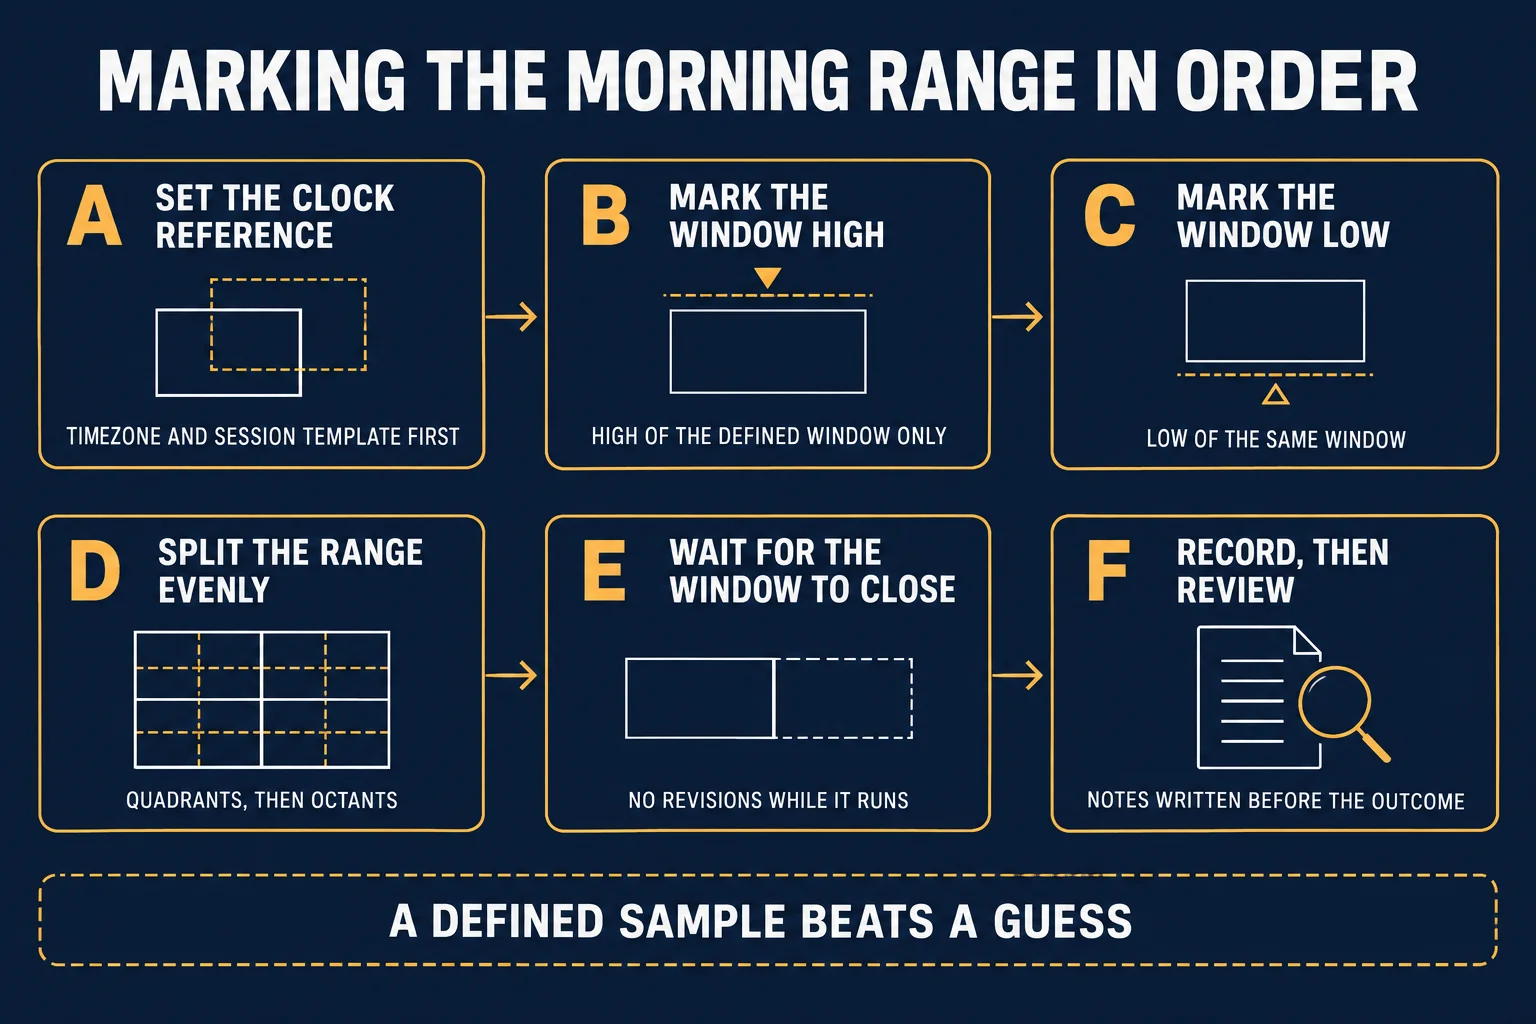
At 12:05 he anchors a Fibonacci tool to the 7:00-9:00 a.m. low and drags it to the window’s high. His template then displays the familiar subdivisions: midpoint, quarters, eighths, and an extension at the negative 0.5 level that he switches on at 13:50. Reading that extension off the chart at 14:02, he states a projected daily high of 28,723 in the instrument he is trading, and he treats that value as his upside objective for the session he is reviewing.
He also explains the directional bias he brought into that session at 12:41: price had drifted lower through the pre-session window, he expected a rally after a run higher following FOMC, and he expected a Friday retracement, so the plan was to let the market work up into his projected level and then look for a short back toward 28,400. Those are his stated reasons. A transcript can record that he said them; it cannot independently confirm that the levels, the drift or the macro context he describes were as he describes them.
Grade ICT Price Action After 9 a.m.
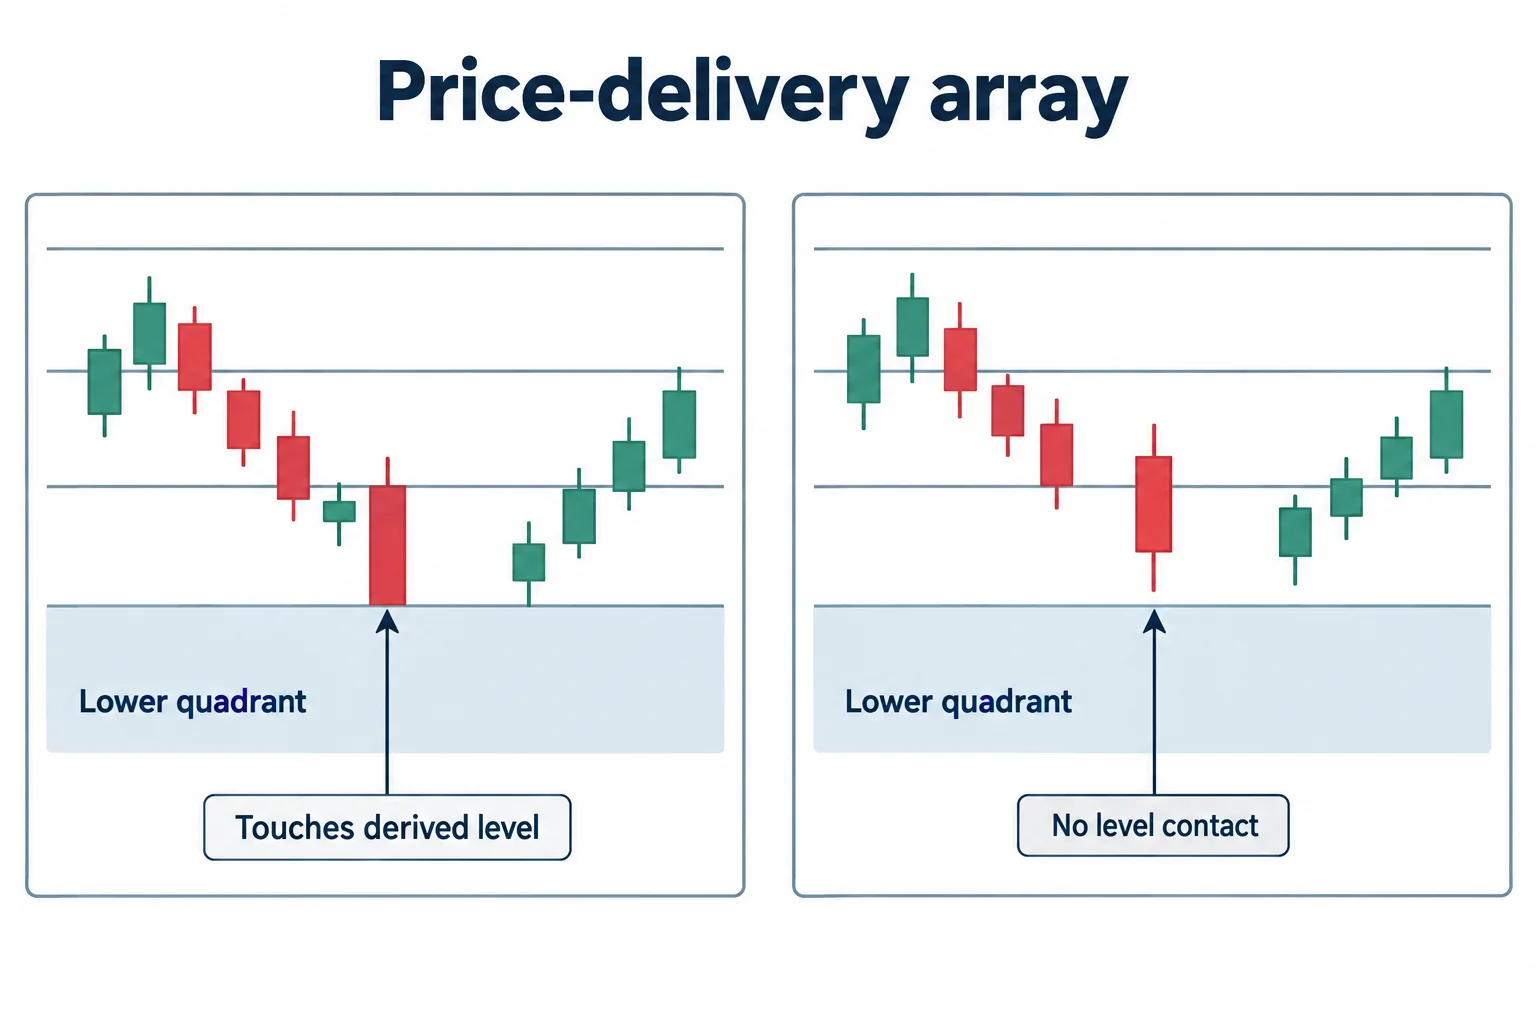
From 15:53 he sets the rule he uses for the rest of the example: any price-delivery array that forms after 9:00 a.m. only becomes relevant in this exercise when the candle that created it touches or overlaps one of the levels derived from the 7:00-9:00 a.m. range. A formation sitting in unmarked space, he says, is not tethered to anything and is therefore ignored.
He then walks the first post-window candles. At 18:16 he marks the candle at 9:01 and then establishes which part of the measured range it is tethered to, saying at 19:20 that the array sits on the lower quadrant level of the 7:00-9:00 a.m. range. At 19:49 he identifies an array he reads as 28,400.75 – a value he ties to the lower quadrant of the measured range – and at 20:07 he describes a small volume imbalance inside it, which he labels a suspension block and reads as a reason to expect continuation higher rather than a reversal. The vocabulary he uses across this stretch includes imbalances, inversion fair value gaps, consequent encroachment, breakaway gaps and relative equal highs and lows, each attached to a specific candle on his chart rather than defined in the abstract. At 20:28 he points out that the move he is tracking began one minute after the 9:00 a.m. window closed, and at 20:46 he describes the follow-through array as a breakaway gap that should carry price through a nearby short-term high.
The governing attitude he asks for is stated plainly at 21:41: anticipate rather than react. In his telling, the range work exists so that levels are already on the chart when price arrives, and each later touch is graded against a specific coordinate – a quadrant line, a midpoint, or the consequent encroachment of a gap, as at 23:10 – instead of being appraised after the fact.
What ICT Reports About Intraday Price Action
He says at 5:45 that he posted a chart to X at 8:14 a.m. on the Friday in question, and at 32:37 that the 28,400 level was the target named in that post before the move. Returning to the chart at 32:04, he describes taking a short after the run into his projected high, taking a partial as price worked lower, and then watching price trade down through the pre-session low area into the 28,400 objective.
This is his own account of what he did. An audio transcript cannot establish order fills, position size, account results, or whether every annotation he shows was present in real time, and the linked post is not reproduced or independently verified here. He also asserts at 34:20 that the process is characterised by anticipation rather than reaction; that claim rests on his own chart and his own record, not on evidence available in this article. Read the sequence as a worked example of his method, not as verified profitability or a template to copy.
Project an ICT Price Objective on the Daily Chart
The last section of the recording moves up in timeframe. At 47:03 he strips most of the intraday annotations away and demonstrates how he would estimate a daily low. He measures the previous day’s range, which at 50:30 he projects to 28,111.5, and then measures a specific daily wick as though it were a gap, arriving at 28,097.25 at 53:57 and 28,124.25 at 55:51.
His stated reason for choosing those references is a lookback rule given at 51:56: the last three trading days contain the liquidity and inefficiencies that matter most to an intraday trader, and only once price breaches that three-day range does he look further back – a view he repeats at 52:30. He then overlays the projections and keeps the area where they cluster, at 58:41 describing daily wicks as being treated like gaps and at 58:55 saying a projected daily high or low will usually sit inside a cluster of arrays rather than on a single line.
Those four numbers are what the machine transcript records him reading from his own chart during that segment. They depend on his chart’s data feed, session settings and drawing choices, and they cannot be reproduced from the audio alone. Treat them as reported figures, not verified market data.
ICT Intraday Price Action Study Checklist
- Fix the clock first. Confirm the chart’s time zone and session template before measuring anything, and note that Eastern Time shifts between standard and daylight time.
- Record the 7:00-9:00 a.m. Eastern high and low only after 9:00 a.m., using the candles inside the window and no others.
- Choose one convention for the candle that closes the window and apply it every day, because a partial candle will change the recorded extremes.
- Write down the subdivisions you intend to watch – midpoint, quarters, eighths, negative 0.5 extension – before the session starts.
- If you test price-delivery arrays, require the same tethering rule he uses: the array must touch a level derived from the range.
- Keep observations separate from entries. A touch of a level is not a signal by itself.
- Log uneventful days and failures alongside the interesting ones, and check each session against the exchange calendar before pooling results.
- Measure any idea against the rules of your own account, including drawdown, news and consistency limits, which vary by program and can change.
What ICT Intraday Price Action Does Not Prove
The lesson offers no statistical testing, no sample size and no verified track record; the claims of precision and superiority in the recording are the speaker’s own assertions. The transcript is automatic speech recognition, so terminology such as buy-side or sell-side imbalance is sometimes rendered as nonsense syllables, and the numbers quoted above should be checked against the video before being reused. Nothing here is a recommendation to trade any level, and no level described as projected should be read as a guaranteed turning point.
Related ICT Part 1 Intraday Price Action Video
The mapped source for this article is Part 1 High Precision Secrets To Intraday Price Action on the channel The Inner Circle Trader. This BestProps page is independent educational commentary: it is not an official ICT lesson, and the reported levels, trades and outcomes described in the recording are not independently verified here.
Watch the original lesson on YouTube
This video cannot be played inside another website: the embedded player itself reports “Playback on other websites has been disabled by the video owner.” That response was read from the player on 2026-09-13, so no player is reserved here and no embed is left blank. The lesson is available directly on YouTube.
Watch Part 1 High Precision Secrets To Intraday Price Action on YouTube ↗
ICT Part 1 Sources
- The Inner Circle Trader: Part 1 High Precision Secrets To Intraday Price Action – the mapped recording. Its watch page was read on 2026-09-13: public, not unlisted, credited to The Inner Circle Trader, publication date 2026-08-01, runtime about 59 minutes. The player reported that embedding is disabled by the video owner.
- TradingView Help Center: Time intervals: a quick introduction and tips – platform documentation explaining that a candle is built from four prices over the selected interval and that the exchange close can leave the final candle of a session partly formed, which is why the closing-candle convention for a timed window should be fixed in advance.
- CME Group: Holiday and Trading Hours – the exchange’s own session schedule, which documents holiday date ranges and adjusted closes. A window measured through a modified session is not comparable with a normal one.
- BestProps: Prop Firm Drawdown Rules by Calculation Method – this site’s document-based comparison of static, trailing, intraday, end-of-day, daily and maximum-loss rules. The page states that it does not report first-hand account purchase, trading, support, identity-check or payout testing.
Intraday trading and leveraged products involve substantial risk. This material is educational, records what a speaker said in a public recording, does not promise an outcome, and is not individualized financial advice. BestProps is not affiliated with The Inner Circle Trader, CME Group or TradingView, and no source listed here endorses this article.
