
Key takeaways
In the February 17, 2026 commentary, ICT reviews the dollar index, EUR/USD and GBP/USD daily charts after months away from forex, and then the continuous and March Nasdaq futures charts plus the S&P. He refuses a firm forex bias because he can argue both directions, says he is presently bearish on stock indexes, and tells viewers to study with a single micro contract in simulation rather than act on his commentary. The commentary is not an independently verified trading record.
How we researched this article
BestProps used document-based research from primary firm sources, checked September 24, 2026. The complete source list, scope, limitations, and commercial-state record appear near the end of this article.
In ICT 2026 Forex & Futures Commentary February 17, 2026, a short review on the channel The Inner Circle Trader, ICT works through two very different jobs in about twenty minutes: getting himself back in sync with the currency markets he had not followed for months, and reading index futures he describes as volatile and disorganised.
The recording is unusually candid about the first job. He admits he is re-acclimating, says he can argue either side of several markets, and states repeatedly that what he is describing is study material rather than trade advice. This recap follows the full timestamped transcript. It reports his February 17 outlook, not a current market forecast or an independent test of his results.
ICT commentary starts with the daily forex charts
The recording runs about 20 minutes 52 seconds. ICT names February 17, 2026 near the start and begins with the dollar index, followed by EUR/USD and GBP/USD. At 2:44, he says his forex commentary will be limited to Tuesdays and Thursdays. This is a dated check-in, not a daily signal service.
The distinction between an outlook and a trade matters throughout the review. He can prefer one direction while still finding the conditions too uncertain to act. For a prop trader, that is more useful than treating every directional opinion as an entry: having a view does not require putting an evaluation account at risk.
ICT forex commentary avoids a hard directional bias
On the dollar index he notes that a recent high was taken and aggressively sold off, and that the market sits at a place where he could argue either direction. His stated preference is a revisit of the recent low, with the alternative that a close above the area he is watching would send him back to higher references (1:46).
What he says next matters more than the levels. At 2:09 he describes these as the ideas he is holding at the moment, explicitly not something he can take a trade on and not something he is suggesting the viewer use for their own entries. It is, in his words, him getting in sync.
The euro section follows the inverse relationship he expects against the dollar, and again he declines to commit. After noting a run above an old high that failed, he says he could make a case for both sides, and draws the conclusion that defines his framework: if a market can plausibly produce both outcomes it is not high-probability conditions by his definition, and in that case he will not give a hard directional bias (3:42). The pound discussion reaches the same balanced conclusion, with sell-side liquidity resting below and buy-side above, and two opposing scenarios described (4:07).
He also states a self-assessment that should be read carefully: he says that when he is genuinely one-sided his strike rate is “pretty much a 90%” rate, and that this is not one of those occasions (4:50). That is his claim about his own history; this transcript-based review does not verify that rate or establish an independently audited track record.
The method he describes is top-down and deliberately narrow: he starts from the daily chart to identify what he calls the draw and the broader ebb and flow, and says that if he cannot discern the daily direction, the lower timeframes will not talk to him (5:11). Refusing to manufacture conviction from a smaller timeframe is the most portable idea in this half of the recording.
ICT futures commentary favors lower prices but warns against risk
The second half opens with risk rather than setups. He says the markets are fast and disorganised and that anyone studying the action should be in a single micro contract rather than a mini, which he considers too fast for the viewers he is addressing (5:34). Later he tells viewers to observe and study rather than take risk from his commentary (9:53), and adds that he does not want to hear about it if they make money (10:16).

He walks the same structure on a continuous Nasdaq chart and then on the March delivery contract, using the terms that recur throughout his material: what he calls a suspension block, consequent encroachment into a premium wick, successive imbalances, and a set of relative equal highs he describes as an earlier daily-chart draw. His stated conclusion is direct: he is presently bearish on stock index and thinks lower is more likely than higher, while flagging that a small gap could turn out to be a breakaway gap rather than something to be filled (6:50, 8:42).
The intraday section is the most instructive part. He contrasts electronic trading hours with regular trading hours, marks the previous regular-session settlement against the 09:30 open, and because the session opened below the prior settlement he labels the distance between them the regular-trading-hours opening range gap. He then subdivides that gap and watches how candle bodies and wicks interact with the internal levels (14:02).
He also explains why the move stopped where it did rather than running to the range extreme: in choppy, range-bound conditions he expects price to use the inefficiencies inside the range and to keep the range intact, and only sometimes does a break of the range signal a shift from high-resistance to low-resistance liquidity runs (12:14). That is a rule about expectations in specific conditions rather than a signal.
On the S&P he is blunter: he calls that chart a mess and says he would not touch it, and that the Nasdaq is only slightly better (17:37). His macro framing is that the market is in distribution with longs being liquidated and that the next move is likely to be event-driven, with his target being the lows into the first half of the year and the possibility of melting to those lows through the summer (18:35). He then goes further, saying there is nothing positive in the economic outlook and that he does not trust the economic data because he believes it is manipulated and late (19:01). Those are his opinions and his speculation about geopolitics; they are not findings the chart review establishes, and this recap does not test whether those forecasts came true.
ICT futures gaps depend on the chart session
The clearest mechanical lesson is the difference between an overnight move and the regular-session opening gap. At 13:00, ICT identifies 07:00 Eastern time on an electronic-trading-hours chart of the March contract. He describes a move down into a 15-minute imbalance and a return toward old highs. That is one view of the trading day.
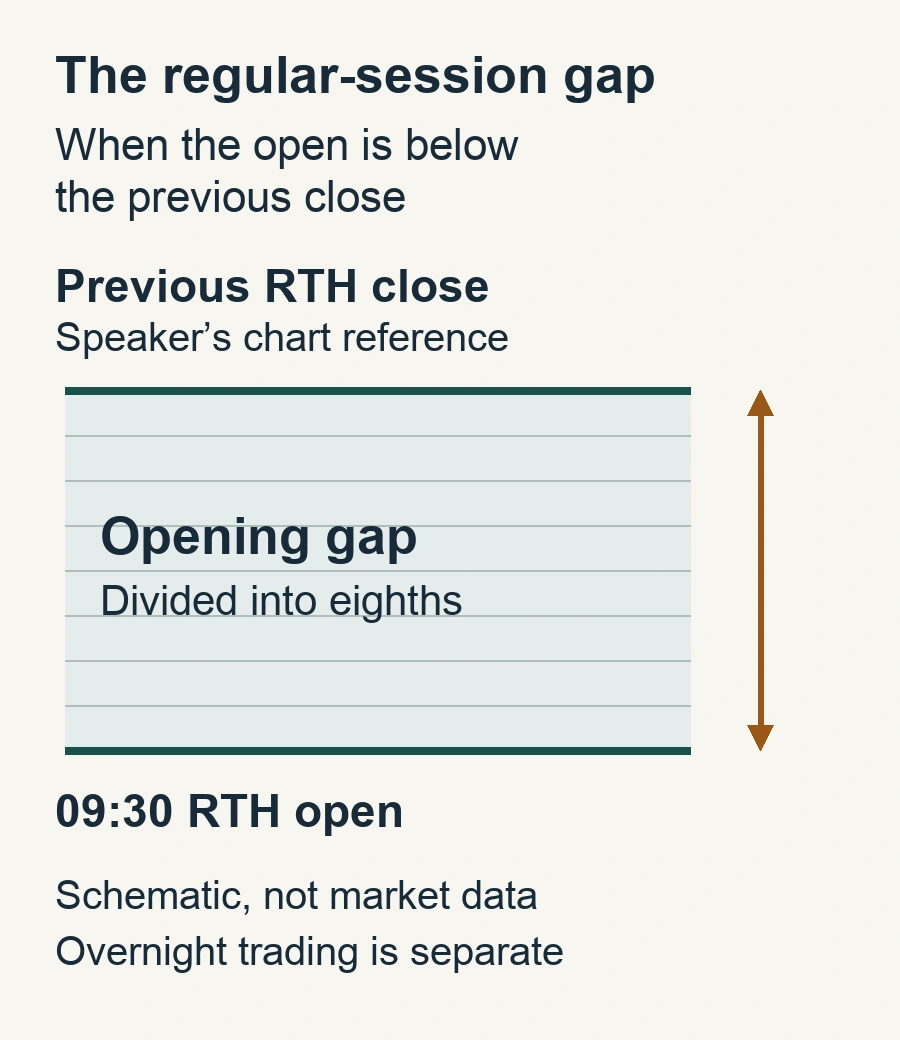
He then switches to regular trading hours. In his example, the 09:30 open is below the previous regular-session closing reference, which he calls the settlement price. Those two endpoints define the gap he measures. He explicitly says this measurement does not include all the electronic trading between them. Do not confuse that chart reference with an independently verified exchange settlement calculation.
At 14:53, he divides the opening gap into eighths and quadrants, then discusses candle bodies around the previous close and wicks extending beyond it. A gap in this recap is therefore a relationship between specified session references, not a claim that no trading occurred overnight.
The contract distinction matters too. ICT first uses a continuous Nasdaq chart, then switches to the March-delivery micro Nasdaq contract. He says the charts look slightly different. His later 15-minute, one-minute and 15-second examples belong to the delivery-contract discussion; treating every chart as the same continuous series would erase a distinction he deliberately makes.
ICT futures examples connect the range to lower timeframes
The intraday explanation moves from the daily view to a 15-minute imbalance, then to one-minute and 15-second detail. At 15:33, he describes a fair value gap becoming an inversion fair value gap. In his account, an area that had one role is subsequently used from the opposite side. At 16:43, he connects the smaller-chart move to his Model 2022 terminology and follows it back toward the 15-minute imbalance.
This is a narrated reconstruction, not evidence that every label could have been identified in advance. He also refers to working with his son Cameron and to a student’s trading. Those personal accounts do not provide this recap with independently verified entries, fills, account statements or returns.
His own range-bound qualification is important: he expects internal inefficiencies to matter when the broader range remains intact, and says a move outside the range can, but does not always, mark a change in conditions. The useful distinction is between a conditional explanation and a promise that price must follow a particular path.
ICT commentary has important evidence and risk limits
This is a transcript-based recap, not a frame-by-frame chart verification. Automatic transcription can mishear specialist terms, and spoken references such as “this high” do not supply an independently readable price. The discussion above attributes chart behavior and market views to ICT; it does not certify chart annotations, execution or subsequent results.
The upload’s own description states, “Trading performance displayed herein is hypothetical.” It also explains that simulated results do not represent actual trading and may differ because of hindsight, liquidity and financial risk. His self-reported strike rate and the family or student trading anecdotes should not be treated as a tested expectation of returns.
Near the end, ICT warns about impersonators offering mentorships, memberships and crypto investments in his name. In this recording he identifies both his YouTube channel and his official X account as his online sources, not YouTube alone (19:43). That is a warning from the speaker, not an endorsement of any account or offer by BestProps.
What prop traders can take from ICT commentary
The value in this recording is not a forecast. It is the behaviour of a discretionary trader working a market he admits he has lost touch with: start from the daily chart, say out loud when both directions are plausible, refuse to force a bias in low-probability conditions, separate the continuous contract from the delivery contract, mark the regular-session open against the previous settlement before interpreting a gap, and tell the audience to study in a demo account with one micro contract, or simply observe price, instead of acting on the commentary. The signals themselves are openly hedged, and the macro opinions at the end are opinions.
This is independent educational commentary, not investment advice, and nothing here should be read as evidence that the described approach produces a repeatable edge. Trading involves substantial risk of loss.
A micro contract does not remove trading risk or override a prop firm’s account conditions. A demo-study recommendation is not permission to trade an evaluation account. Read the actual account terms and understand how prop firm drawdown rules work before putting a method into a rule-constrained account.
Watch the original ICT commentary
Watch ICT’s February 17, 2026 Forex & Futures Commentary on YouTube for the speaker’s full explanation and chart context. This article is independent educational commentary, not official ICT material or investment advice.

