
Key takeaways
ICT’s June 2, 2025 NQ review uses the two most recent nearby 15-minute fair value gaps as a rolling study frame. Mark each gap’s high, midpoint and low, then follow how price moves between them. The review links that frame to an earlier daily bullish order block, Friday’s one-minute gaps and the new-week opening gap. These are the presenter’s retrospective interpretations, not independently verified fills or a tested trading edge.
How we researched this article
BestProps used document-based research from primary firm sources, checked September 24, 2026. The complete source list, scope, limitations, and commercial-state record appear near the end of this article.
In 2025 Storytellers Series – NQ Review June 02, 2025 on the channel The Inner Circle Trader, the speaker opens a series built around a single discipline: writing down what a session looked like, in order, and asking who was caught on the wrong side of it. The summary below follows his explanation of the session and the two-gap study method, with links to the relevant moments.
The recording is a review rather than a signal service, and he says so himself at the start. What can be checked is what the recording states and when it was published. What happened on the charts, in an account, or in a result cannot be checked from the audio, and nothing here presents them as verified.
What the Storytellers series is
He introduces the format in the first two minutes (0:30–1:26). The exercise, as he describes it, is to take price action that has already happened and flesh out a narrative and a bias from it: where the inefficiencies were, where the stops were, who was being paid before the stop run, who was trapped, and who had been led to believe their trade would work before it failed to reach the objective they wanted. He tells viewers he will keep these short and that they are not a complete overview of any session; they are meant to prompt the viewer’s own chart work. He also says he will touch on what he shared on X that morning (1:31).
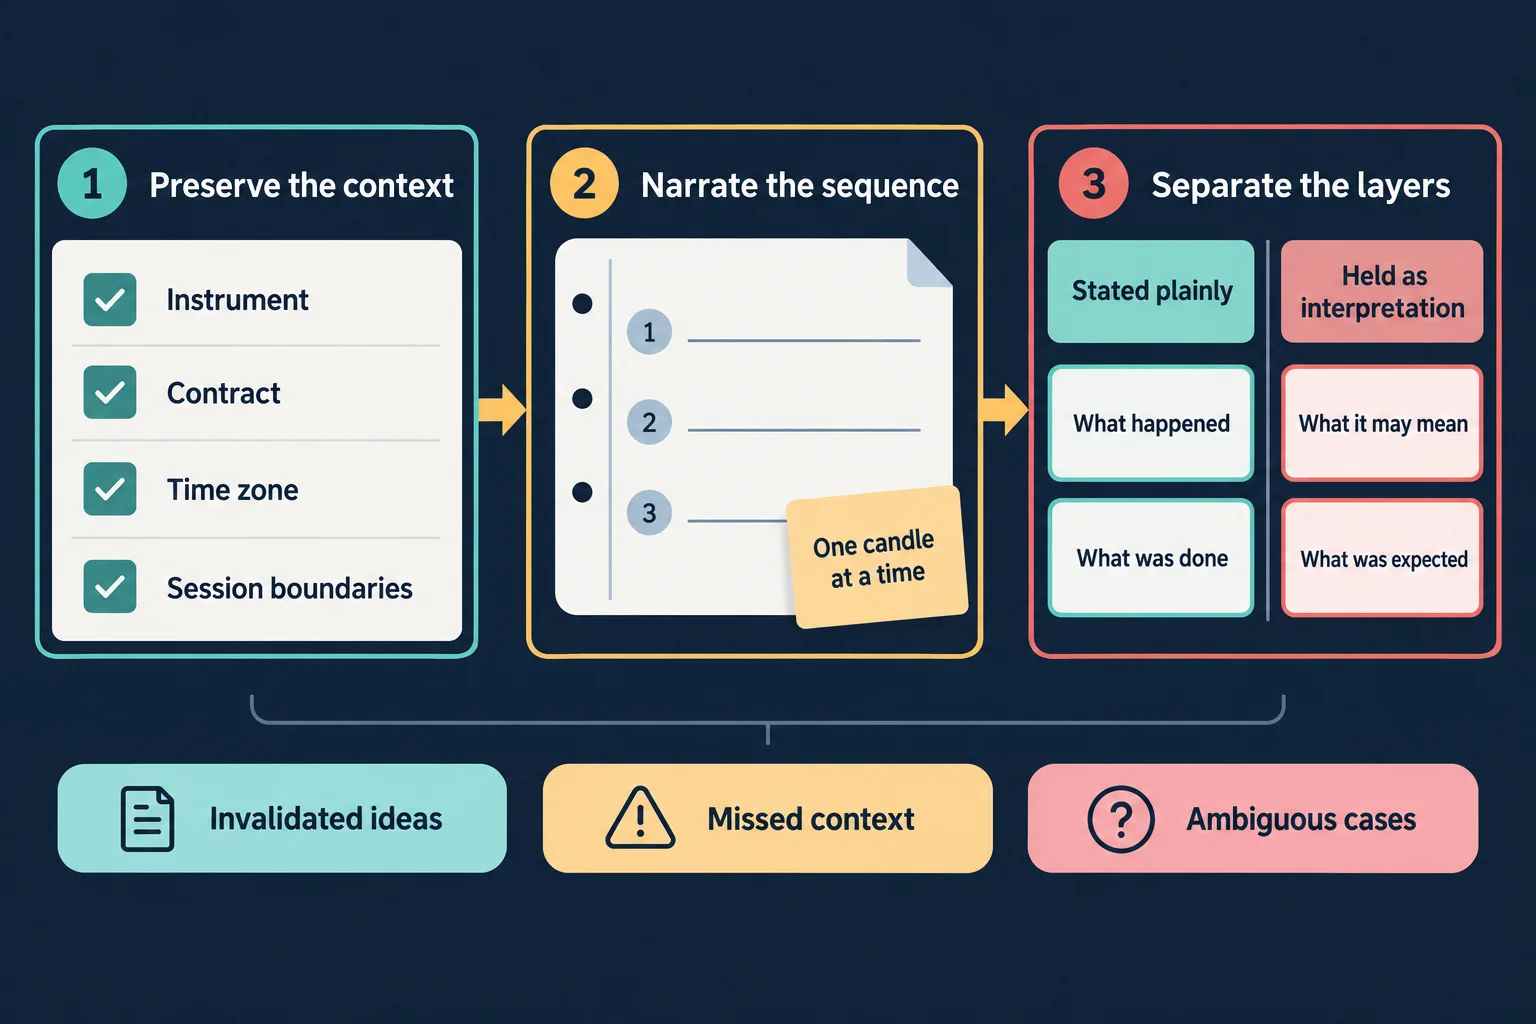
He states the honest difficulty himself: in hindsight you need the narrative because, as a beginner, you do not yet know what you are looking for, and the aim is to build that habit before applying it to live price (0:41–1:00).
The recording and the session it reviews
The Inner Circle Trader published this 23-minute review on June 2, 2025. He identifies the same date in the narration and refers to levels from the previous week and Friday. The review concerns the June 2 session, not June 3.
He works the actual June 2025 delivery contract rather than a continuous contract, and says why: the review is intraday and short-term, so a continuous series is not required (1:48–1:54).
This is a summary of the spoken explanation, not an independent reconstruction of the chart or a verification of trading results. Ambiguous numerical passages are not used as price evidence.
The references he carries into the session
Three levels do most of the work. First, a gap he says the channel was already watching as an upside objective, which price hit the previous week before selling off (2:11–2:22). Second, the down-close candle he treats as a daily bullish order block, whose opening price he calls the discount level price traded down to in the prior week and again on the morning in question before being sent back above the rejection block, his name for the highest up-close candle (2:30–2:52). Third, an older overhead imbalance, or SIBI, whose lower boundary and consequent encroachment (the midpoint of a range in ICT usage) he wants to see price reach and then trade outside of (2:57–3:25). Throughout, his stated posture is to avoid picking a top in NQ.
He says the blue line marking the daily bullish fair value gap carries down into every lower timeframe during the review (3:35), and points back at the hourly chart to a buy-side imbalance, sell-side inefficiency whose consequent encroachment, in his account, price hit on the prior week’s decline (3:44–3:59). He notes he shared that observation on his X account at the time.
The 15-minute chart, and the two-gap canvas
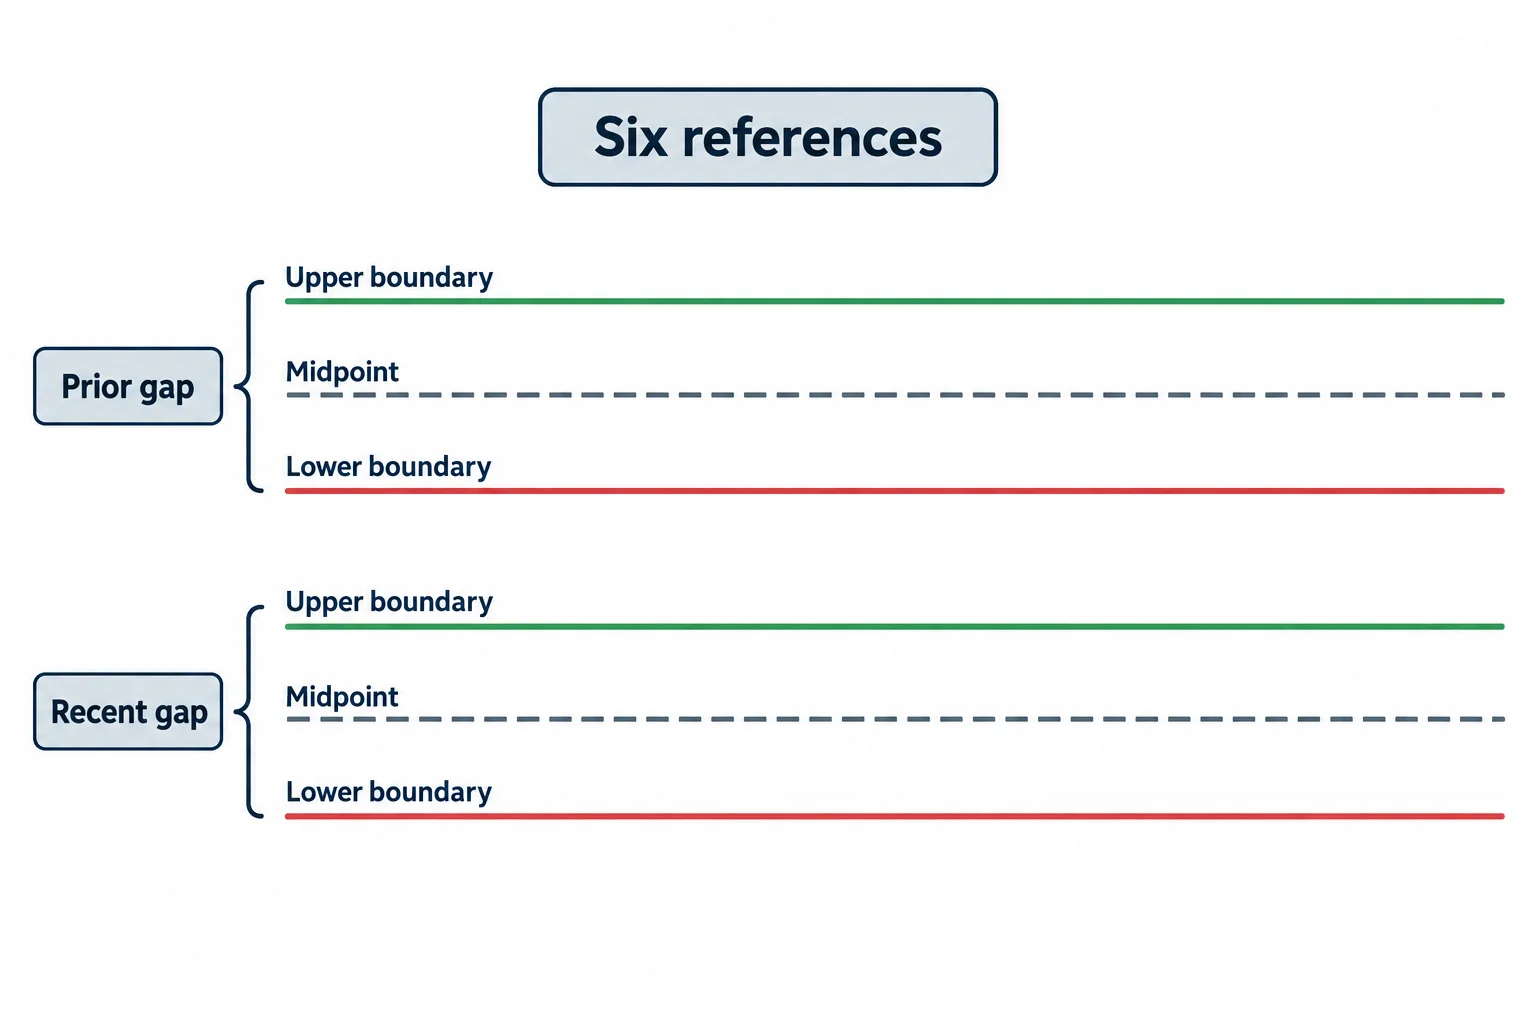
The centrepiece of the lesson is a study method rather than a signal. He calls the 15-minute chart his “bellwether” timeframe: on his account it displays most of the liquidity pools and imbalances he needs, without dropping to daily, four-hour or hourly charts (4:23–4:36). On that chart he selects two fair value gaps that formed close together, the most recent one and the one before it, and marks each one’s upper boundary, midpoint (consequent encroachment) and lower boundary, giving six reference levels to read price against (5:36–6:17). When price runs away and leaves both gaps behind, he says, you simply take the next 15-minute gap that forms and keep the older ones on the chart without working to them (6:08; 20:19–20:41).
His stated purpose is pedagogical: a beginner staring at price without a defined frame has nothing to study, and the rolling pair of gaps supplies one. He is also explicitly dismissive of the alternative: indicator crossovers and Level 2 order-book data, which he says is spoofed and which he says he never uses (13:53–14:40; 20:49–21:10). That is his opinion about order-flow tools, offered as a reason for his method rather than as evidence about market behaviour.
How he narrates the 2 June session
On the one-minute chart he starts from the previous Friday: a first-presented fair value gap in the 9:30–10:00 a.m. Eastern opening range at 9:35 a.m., and a second one at 10:12 a.m. that he says he flagged at the time as notable and carried forward (11:34–12:09; 12:44–13:03). He notes that the Friday 10:12 gap sits inside the upper quadrant of the new week opening gap, and that the new week opening gap high is the previous Friday’s settlement, the level he expected to be drawn to later in the day (12:03–12:33).
For the session itself, the sequence he walks through is: stops raided below the level before 6 a.m., price returning inside it, a decline into the low of the fair value gap followed by consolidation around its consequent encroachment, a push above it to the high, and a gravitation toward the higher 15-minute gap (13:10–13:42). He then describes sweeps above and below the same area, and an opening-range raid that took sell-side liquidity under relative equal lows inside the gap, down to the high of the first gap he had flagged (14:53–15:24).
From there he works through the day in order: relative equal lows set up an initial rally, a drop clears that liquidity and reaches the high of the 15-minute gap, price rips higher and returns to the consequent encroachment and upper quadrant while leaving the lower half of the range untouched, which he describes as exactly what he wants to see if the day is bullish, before rallying into Friday’s first-presented gap and then into the first-presented gap of the new session (15:59–16:44). He reads the repeated drops beneath relative equal lows as accumulating the sell-side liquidity needed to fill long positions, and follows that thread into the afternoon session, where a final push in the last ten to fifteen minutes of trading takes price above the new week opening gap high (17:49–18:21).
He then counts the opportunities the two gaps alone would have offered, marking entries and exits as A to B rather than as prices: two trades inside roughly half an hour, or one long with scale-in and partial exits, and later a short into a retracement to the higher 15-minute gap that he says he demonstrated on X that day, followed by another long taking out the high above it (18:26–20:04). He frames the choice as the viewer’s: use each leg as a standalone setup, or use the levels to manage one position.
Hindsight, and how he answers for it
He addresses the obvious objection directly. A retrospective review is, by construction, looking at a completed chart, and he expects critics to say the exercise is easy in hindsight (6:41–7:11). His answer is that he recorded himself discussing these gaps on X on the morning of 2 June 2025 and uploaded that recording in a form he says could not have been re-voiced afterwards, and he points to links to his own X posts as the standing evidence for that claim (7:05; 15:26–15:31). The recording does not independently substantiate those X posts; the account of what he posted is his own.
Near the end he makes a further historical claim about himself: that when he traded currencies he ran small balances to large multiples quickly while risking roughly four and a half to five percent per trade, with position size increasing as equity grew (22:15–22:48). That is a personal claim, not a verified track record, and that risk must not be copied into a funded account without checking its loss limits. A loss of that size can exceed an account’s permitted daily or trailing drawdown. Nothing in this article repeats that claim as guidance. He closes saying the series will alternate between NQ and forex examples depending on how tired he is (23:03–23:15).
Limits of the NQ review
This is the presenter’s retrospective explanation, not an independently verified execution record. Liquidity, order blocks and the idea of trapped traders are his interpretive model; a price chart alone cannot establish individual traders’ intentions. The review should not be treated as proof of profitability.
Primary source and further reading
- The recording: 2025 Storytellers Series – NQ Review June 02, 2025. The Inner Circle Trader (the primary source; timestamp links above open the relevant passages).
- CME Group: E-mini Nasdaq-100 futures: contract and trading hours (contract information and exchange trading hours).
- CME Group education: Understanding Futures Expiration & Contract Roll (contract lifespans and rolling).
- TradingView Help Center: changing the chart timezone or clock (chart-clock settings).
This is independent commentary; the cited sources do not endorse this article. The ICT terms used on this page. fair value gap, inversion fair value gap, consequent encroachment, PD array, bullish breaker, liquidity sweep and sell-side imbalance buy-side inefficiency. are descriptive study language for third-party educational concepts; none has been tested first-hand by this site and none is presented as official, validated or free of repainting. No fill, size, price, profit or loss is reported anywhere on this page, and the only performance claims mentioned are the speaker’s own, attributed and unverified. Nothing here is investment advice or a recommendation to trade futures, and futures trading carries a substantial risk of loss.


