
How we researched this article
BestProps used document-based research from primary firm sources, checked September 24, 2026. The complete source list, scope, limitations, and commercial-state record appear near the end of this article.
This 27-minute recording is the morning review ICT published on 7 May 2025, and he introduces it by saying it covers Monday and Tuesday of that week.[1] The same afternoon the Federal Reserve released its FOMC statement at 2:00 p.m. EDT, the event behind his closing warning not to force a trade later that day.[3]
The session analysis below follows the recording’s automatic audio transcript; the external sources separately establish publication and calendar context. Timestamp links open the video at the moment described. The transcript is machine-generated, so some of ICT’s vocabulary is garbled or missing, and nothing here verifies the chart markings, the tool positions he describes, the account figures he shows on screen, or any contract month. Where the transcript is unclear the article says so instead of filling the gap. His framework — liquidity, time of day, fair value gaps, and price delivery he describes as scripted — is his own interpretation; the recording is not evidence that markets follow a fixed script, and none of the described positions are presented here as verified results.
The levels he carried into the week
At 0:43 ICT opens on a Nasdaq daily chart for the June delivery contract and returns to the premium wick of the previous Thursday. He breaks that wick into five levels — its high, upper quadrant, midpoint (consequent encroachment), lower quadrant and the open of the candlestick — saying he carried them forward and would keep them on the slides (0:47, 0:56, 1:08).
He then describes price dropping into a daily imbalance on the Tuesday and names the draw he was watching, which he ties to the Friday non-farm payroll session; the phrase is garbled in the transcript, so the specific session he means cannot be pinned down from the text alone (1:18, 1:26). He sets the condition that would negate it: a close below the bullish fair value gap he had highlighted on the daily chart (1:49).
Market maker sell model on the one-minute chart
At 2:05 he moves to a one-minute chart and points out relative equal lows, a run of higher highs, then an aggressive break lower with a shift in market structure before price trades back up. He labels the sequence a market maker sell model — explicitly distinguishing it from Wyckoff — and stresses that second-stage redistribution is, in his framework, the most powerful leg of the move (2:09, 2:29, 2:43). The Thursday wick levels are overlaid on that chart and he zooms into Monday’s first presented fair value gap on the way down (2:46, 3:04). At 3:16 he says the execution clips are recorded on his X account; those posts are not part of the recording and are not re-asserted here.
Tuesday: limited chart time, not a full-session trade
At 4:12 ICT switches to Tuesday. He says family commitments limited his time at the charts, but that he tried to fit in an early trade. That matters when interpreting the recap: his account of an opening trade is not a claim that he participated in every later move. He also says his earlier X Space on narrative versus bias was difficult to hear and that he hoped to make a clearer presentation (4:30).
Liquidity and time of day, without the opening-gap tools
At 7:39 he responds to a criticism he says he receives in his comment section — that his macros or his new week and new day opening gaps are indispensable. His answer is that the executions he is about to show do not rely on the new-week or new-day opening gaps, but on liquidity and time of day. The pool he says he looks for every day is the range between 7:00 a.m. Eastern and the 9:30 opening bell, a 150-minute window (9:17). The automatic transcript calls this a “90-minute” window, but the stated endpoints span two and a half hours. Use the endpoints rather than that inconsistent duration. For cash-market context, NYSE lists its core session as 9:30 a.m. to 4:00 p.m. ET; this is not a specification of NQ futures trading hours.[4]
Turning to the session itself, he says the 9:30 candle traded below relative equal lows and that he expected a draw up to clear the relative equal highs above before price turned back down — a later move he says he would not be able to participate in because he would be away from the charts (7:07, 7:27). At 9:47 he points out that the opening range gap was a gap lower, that he therefore expected an attempt up into it, and that the level he calls low-hanging fruit was the first presentation of relative equal highs encountered when looking back from the open rather than a finer level on a 15-second chart (10:24, 11:34).
He then walks through the trade as he says he took it: the candle that traded below the equal lows and reclaimed them, a run through a breaker that left a small opening as a breakaway gap, an entry with the stop one tick below the low, and an exit at the relative equal highs above (10:56, 11:44, 12:14). He notes price folding back to the daily bullish fair value gap afterwards, which he reads as a stop-run on anyone chasing the move, before it rallied again (12:22). The transcript carries his narration of those tool placements; it does not independently confirm them.
What he calls the gauntlet
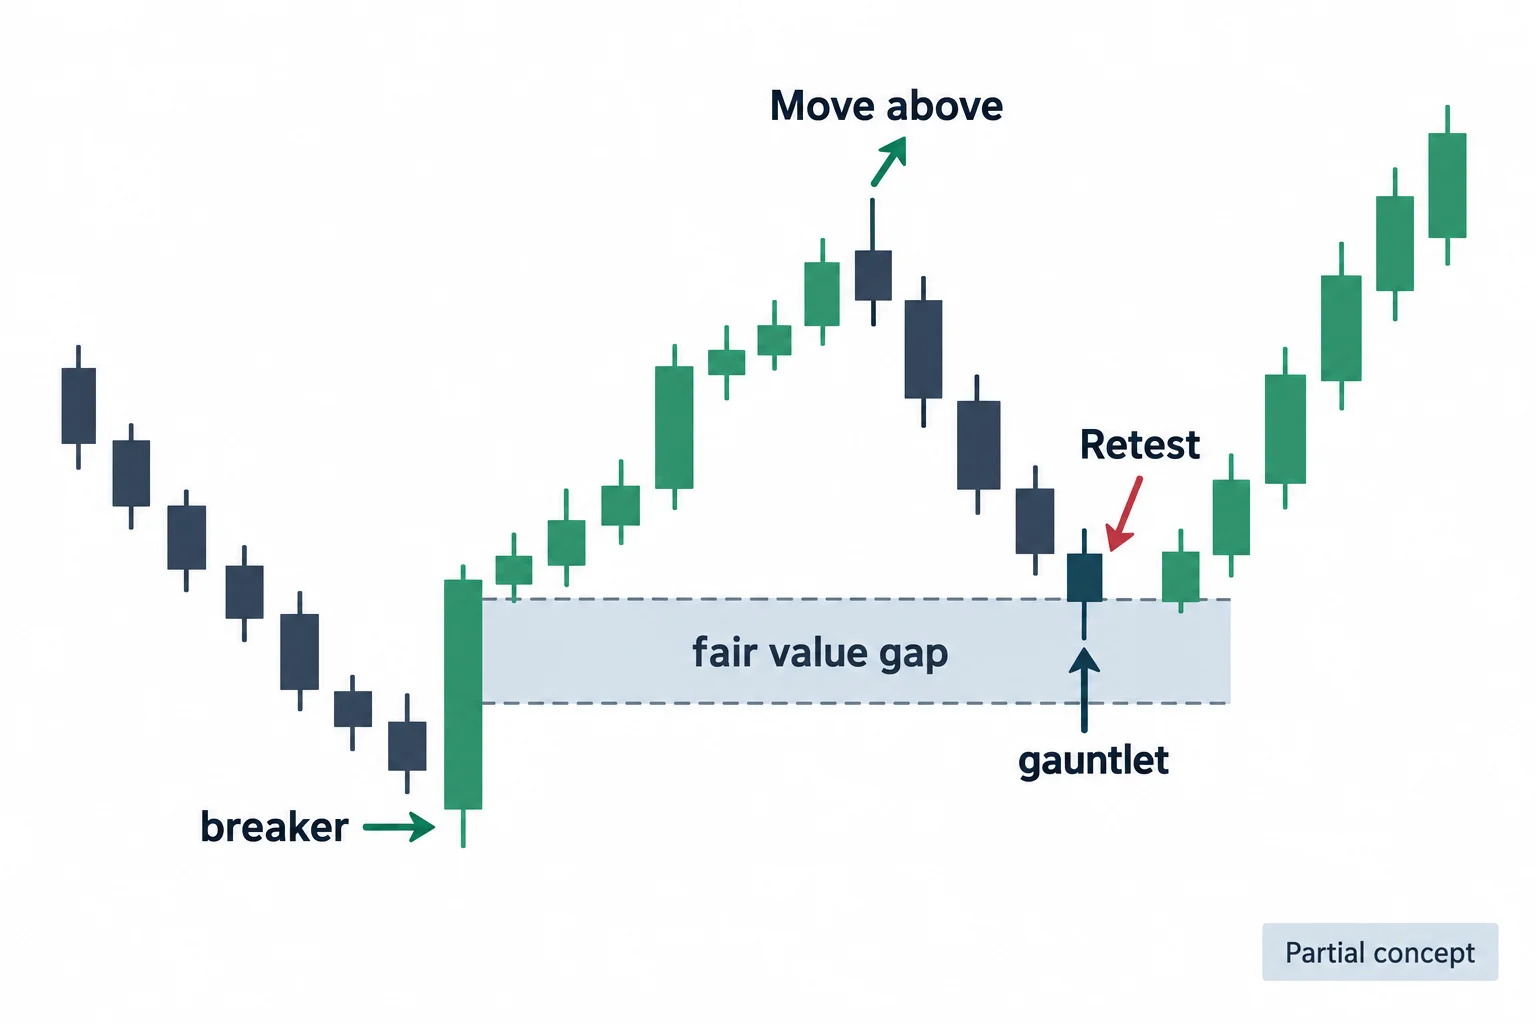
The concept the title advertises arrives at 14:06. ICT says that when a pool of liquidity is taken and the sequence forms with a breaker, he looks inside the leg of that breaker for a fair value gap. Going back from the low, the first fair value gap he reaches — using the volume imbalance — is what he labels the gauntlet, and he describes it as the lowest first sell-side imbalance / buy-side inefficiency inside the run of a bullish breaker, reversed for a bearish one (14:57, 15:37, 15:55). His stated entry is a read back above that gap followed by a return into it, with further adds on the retest (16:13). He also says plainly that he is leaving some of the detail out because others rush that material into print, so the description in the recording is deliberately incomplete (17:04).
He ties the idea back to his silver bullet teaching, arguing that a sell-side imbalance running into an inversion fair value gap is the same mechanism, and separately flags a buy-side imbalance / sell-side inefficiency level and an institutional order flow entry drill on the 15-second chart (17:27, 19:39). At 18:07 he begins comparing a candle low with a volume-imbalance quadrant, then reports matching values at 18:25 and 18:39. He presents the match as an algorithmic signature. The comparison remains his claim: the chart coordinates have not been independently checked, and matching levels would not by themselves establish that price delivery is scripted.
He then rebuilds the 9:50-to-10:10 macro on a 15-second chart and lists what he says converged there — a shift in market structure, the silver bullet window, the entry drill, the wick, the gauntlet, a low-to-low “turtle soup” reading and a wick consequent encroachment — calling it a confluence of factors (21:21, 21:41). He says he works executions on a 15-second chart, describes entering inside the 9:30 candle’s move with the stop below the low, and notes that the candle bodies held inside the lower quadrant while the wicks probed the volume imbalance before price ran to the liquidity above (22:12, 23:09).
The afternoon, and the figure he shows on screen
At 24:07 he says that in the afternoon he took a one-for-one risk, banked part of the earlier profit, re-risked it and added on a retest. He then totals the positions he attributes to Monday morning, Monday afternoon, Tuesday morning and Tuesday afternoon at roughly $103,000 according to his narration (24:12). That figure is his reported total, not an independently established result: the transcript cannot verify the account, the fills or how the total was produced, this article treats the number as a claim rather than a verified result or a reason to copy the trade. The recap continues with Wednesday’s wick levels being reached, then the week’s first presented fair value gap being worked through its upper half before price broke lower (24:41, 25:29).
What he said about the FOMC decision
The recording closes on the day’s event risk. At 26:24 ICT says that with FOMC later that day the practical answer is to stay away, that his longer-term view is that price could trade higher, that he is not trying to pick a top, and that he would like to see a run that squeezes traders positioned for downside — even if it only prints a higher daily high before turning lower. His stated draw was the relative equal highs above (27:07). The Federal Reserve’s statement for that meeting was released at 2:00 p.m. EDT on 7 May 2025.[3] The recording ends there, so what price did after the decision is not part of this source.
How to study this recording
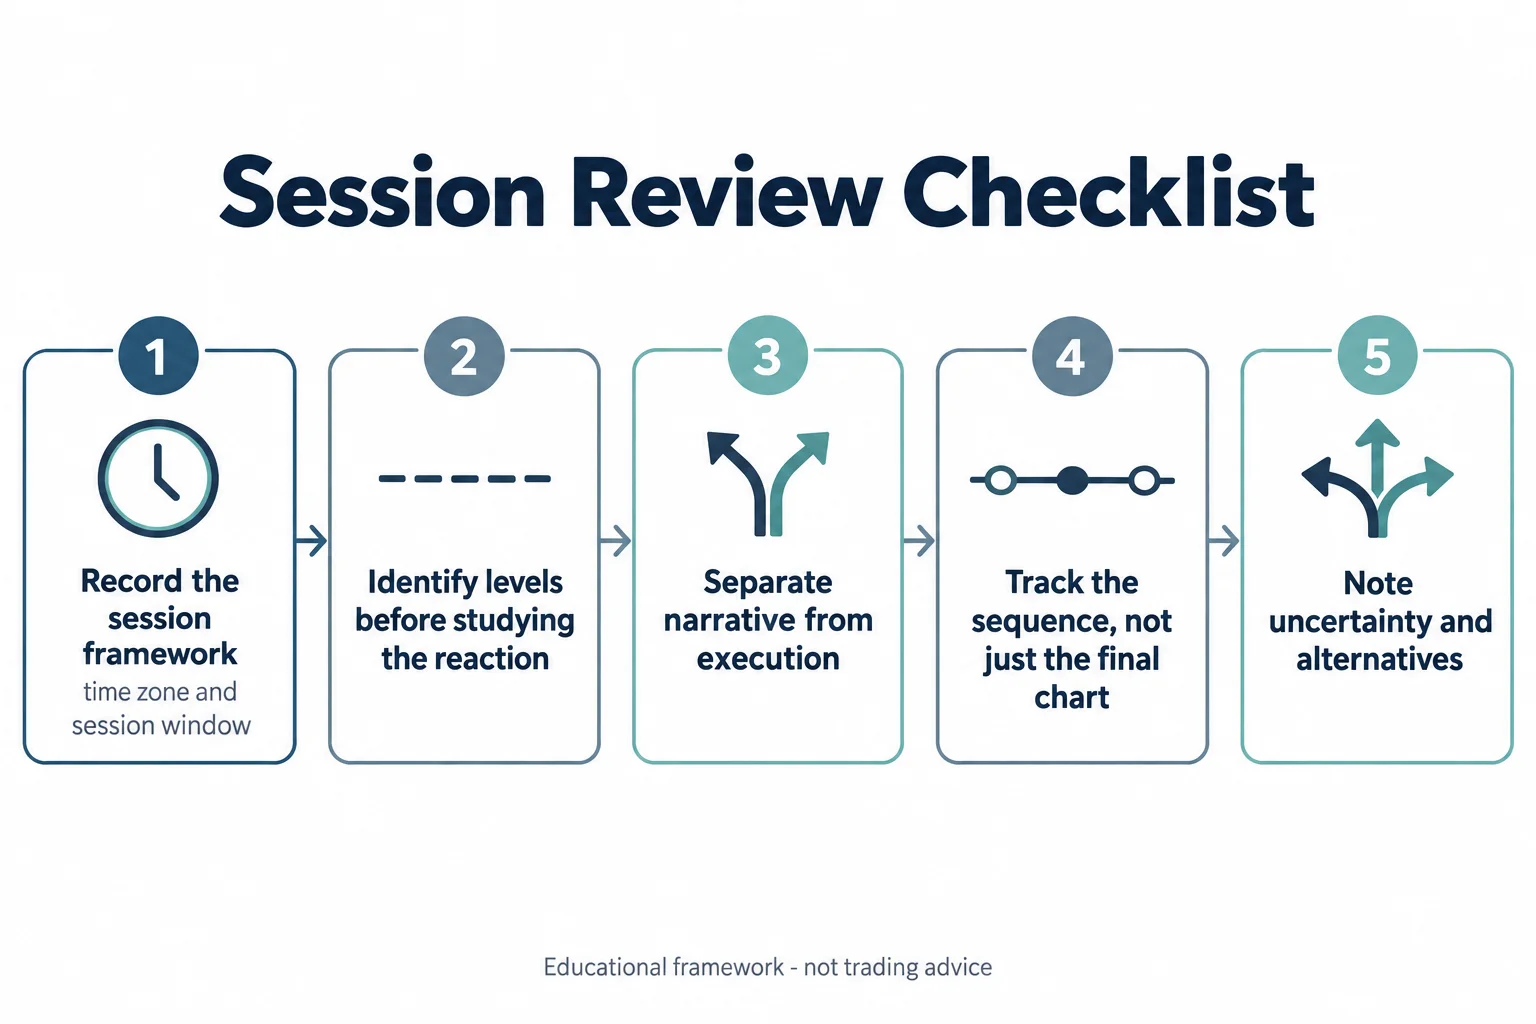
A review like this is a catalogue of the marks one trader kept and the sequence in which he says events unfolded. The spoken framework identifies: the five wick levels, the 7:00 a.m. to 9:30 a.m. window, the 9:30 candle taking relative equal lows and then the highs above, and the 9:50-to-10:10 macro. The parts not independently established from this transcript are the tool placements, the alignment he presents as a signature, and the account total. A practical way to work through it is to keep the session framework fixed, identify the levels before looking at the reaction, separate the narrative from any executable plan, follow the sequence rather than the final extreme, and write down what remains uncertain — the editorial study order shown in the schematic below, not a trading system promised by the speaker.
Watching the source recording
Watch the source recording on YouTube
Embedded playback was disabled by the video owner when checked. Use the link below to watch on YouTube, or the timestamp links above to revisit a specific passage.
Watch 2025 Lecture Series — ICT Gauntlet & NQ AM Session May 07, 2025 Review on YouTube ↗
Sources
- 2025 Lecture Series — ICT Gauntlet & NQ AM Session May 07, 2025 Review, The Inner Circle Trader (first-party recording; published 7 May 2025; runtime 1,648 seconds; watch-page metadata and player message read 13–14 September 2026). All timestamps in this article refer to this video.
- @I_Am_The_ICT on X, 1:59 p.m., 7 May 2025 — the publisher’s own announcement of this recording, read 13 September 2026. Used only to date the upload and confirm who published it.
- Federal Reserve Board: FOMC statement, 7 May 2025 (official policy statement, marked for release at 2:00 p.m. EDT; read 14 September 2026) — the same-day event risk the recording refers to.
- NYSE: Holidays & Trading Hours (official exchange page, read 14 September 2026) — cash-market context for the 9:30 a.m. ET opening bell, not NQ futures contract hours.


