
Key takeaways
In the September 22, 2025 Focus On Forex session, ICT reviews the U.S.
Read the full summary
In the September 22, 2025 Focus On Forex session, ICT reviews the U.S. Dollar Index, EUR/USD (“fiber”) and GBP/USD (“cable”) and lays out conditional expectations rather than a fixed forecast. On the dollar index he treats a pair of daily candles as a potential bullish inversion fair value gap and names the level that would cancel that reading: if price trades through the midpoint into the lower quadrant, he says the likelihood of bullishness “evaporates considerably” and a revisit of the prior low becomes possible. On EUR/USD he reads bodies respecting a daily inefficiency and a reclaim of a shaded imbalance; on cable he works through discount wicks, a London breakaway gap and a cluster of overlapping arrays around the September 11 reference. He states that he is not trading forex, has “no skin” in the outcome, and asks viewers to study the analysis rather than treat it as trade advice. This article is grounded in an automated transcription of the recording, not in human-verified captions or in any independent chart verification.
How we researched this article
BestProps used document-based research from primary firm sources, checked September 14, 2026. The complete source list, scope, limitations, and commercial-state record appear near the end of this article.
In Focus On Forex September 22, 2025, ICT reviews the US Dollar Index, EUR/USD—often called “fiber”—and GBP/USD, or “cable.” He interprets their price action through fair value gaps, volume imbalances, liquidity, quadrant levels and session timing. He opens by confirming the date as September 22, 2025 and names the three instruments he intends to cover (0:07).
This article summarizes the commentary in the recording. It does not independently validate the chart markings or imply that the scenarios subsequently occurred.
ICT’s Dollar Index framework
ICT begins with the Dollar Index daily chart at 0:26. He says price had returned to a previously discussed volume imbalance and briefly breached its outer high with a wick. He was watching two adjacent candles as a potential bullish inversion fair value gap.
His central condition was whether price could remain in the upper half of that area. In ICT’s framework, holding the upper quadrant—or at least avoiding sustained movement through the midpoint—would preserve the possibility of a move toward relative equal highs and a higher daily liquidity pool. He nevertheless emphasizes that the index remained inside a broad range and describes the intermediate-term low as a possibility rather than a confirmed fact.
At 1:59, he shifts to a five-minute chart. His explanation connects intraday reactions with the daily volume imbalance. He highlights several instances where price, in his reading, reacted near fair value gaps, candle wicks and the midpoint of an imbalance before moving toward sell-side liquidity.
Why ICT checks nonstandard time frames
A useful methodological point begins around 3:27. A gap that may appear oddly marked on a five-minute screenshot can represent one continuous structure on a ten-minute chart. ICT says he checks many intervals—not only common selections such as five or fifteen minutes—when price is compressed and the location of an inefficiency needs refinement. He also notes that an annotation shared on social media can look incorrect simply because the underlying structure was identified on a higher time frame than the chart being viewed (3:39).
His practical distinction is:
- In clustered or consolidating price action, compare several minute-based intervals to see how candles aggregate.
- In an extended, obvious price run, that degree of time-frame refinement may be unnecessary.
- Interpret an annotation in the context of the time frame on which the underlying structure was identified.
This is a chart-reading process presented by ICT, not evidence that one interval has predictive superiority over another.
The Dollar Index “line in the sand”
At approximately 5:09, ICT returns to the potential bullish inversion fair value gap. He says a response from its upper portion could support higher prices. Conversely, movement through the midpoint and into the lower quadrant would materially weaken his bullish interpretation and raise the prospect of revisiting a prior low. He calls that boundary the catalyst, or “line in the sand,” for the next leg.
ICT explicitly states that he was not trading forex and had “no skin” in the analysis. At 5:44, he asks viewers to treat the discussion as observation and study rather than trade advice.
EUR/USD: reclaiming an inefficiency
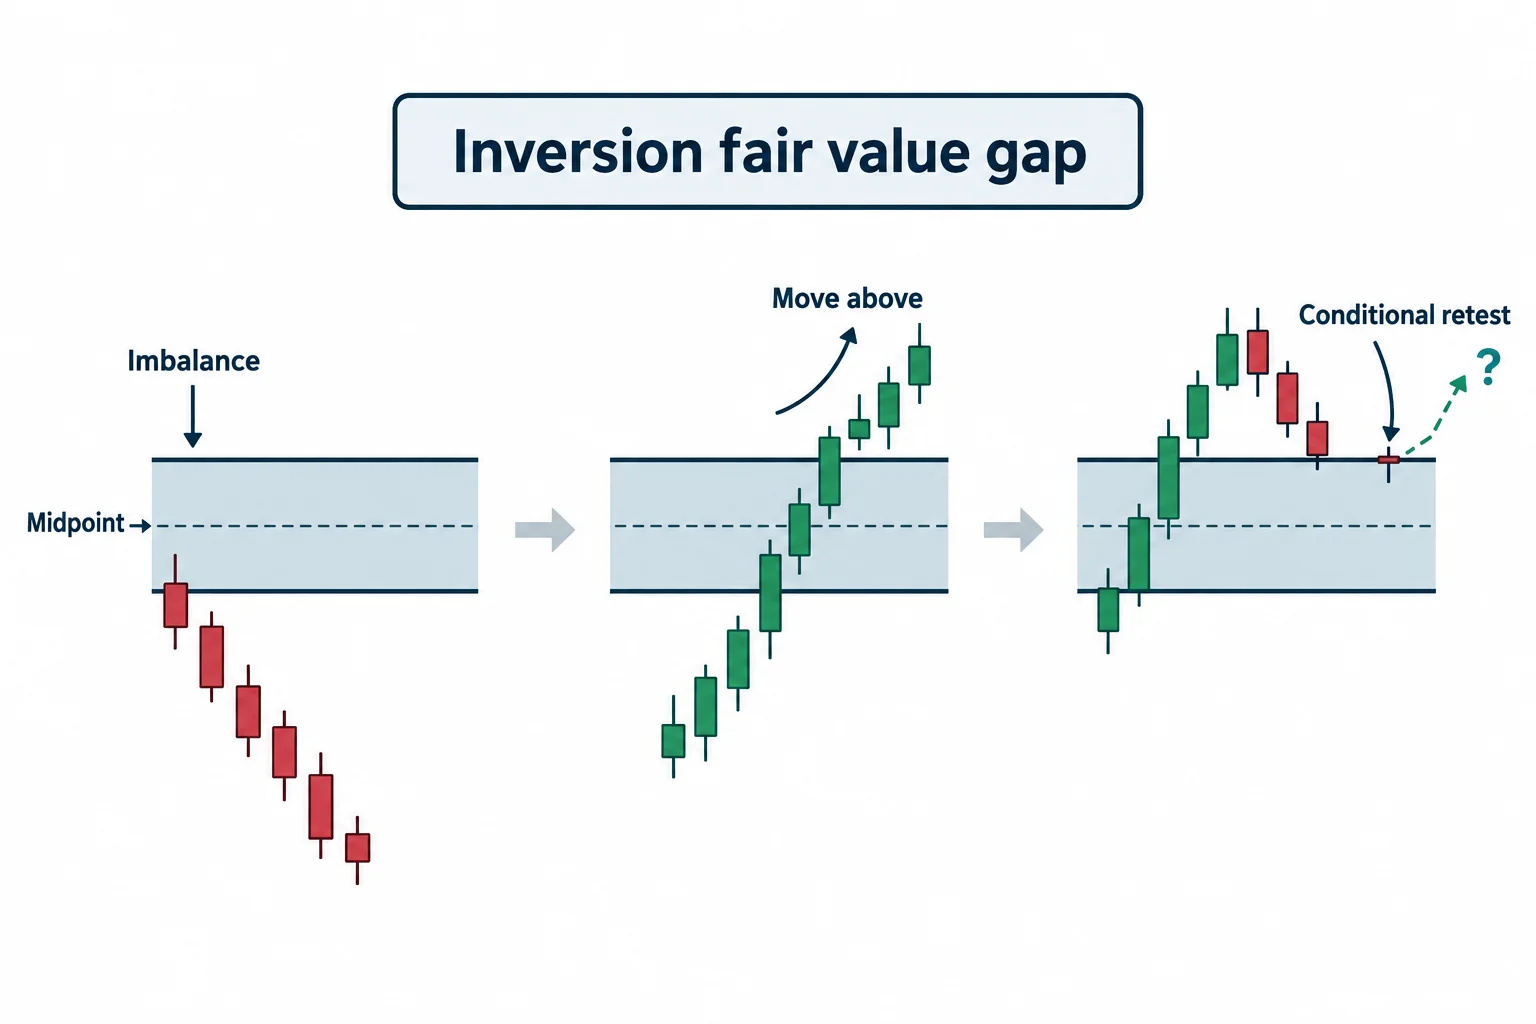
The EUR/USD review starts at 7:14. ICT says candle bodies respected a daily inefficiency while the wicks moved through it. After price traded below the preceding Friday’s low, he interprets the rebound through the midpoint of a yellow-shaded imbalance as bullish. A move fully above it followed by support on a retest would, in his terminology, turn the area into an inversion fair value gap.
He then identifies a cluster of overlapping concepts on the intraday chart:
- a London-session breakaway gap;
- bullish fair value gaps;
- an order block formed from consecutive down-close candles;
- a bullish breaker based on a low-high-lower-low sequence; and
- a daily fair value gap aligning with the intraday reaction.
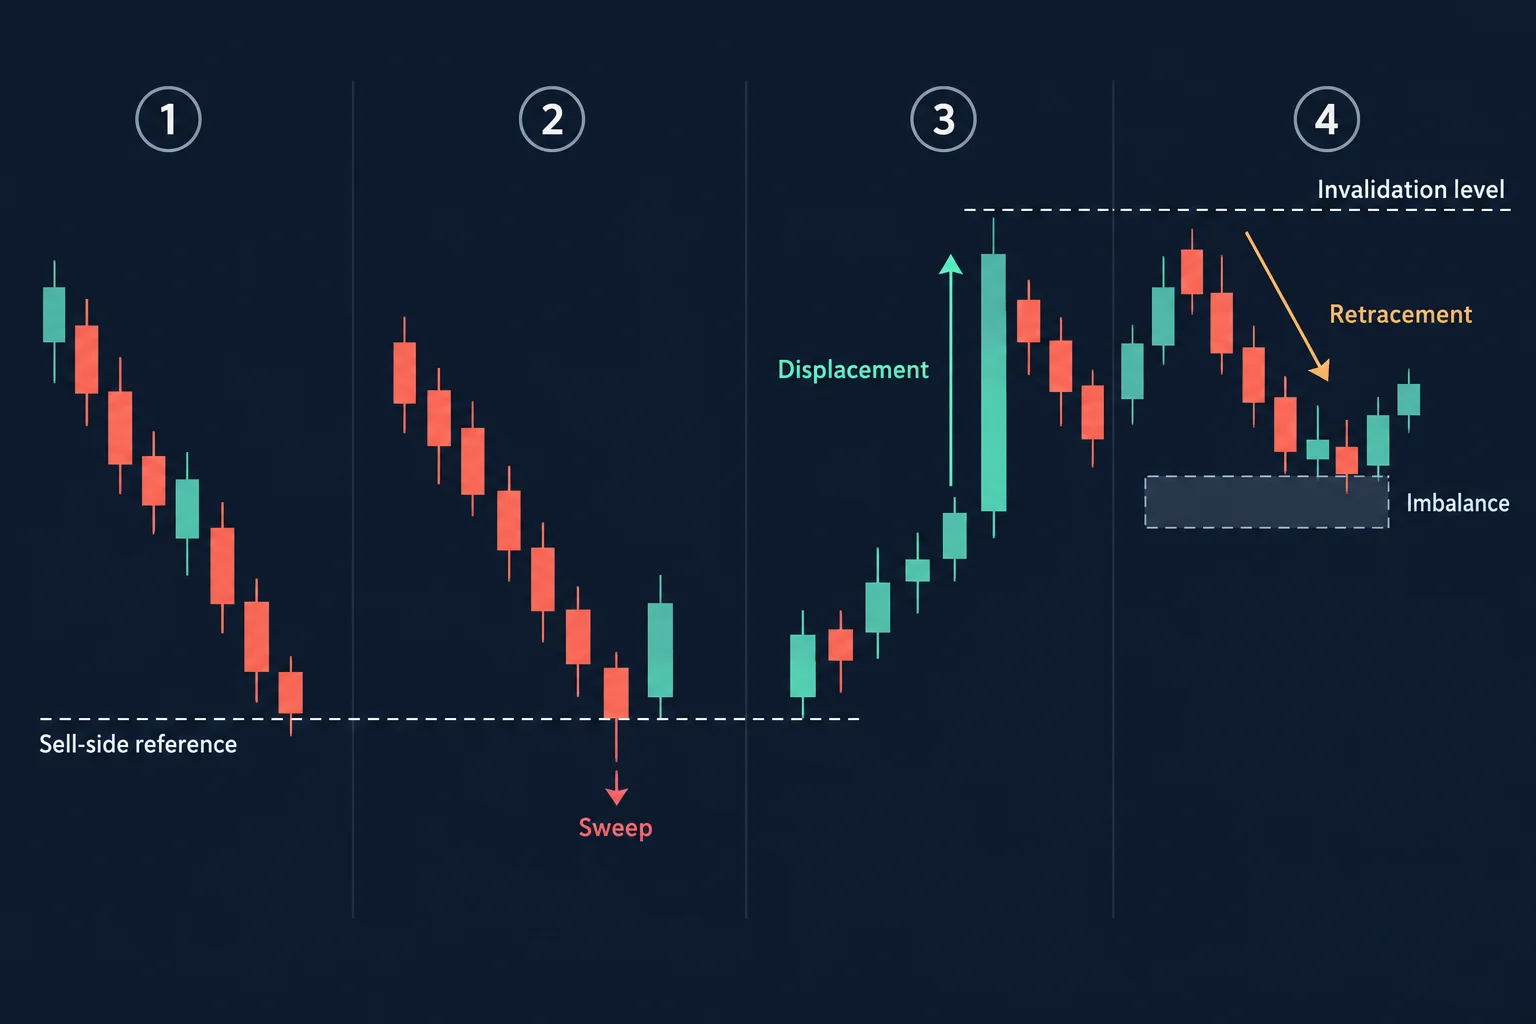
Around 9:37, ICT describes a decline through the New York open that cleared sell-side liquidity before price sprang higher from a fair value gap into what he calls a propulsion block. He defines that structure as an order block whose test retraces to the halfway point of the candle without closing below it. This is ICT’s own classification of the displayed structure; the transcript alone cannot verify the chart geometry.
GBP/USD: discount wicks and clustered arrays
ICT turns to GBP/USD at 10:34. He says the daily candle bodies were respecting the midpoint of a bullish fair value gap after the market moved below Friday’s low.
He expects price to be drawn back toward a referenced discount wick regardless of the eventual direction. The reaction within that wick supplies directional context in his model: a bullish market should be capable of reaching its upper quadrants, while a bearish market may encounter resistance in its lower half.
At 11:33, he again notes a London breakaway gap and describes confluence among a fair value gap, an order block and the midpoint of a higher-time-frame bullish fair value gap. ICT argues that a wick can extend beyond one marked boundary when price is reaching for another nearby structure that he considers more significant—what he describes as a confluence of arrays rather than randomness.
He also references repeated movement beneath the September 11 daily low as sweeps of sell-side liquidity (12:49), followed by accumulation around quadrant levels of the September 11 discount wick.
Session timing and the backdrop the recording mentions
Part of the dollar discussion is framed as a hypothetical path through named session windows rather than a record of what happened. Around 6:05, ICT sketches a sequence in which price might trade lower during the London kill zone at 5 a.m., consolidate and roll over slightly, then come back into focus at 7 a.m. in the New York kill zone—where a bearish fair value gap and a sweep of relative equal lows could precede a New York-session reversal. He presents this as one possibility to watch, not a prediction, and then describes the daily potential bullish inversion fair value gap that price was digging into.
Earlier, at 1:52, he says the news calendar would likely produce “knee-jerk reactionary” moves in the dollar index into the end of the year. Near the end of the recording he returns to the theme, pointing to wartime events and the possibility of future military actions that in his view would affect the dollar, and concludes that the situation is a “wait and see.”
For calendar context only: five days before this recording, the Federal Reserve’s FOMC statement of September 17, 2025 lowered the target range for the federal funds rate by 1/4 percentage point to 4 to 4-1/4 percent. The recording does not quote or reference that statement; the link is background for the policy backdrop the speaker alludes to, not part of his chart analysis.
Conditional conclusions rather than a fixed forecast
The final GBP/USD discussion at 13:47 is deliberately conditional. ICT says that if cable moved above the nearby high, reaching and holding through the midpoint of the active imbalance would support the bullish case. Failure before that midpoint, or a reaction from a lower quadrant followed by a rollover, would indicate weakness in his interpretation.
The common lesson across all three markets is to define invalidation conditions before adopting a narrative. ICT did not present a completed trade, verified fill or subsequent result. He instead offered levels and behaviors that would either preserve or weaken his working scenarios while the Dollar Index remained in consolidation.
General educational takeaway
Separate from ICT’s specific market outlook, the session illustrates a general analytical discipline: begin with higher-time-frame context, identify the exact boundary that would invalidate an idea, and then use lower-time-frame observations only to refine—not replace—that context. Because these concepts are interpretive and chart-dependent, viewers should compare the transcript with the original visuals and avoid treating retrospective annotations as proof of a repeatable trading edge.
Watch the original recording
This article draws on an automated transcription of the full recording. The transcript is the source for the speaker’s words and for the timestamps used above; it is not independent proof that the chart markings appeared as described. The recording’s visuals remain the primary reference when following the annotations.
Watch the original recording on YouTube
This video cannot be played inside another website: when its embedded player was opened from a BestProps page and clicked on 14 September 2026, the player itself reported “Playback on other websites has been disabled by the video owner.” and settled on a “Watch on YouTube” prompt, with no duration and no playback progress reported. That message is why no player is reserved or left blank here; the recording is available directly on YouTube.
Primary source and further reading
- Focus On Forex September 22, 2025 (The Inner Circle Trader) — the primary source for this article; every timestamp link above points into this recording.
- Federal Reserve FOMC statement, September 17, 2025 — the official policy backdrop five days before the recording, provided for calendar context only.
- ICE US Dollar Index futures — exchange reference for the index contract underlying the dollar-index discussion.
- BIS Triennial Central Bank Survey (2025) — general context on global foreign-exchange turnover; unrelated to the specific levels discussed in this session.
Editor’s note: this page reviews one speaker’s stated framework for a completed session. It reproduces his conditions and caveats, not a verified trade record, and it is not investment advice. Chart markings, level labels and any quoted figure come from the recording and its automated transcription; the underlying visuals were not independently inspected.

