
Key takeaways
ICT’s 2025 Lecture Series NQ Heavy Manipulation Review analyzes the June 2025 Nasdaq futures contract on April 23, 2025 using daily wick consequent encroachment at the wick midpoint, a daily volume imbalance, an opening gap, five-minute reversals and one-minute fair value gap references.
Read the full summary
ICT’s 2025 Lecture Series NQ Heavy Manipulation Review analyzes the June 2025 Nasdaq futures contract on April 23, 2025 using daily wick consequent encroachment at the wick midpoint, a daily volume imbalance, an opening gap, five-minute reversals and one-minute fair value gap references. ICT says PD arrays may remain valid after multiple touches and relates them to 20-, 40- and 60-day lookbacks. His bearish model requires directional bias and a break lower before a retracement into references including a bearish order block, SIBI, inversion fair value gap and premium wick midpoint. He reports shorting four contracts at 19,108 in a turtle soup false-breakout setup, tightening the stop above a nearby high and being stopped out, while the described partial exits were only a plan and no fills, net profit or loss are independently verified. He characterizes the erratic two-sided action as manual intervention, but the transcript does not prove that cause. The practical lessons are to avoid forcing trades in noisy conditions, control leverage, use an actual stop-loss order, accept that stopped-out ideas may later reach their targets, journal the level crossed and reversal conditions, and specialize in a limited model rather than applying every concept to every trade.
How we researched this article
BestProps used document-based research from primary firm sources, checked September 24, 2026. The complete source list, scope, limitations, and commercial-state record appear near the end of this article.
This review is grounded in automatic transcription of the full original audio, not YouTube captions or independent chart inspection. At 0:42 he explicitly dates the review Wednesday, April 23, 2025; at 4:39 he names the June 2025 Nasdaq delivery contract. No contract specifications, fills, exact chart coordinates or net profit have been independently established here.[1]
In “2025 Lecture Series – NQ Heavy Manipulation Review”, uploaded April 23, 2025 at 19:43 Pacific time (April 24 in UTC), ICT reviews Nasdaq futures price action associated with the Wednesday, April 23 session. The lesson moves from daily-chart reference areas to five-minute and one-minute examples, then closes with risk management, journaling and trader psychology.[1]
The word “manipulation” reflects ICT’s interpretation of the session. The transcript does not independently establish who caused the price movements, and the source does not permit verification of the chart’s exact candles, annotations or executions.[1]
ICT 2025 Daily Chart Reference Points
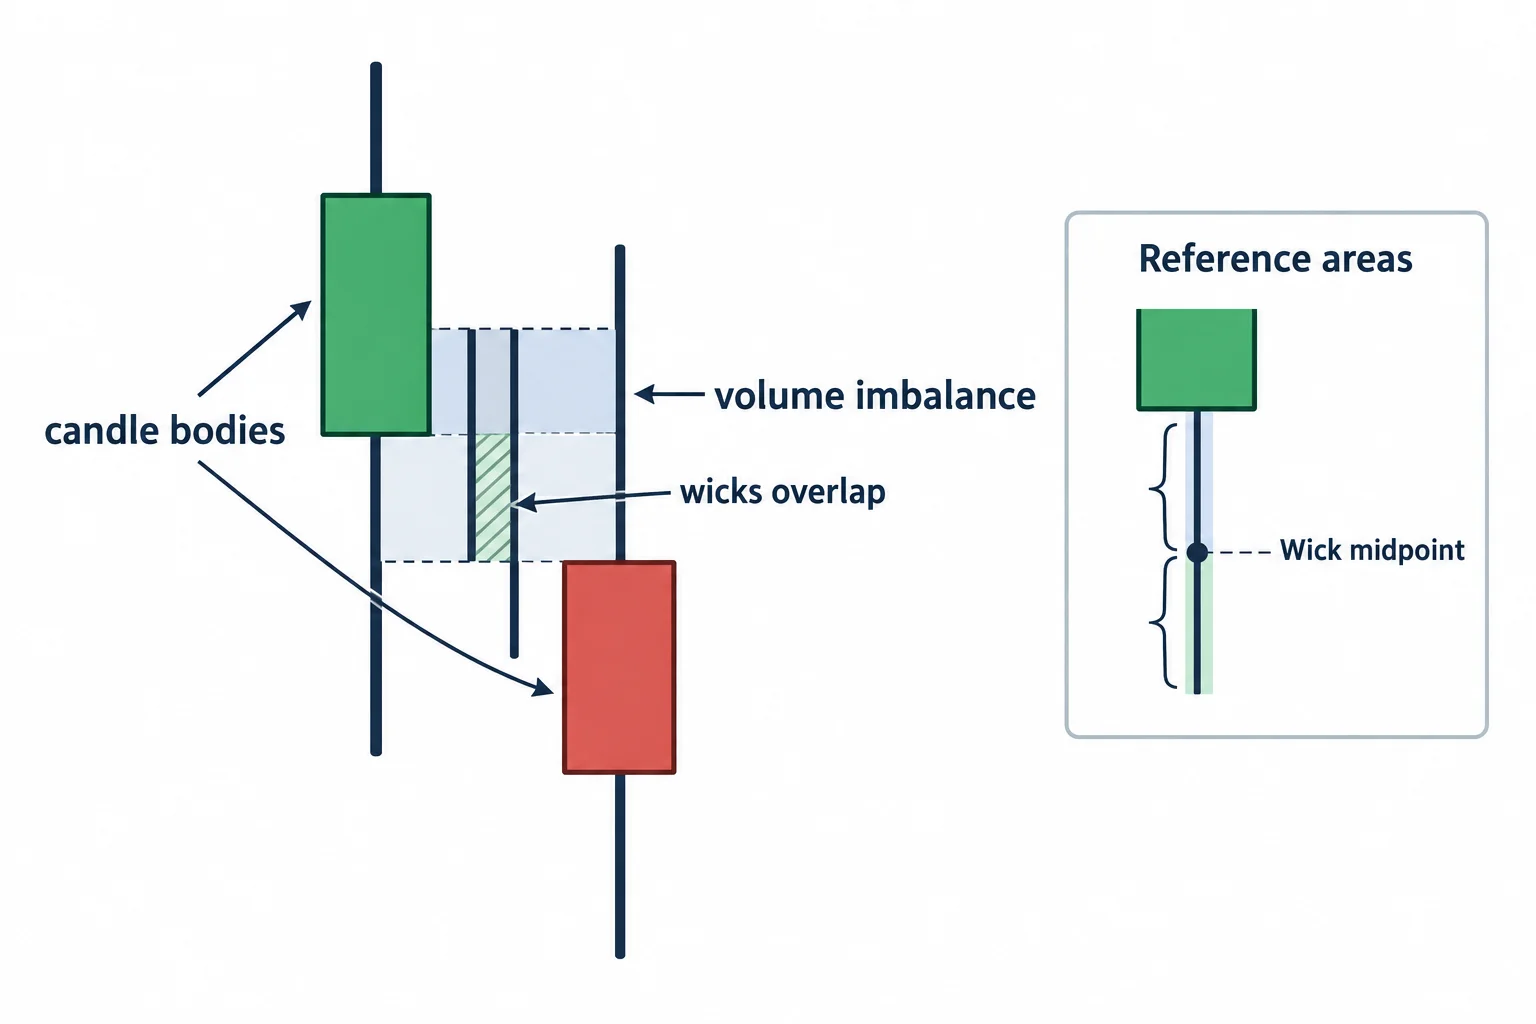
ICT begins with two higher-time-frame areas on the June 2025 Nasdaq contract. At 0:52, he identifies what he calls a premium wick’s consequent encroachment and a daily volume imbalance.[1]
For the wick he measures in this example, consequent encroachment is its midpoint. He measures from that candle’s open to its low and says he treats wicks as gaps. He then projects that midpoint forward as a potential area of interest. His volume-imbalance discussion focuses on a space between the referenced candle bodies where wicks overlap but bodies have not occupied the area.[1]
ICT presents these features as “PD arrays,” or reference areas used within his methodology. He stresses that an area can be revisited more than once rather than becoming invalid automatically after one touch. At 3:42, he also connects their relevance to 20-, 40- and 60-day lookback ranges, while saying that older arrays require more experience to interpret.[1]
ICT 2025 Opening Gap and Intraday Conditions
The reviewed session opened with a large gap from the previous settlement. Although ICT says such an opening can support continuation toward the gap’s direction, he was not immediately interested in a long position. He instead wanted to see price move into a discount first, with the daily wick midpoint and nearby highs serving as possible upside references if bullish movement continued. He explicitly avoids guaranteeing that those higher areas would be reached.[1]
On the five-minute chart, ICT says price eventually moved through the daily wick midpoint, reversed toward the daily volume imbalance and entered a range-bound phase. The repeated back-and-forth wicks are central to his review. At 8:12, he contrasts that behavior with what he considers a clean directional run containing visible inefficiencies.[1]
ICT interprets the erratic movement as evidence of “manual intervention.” That is his market explanation, not something demonstrated by the transcript alone. His practical instruction is narrower than that causal claim: he considered the overlapping, two-sided movement unusually difficult and told his audience to stop watching for a time rather than force a trade.[1]
ICT 2025 False Breakout and Lower Time Frame Model
The one-minute discussion begins around 10:16. ICT tracks a fair value gap identified earlier in the session and describes repeated rallies, reversals and returns into that area. Automated transcription renders one recurring term as “first percent” or “first presented” fair value gap; the intended label is unclear without checking the original audio and chart.[1]
Later, ICT outlines a bearish combination consisting of:[1]
- a bearish order block;
- an imbalance he calls “SIBI,” without a reliable full expansion in this transcript;
- an inversion fair value gap;
- a premium wick consequent-encroachment level; and
- a directional bias established before applying those references.
At 11:57, he describes the bearish order block with a SIBI as an entry drill. He then discusses a break lower and subsequent inversion-gap and wick references. His explanation is conditional: a bearish bias and break lower come first, after which a retracement into the identified inefficiency supplies the area he watches for continuation.[1]
ICT then describes shorting four contracts at 19,108 during what he calls a “turtle soup” setup, a false breakout after stops above a prior high were taken. He says he subsequently tightened his stop above a nearby high and was stopped out. The transcript contains approximate dollar figures, but their precise meaning is unclear without the unseen account display, so they should not be interpreted as a verified profit or loss.[1]
At 12:54 he reports the short. His partial-exit sequence at 13:20 is a plan he says he would have followed, not a list of confirmed fills. At 13:56 he describes the outcome as fortunate after moving the stop, then says at 14:20 that he regards it as a loss in his own assessment. That is not a reconciled account result; no net return is calculated here.[1]
ICT 2025 Lecture Risk Management Lessons
The most broadly applicable portion begins around 15:42. ICT acknowledges that his read could fail and says difficult conditions require controlled leverage and an actual stop-loss order rather than a mental stop. He also warns that a stopped-out idea may later move toward the original target, which he says can provoke frustration and an emotional response.[1]
As general education, this episode illustrates a useful separation between analysis and execution. A trader can identify a plausible destination yet still have poor timing, encounter noise or invalidate the immediate setup. Predetermined risk and acceptance of invalidation matter independently of whether the later market path resembles the initial forecast.[1]
ICT 2025 Afternoon Reference Areas
From 17:49, ICT extends the morning gap and daily volume-imbalance references, describing later returns and an inversion role. At 19:05, he refers to the 2:50–3:10 macro and an afternoon opening-range gap identified within 1:30–2:00. These are the clock windows he names, not an independently verified chart timezone or universal timing rule. The repeated gap label remains recognition-sensitive.[1]
ICT 2025 Journaling and Model Selection
In the closing section at 20:33, ICT discusses study notes and electronic journaling. He says students should not try to apply every concept in every trade. Instead, they should identify a limited model compatible with their decision-making style, including how quickly they change bias and how they tend to undermine their own plans.[1]
This makes the video more than a catalog of chart labels. ICT’s stated lesson is that technical concepts cannot compensate for reckless sizing, inconsistent execution or unmanaged emotions. That interpretation is educational rather than evidence that any particular PD array or trading model is profitable.[1]
Source: ICT, “2025 Lecture Series – NQ Heavy Manipulation Review”. This commentary is for education only and is not investment advice.[1]
ICT 2025 Manipulation Claims and Known Facts
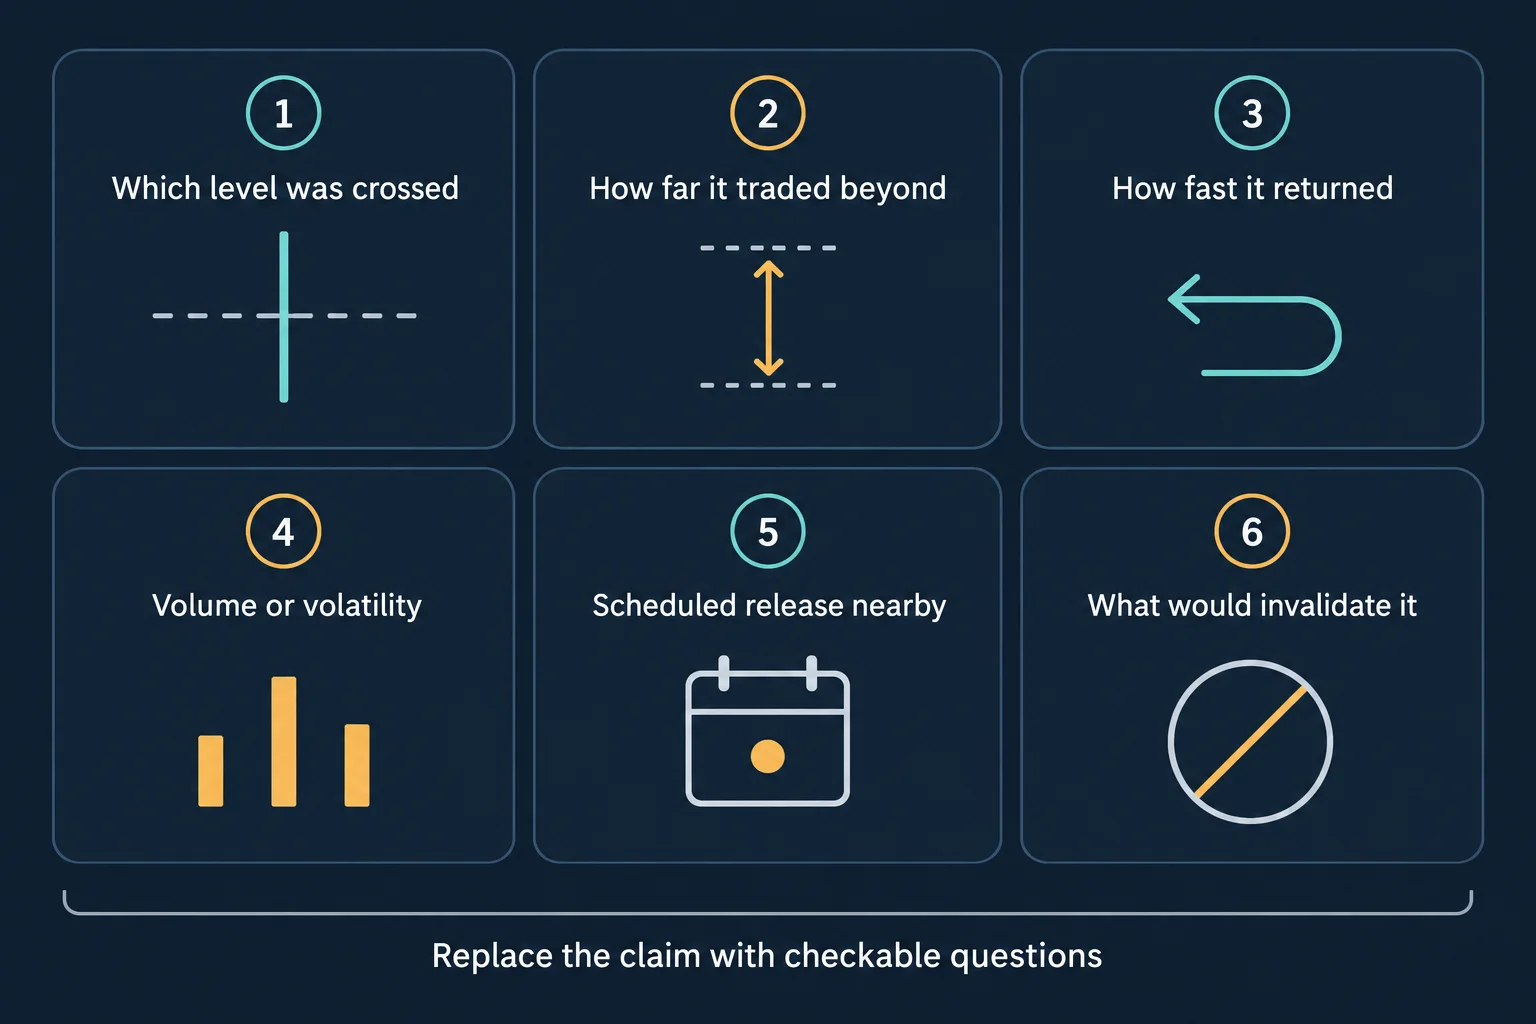
The illustrations are general study tools, not reconstructions of this session. A recorded observation, an analytical label and an explanation of cause require different evidence; a claim of deliberate intent is narrower still. For a reversal being studied, record the level crossed, distance beyond it, whether and how quickly it returned, volume or volatility context, nearby scheduled releases, and the condition that would invalidate your reading. These are questions for your own review, not findings established by the transcript.
Watch the Original ICT 2025 Lecture
2025 Lecture Series – NQ Heavy Manipulation Review
The saved clicked-player test reported that the owner disabled playback on other websites. The original lesson is linked directly instead.
Watch the original lesson on YouTube ↗ICT 2025 Lecture References for Further Study
The government-hosted 17 CFR Part 180 sets out prohibitions on manipulative and deceptive devices and price manipulation. It is legal context, not an enforcement finding about this session. This article does not determine whether any person violated a rule.[3]
The Federal Reserve’s FOMC calendar links meeting dates, statements and minutes. Use it for scheduled-policy context, not as proof that an FOMC event caused the moves described here; it is not a comprehensive economic-release or tariff-news calendar.[4]
Nasdaq’s Nasdaq-100 overview describes the index and its constituents. It is index background, not a futures contract-specification sheet or validation of the lecture’s market claims.[5]
ICT 2025 Lecture Sources
- [1] https://www.youtube.com/watch?v=28M9ouiKmSY, YouTube: 2025 Lecture Series – NQ Heavy Manipulation Review – The Inner Circle Trader (mapped first-party recording)
- [3] https://www.ecfr.gov/current/title-17/chapter-I/part-180, eCFR: 17 CFR Part 180 – Prohibition Against Manipulation (official rule text)
- [4] https://www.federalreserve.gov/monetarypolicy/fomccalendars.htm, Federal Reserve: FOMC meeting calendars and information (official schedule of regularly scheduled meetings)
- [5] https://www.nasdaq.com/solutions/nasdaq-100, Nasdaq: Nasdaq-100 Index overview (official index description; the index the NQ futures contract tracks)

