
Key takeaways
ICT’s YouTube review of the April 28, 2025 NQ one-minute chart interprets a post-open move above a premarket high as minor buy-side liquidity followed by a decline toward a prior low, with ICT narrating a market-order example that moved roughly 36 handles but providing no independently verified fill or performance.
Read the full summary
ICT’s YouTube review of the April 28, 2025 NQ one-minute chart interprets a post-open move above a premarket high as minor buy-side liquidity followed by a decline toward a prior low, with ICT narrating a market-order example that moved roughly 36 handles but providing no independently verified fill or performance. The demo-only assignment sought two 30-handle morning runs and two 20-handle afternoon runs across the week, not in one day. ICT combines the April 27 New Week Opening Gap, its midpoint and quadrants, a negative 0.5 Fibonacci projection, old highs, bearish fair value gaps, inversion fair value gaps and prior Friday’s opening-range gap with the nine fifty to ten ten a.m., ten fifty to eleven ten a.m. and three fifteen to three forty-five p.m. Eastern macros. He defines the equities afternoon opening range as one thirty to two p.m., cites unverified transcript levels near 19,380 and 19,460, and says the rally crossed the New Week Opening Gap high before consolidating after the four p.m. settlement. Gaps may remain relevant within 20-, 40- or 60-day lookbacks. The study assignment is to mark relative equal lows and sell-side liquidity from premarket, London and Asian sessions before viewing his answer chart, while recording source dates, pre-open information, observations versus interpretations, timestamped developments and invalidation conditions. The article stresses that algorithmic delivery claims, chart annotations, executions and predictive value are ICT’s interpretations and do not establish verified returns or a repeatable edge.
How we researched this article
BestProps used document-based research from primary firm sources, checked September 24, 2026. The complete source list, scope, limitations, and commercial-state record appear near the end of this article.
The video title dates this review to April 28, 2025. In “2025 Lecture Series – NQ April 28, 2025 Review”, ICT gives a concise walkthrough of a one-minute Nasdaq E-mini futures chart. His central argument is that the session can be interpreted through liquidity targets, opening gaps, fair value gaps and specific intraday time windows.[1]
This review summarizes what ICT says in the recording. It does not independently validate the chart annotations, executions or his broader claims about algorithmic price delivery. Because the transcript was generated by automatic speech recognition and the chart itself was not independently inspected, some terminology and quoted levels should be checked against the original video.[1]
ICT April 2025 Morning Liquidity Setup
ICT begins on the one-minute chart by describing a decline, a rally that established a short-term high, and a subsequent move through an earlier low. At 2:14, he identifies two chart lines as a volume imbalance. He treats the short-term high formed before the 9:30 a.m. opening as minor buy-side liquidity. In his account, price moved above that high after the open and then turned lower.[1]
He says his intended downside objective was an earlier low and discusses an execution aimed toward it. ICT also refers to a paper-trading exercise he had assigned to followers: look for two 30-handle morning runs and two 20-handle afternoon runs during the week. He explicitly frames this as demo-account practice rather than an instruction to force all of those moves into one day.[1]
At 4:05, ICT describes entering with a market order while targeting the prior low. He reports a move of roughly 36 handles within the scope of that exercise. The transcript alone cannot establish the fill, exact chart coordinates or result, so this should be understood as ICT’s own narration of the example.[1]
ICT April 2025 Opening Gap Projection
The next part of the lesson introduces the New Week Opening Gap, dated April 27, 2025 in the narration, along with its quadrant and midpoint-related levels. Beginning around 5:36, ICT draws a Fibonacci measurement from an opening-range low to its high and plots a negative 0.5 level. He says that projection aligned with the session high.[1]
This is presented as an ICT framework, not as an independently proven forecasting rule. The practical educational point is to note how he combines a defined opening range with a projected level, rather than treating a Fibonacci measurement as a standalone signal.[1]
ICT April 2025 Fair Value Gaps and Macros
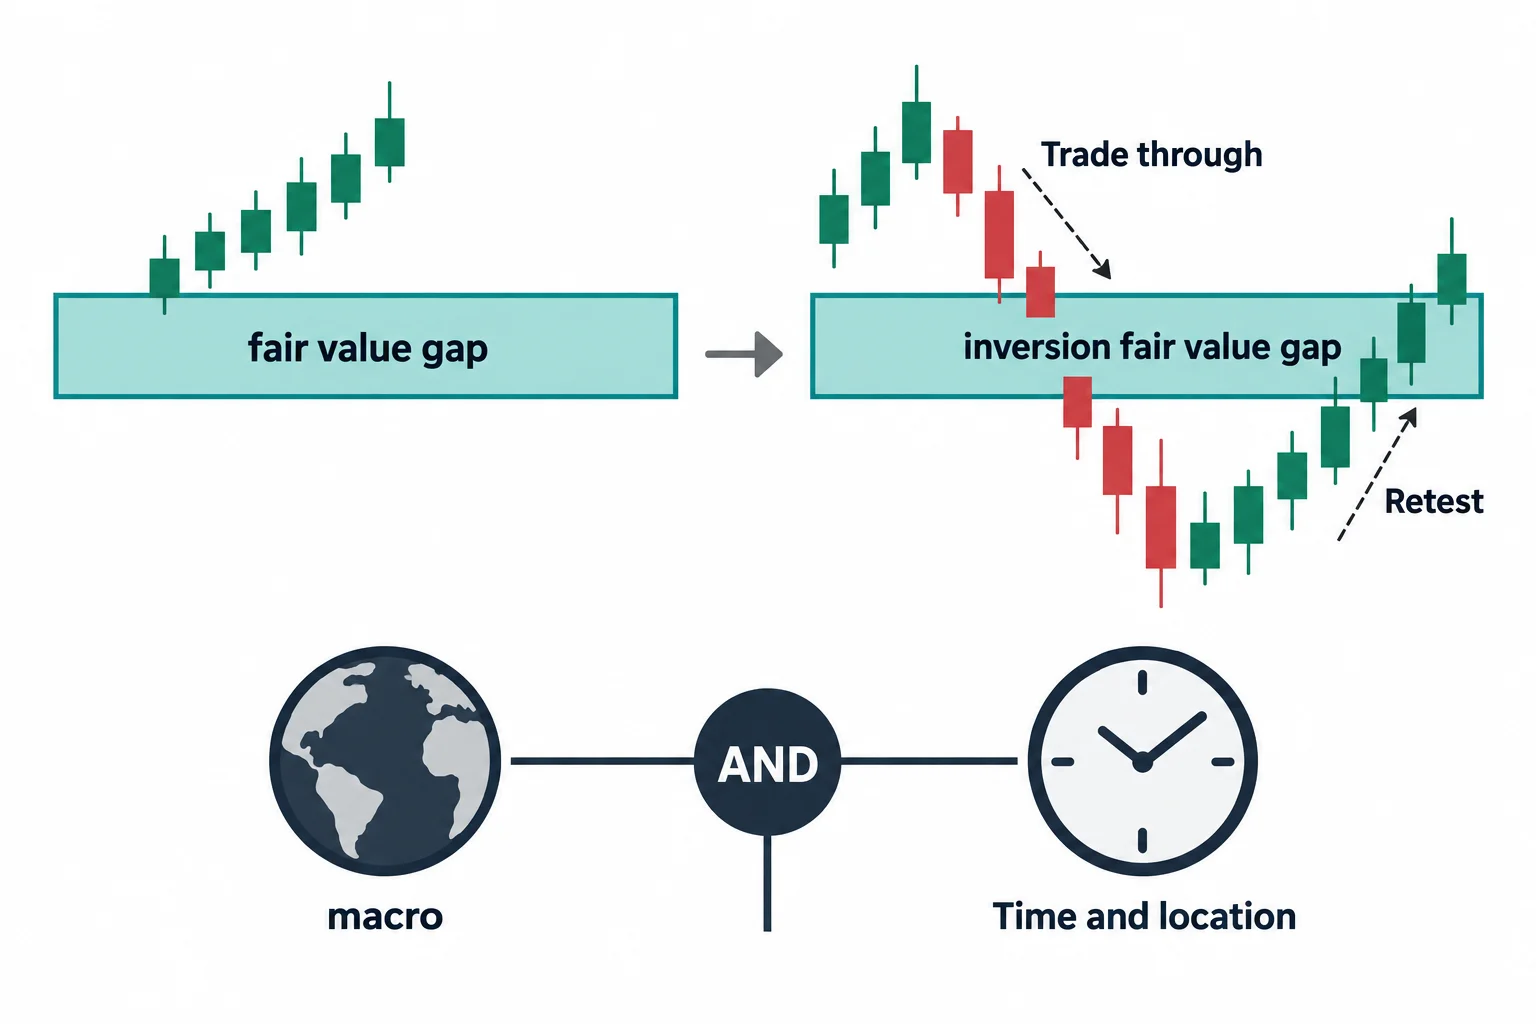
ICT then tracks the decline through several concepts from his terminology:[1]
- An old high serving as liquidity within a premium area.
- A fair value gap that changes function after price trades through it, described as an inversion fair value gap.
- A bearish fair value gap, also called a sell-side imbalance/buy-side inefficiency in the narration.
- The New Week Opening Gap and its consequent encroachment, meaning its midpoint.
At 7:27, he associates a downside delivery with the 9:50–10:10 a.m. “macro.” Later, at 8:19, he says another decline waited for the 10:50–11:10 macro. In ICT’s interpretation, the timing windows help determine when a mapped liquidity objective is more likely to be approached; the level and the time window are meant to be considered together.[1]
Why the ICT April Opening Gap Still Mattered
ICT says the decline moved from the New Week Opening Gap toward the prior Friday’s opening-range gap. Around 8:49, he characterizes old gaps as areas to which the market can return to address an inefficiency.[1]
He emphasizes that a gap is not automatically discarded after one interaction. Instead, he says traders using his framework can carry such a “PD array” forward while limiting the historical search with 20-, 40- or 60-day data ranges. He then narrates several reactions around the older gap’s high, low and midpoint before price rallies.[1]
ICT April 2025 Afternoon Range and Bullish Inversion
The afternoon discussion starts at approximately 11:28. ICT defines the equities afternoon opening range as 1:30–2:00 p.m. and advises focusing on an obvious displacement and fair value gap rather than tiny spaces between candles.[1]
He then revisits bearish fair value gaps that, in his reading, later acted as bullish inversion fair value gaps. He mentions approximate areas near 19,380 and 19,460, but those values come from automated transcription and cannot be visually confirmed here. ICT says the afternoon rally accelerated during his 3:15–3:45 p.m. Eastern macro, moved through the New Week Opening Gap’s high, and then returned to consolidation after the 4:00 settlement.[1]
ICT April 2025 NQ Chart Study
ICT closes with a practical review assignment at 14:13. Viewers are asked to mark sell-side liquidity from three periods: premarket before 9:30, the London session and the Asian session around the start of the new week. He says each contained relative equal lows and encourages viewers to attempt the analysis before consulting his answer chart.[1]
As a general study method, this exercise can be separated from any claim of predictive advantage: annotate session highs and lows, record the gap or imbalance used in the hypothesis, identify the relevant time window, and then review whether the proposed sequence appeared without changing the rules after the fact. Historical chart interpretation remains educational and does not ensure future trading results.[1]
ICT April 2025 NQ Reconstruction Checklist
The five-step schematic is an editorial study aid, with its instructions repeated below for small screens:
- Record the source and date: title, publication date and chart date. Here, distinguish the April 28 title from the April 27 weekly opening gap.
- Mark pre-open information: preserve levels already known before the specified session open.
- Separate observation from interpretation: record facts separately from analytical labels.
- Build a timestamped sequence: note when each level and observation became available.
- Define invalidation before targets: document what would contradict the thesis without retrofitting it to the outcome.
Open the full-size checklist graphic.
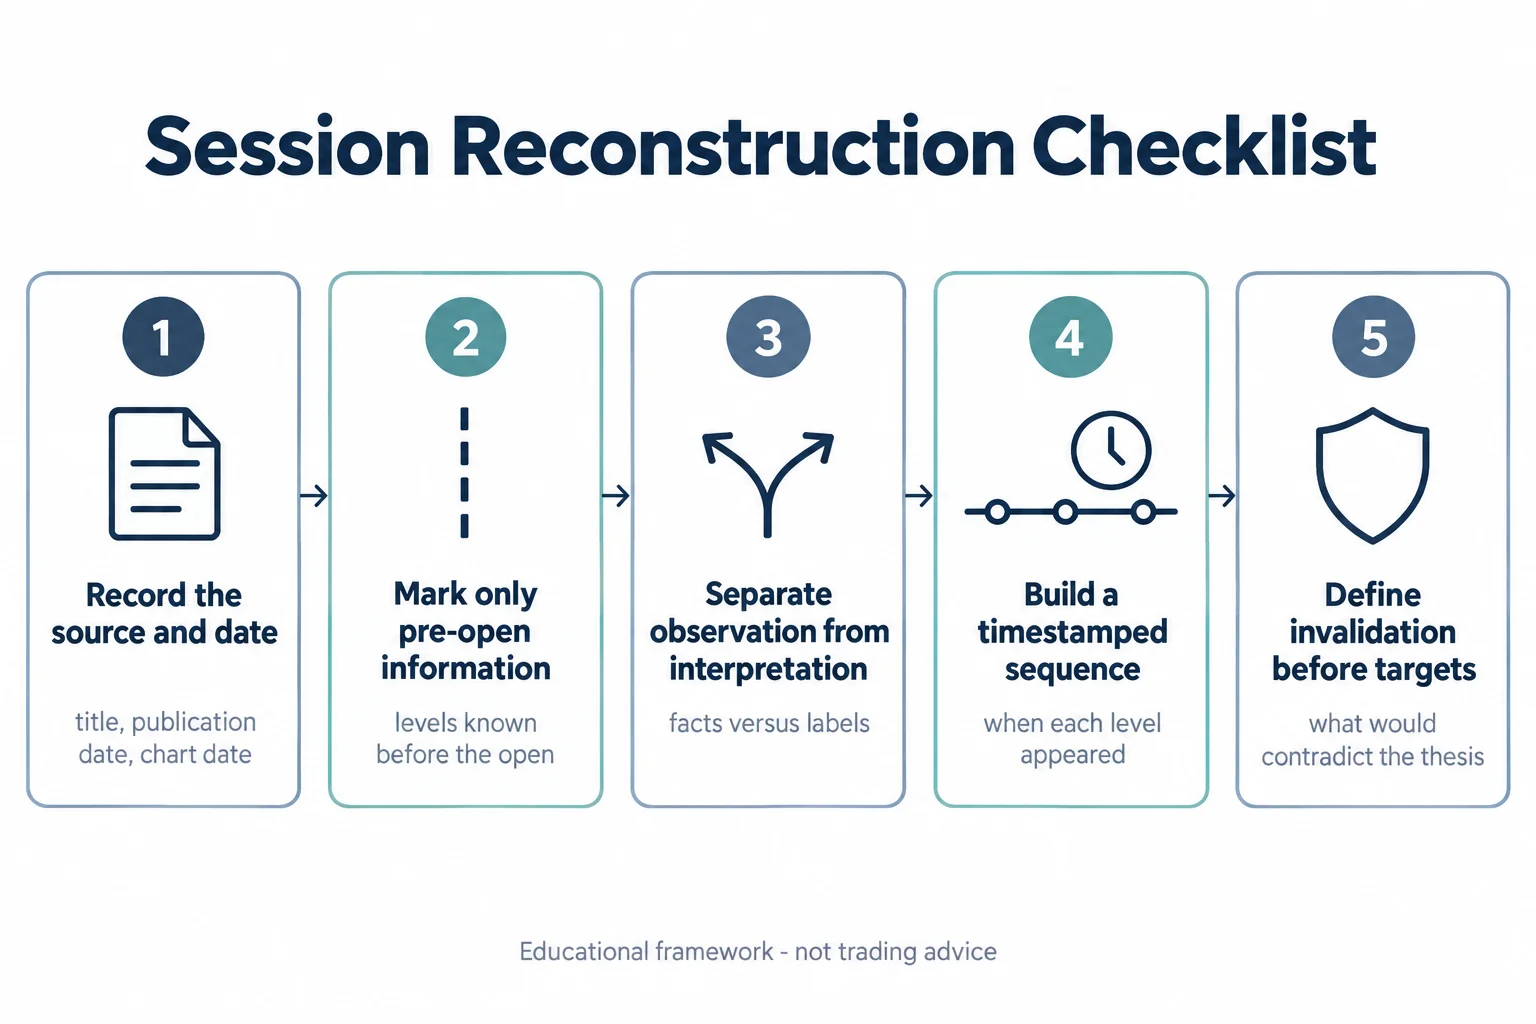
A pre-open baseline does not mean ignoring later information. Add intraday observations at the time they became available, and distinguish when a level formed from when someone identified or published it. The featured timeline’s “Added after the fact” category concerns retrospective annotations, not every legitimate observation after the open. Do not invent an invalidation rule after seeing the outcome; a thesis condition is not a guaranteed stop-loss fill.
Watch the ICT April 2025 NQ Review
2025 Lecture Series – NQ April 28, 2025 Review
The tested embedded player reported that the owner disabled playback on other websites. Use the direct watch link rather than an empty embedded player.[1]
Related ICT April 2025 Lecture Resources
ICT’s separate May 18 post concerns a 9:30 a.m. first-presented fair value gap. It is related study material, not evidence for what happened in this April 28 review.[2]
The CFTC’s Learn & Protect page provides general risk and fraud education and warns that no trade or investment is risk-free. It does not endorse this lesson or validate a trading method.[3]
The TradingView FVG Detector page by newhand17 describes its own three-candle gap-identification logic. This is an unofficial third-party script, not an ICT-authored tool. It has not been installed, tested or assessed for repainting or performance for this article; its listing does not establish that it reproduces the lesson’s discretionary analysis.[4]
Risk note: Educational commentary, not investment advice. Narrated trades and chart interpretations do not establish verified fills, net returns or a repeatable edge.


