
Key takeaways
ICT’s roughly six-minute NQ Futures Review from 2 May 2023 presents an unverified Nasdaq short based on a draw toward lower liquidity after price ran relative equal highs and left a gap.
Read the full summary
ICT’s roughly six-minute NQ Futures Review from 2 May 2023 presents an unverified Nasdaq short based on a draw toward lower liquidity after price ran relative equal highs and left a gap. The target was the nearby low and the first hourly imbalance beneath sell-side liquidity, with equilibrium of the low-to-high range supporting an objective below it. Execution used the ICT Silver Bullet window between 10 and 11 o’clock, a high-impact 10 o’clock news release, a one-minute entry inside a five-minute order block, and a fair value gap, while ES weakness provided cross-market confirmation through the Sick Sister approach. ICT reports an approximate entry at 13,281.5, an initial five-handle ES equivalent or roughly 20 NQ handles, a rounded one-to-four ES-to-NQ comparison, and about 80 NQ handles or 40 ES handles for the day. He says the second entry was imperfect, used an hourly imbalance as the destination, and involved five contracts after correcting an initial reference to five handles. The auto-generated captions do not verify symbols, fills, exits, account results, risk, commissions, slippage, or exact position size, so the figures are speaker-reported educational commentary rather than evidence of repeatable performance or investment advice.
How we researched this article
BestProps used document-based research from primary firm sources, checked September 24, 2026. The complete source list, scope, limitations, and commercial-state record appear near the end of this article.
The clip is short and informal (he introduces it as a quick walk-through of an intraday swing model rather than a full lesson (0:46)), and he says the more detailed treatment of the Sick Sister approach belongs in a dedicated lesson on the channel (3:05 and 3:07). The transcript used for this article is the video’s own English caption track, which is auto-generated, so several terms and numbers are mis-recognised; the sections below say which ones, and nothing is reported as independently observed chart detail.
ICT Futures Bias and Downside Target
He opens with the draw on liquidity, saying the read at the time favoured lower prices (0:22 and 0:28). He mentions showing a five-handle run on ES and roughly twenty handles on the Nasdaq on his Twitter feed, then says he switched to an intraday swing model (0:31, 0:43 and 0:46).
The chart description that follows is the foundation of the rest of the clip. He says price had traded above relative equal highs and left a gap, and he characterises the whole area as buy-side imbalance outside of efficiency (0:52, 0:55 and 0:58). His practical conclusion is that even if price does not travel all the way through that area, it is likely to trade into the nearby low and range, so he wants to stay nimble and work a very tight range rather than a wide target (1:04 and 1:09).
ICT Futures Context Before the Entry
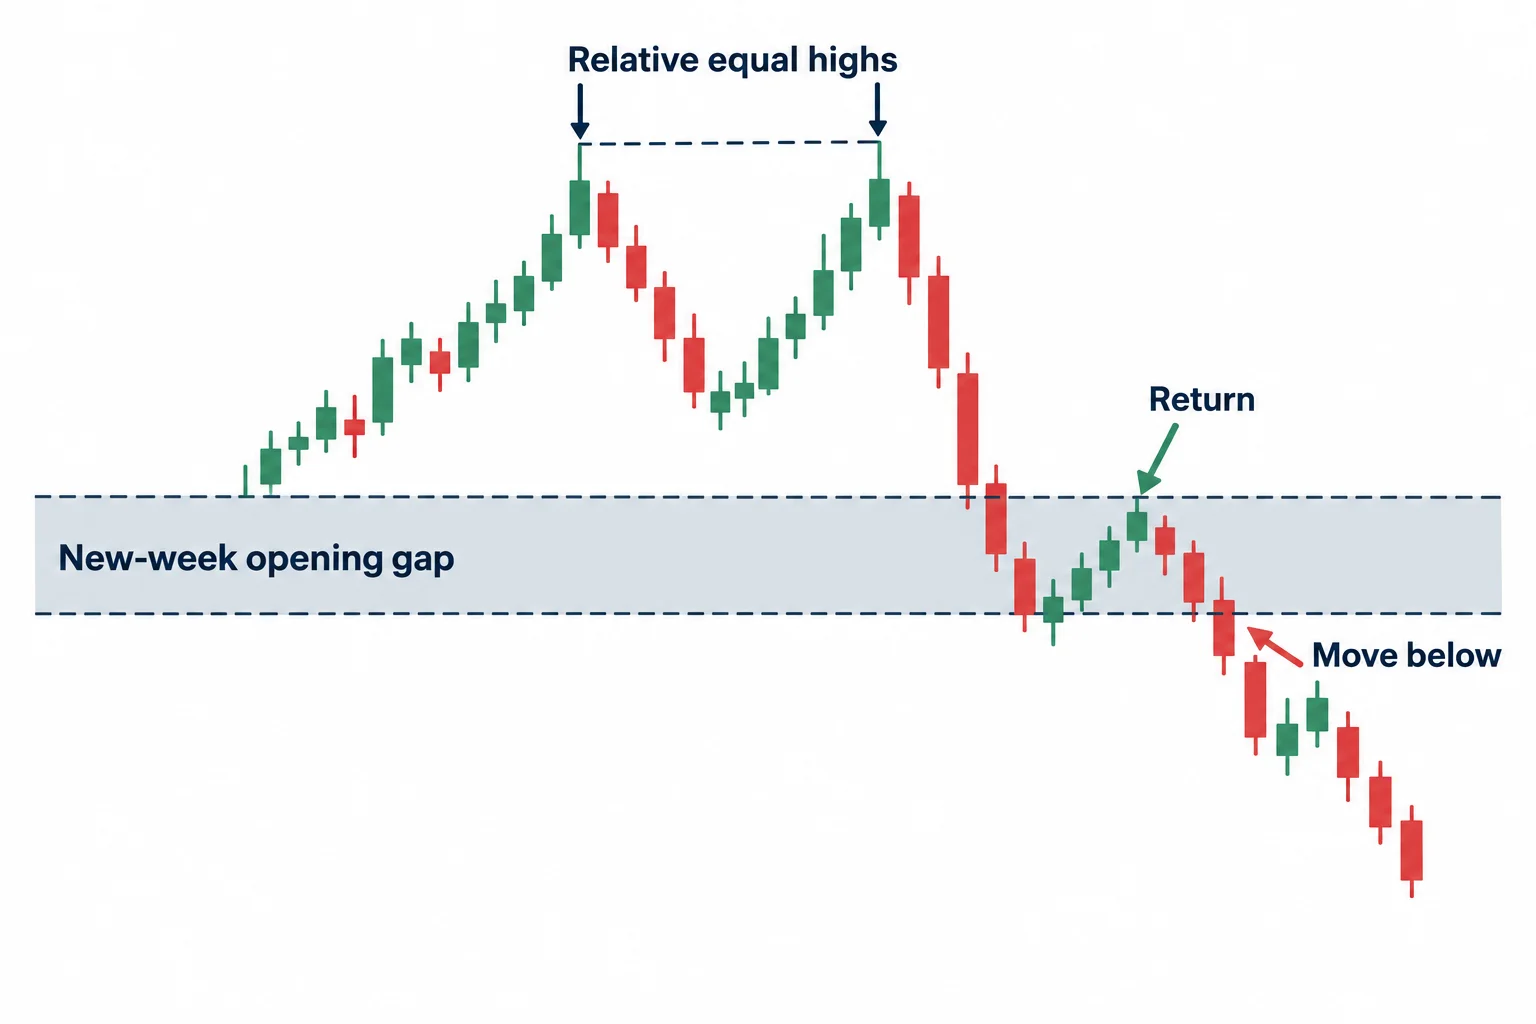
On the 15-minute chart he points at the old high or relative equal highs that price traded about on Monday, and says price then hugged the current new-week opening gap: trading up into it, moving away, and shifting below it (1:18, 1:23, 1:27 and 1:31). He says the same gap is visible on the five-minute chart as a separation after price traded up into the new-week opening gap (1:40, 1:49 and 1:51).
One label in this stretch is genuinely unclear. The captions render a model name as “model 22. or 2022” (1:59), which is not a term defined anywhere in the recording, so it is flagged here rather than guessed at. He then says price returns back to what he calls a very bad gap (2:03 and 2:05).
The hourly chart supplies the destination. He says there is a small gap below that low and calls it the first imbalance below a south-side liquidity pool (3:40, 3:44 and 3:47). Using the low-to-high range for equilibrium, he says the objective sat below equilibrium, which he says is sufficient to identify the setup (3:54, 3:57 and 4:00). The caption track garbles “sell-side liquidity” as “cell tele quality” at one point (3:37); given the surrounding context of resting liquidity below price, that is treated as a caption artefact rather than a separate term.
ICT Futures Silver Bullet and Order Block Entry
He names the setup as the ICT Silver Bullet trade, which he calls his son Cameron’s model, and places it between the 10 and 11 o’clock hour (2:07 and 2:13), looking for a fair value gap to trade into (2:22). He notes a high-impact news release at 10 and says he used the order block, shorting while price was inside it (2:27, 2:30 and 2:33).
He reports taking a small profit on that first move just to show his son the process, and gives his own scale for it: five points, which he says is like twenty points on a Nasdaq trade in his opinion, while acknowledging it may not be the same for everyone (2:38, 2:44 and 2:47). He then says he noticed the move was likely to continue and used what he calls the Sick Sister approach discussed in earlier Twitter spaces, saying the fuller explanation will come in a dedicated lesson (2:54, 2:57 and 3:01).
The cross-market part is stated briefly: he says he used the Sick Sister mentality to get in sync with what had already transpired in ES, which was also looking for lower prices (3:10, 3:12 and 3:17). In this clip the ES reference is supporting context for the Nasdaq idea rather than an independent signal, and the recording does not test whether the comparison works as a rule.
ICT Futures One Minute Execution Review
On the one-minute chart he adds his executions and points to the entry inside the order block (4:16, 4:20 and 4:22). The entry level is the clearest caption problem in the clip: the audio comes through as “32 I’m sorry 13. 1000 281 and a half” (4:27, 4:30), which reads as a self-correction to roughly 13,281.5, but the auto-captions cannot establish the exact price, so the number is reported as an approximate self-corrected figure rather than a verified fill. He says the position was inside the five-minute order block and that he covered as price ran through the nearby low (4:33 and 4:37).
He then admits the second entry was not his best work. He says he saw the next gap, expected price to spike back into it first, and it never really did (5:01, 5:05, 5:09 and 5:11). He describes treating that area as a breakaway gap in anticipation of one more push up, says he was fortunate to be in before price wiped out and went lower, and notes an hourly imbalance below as the destination, with a limit order set for the high for five handles, corrected in the same sentence to five contracts (5:29, 5:39, 5:42 and 5:44).
He closes with two numbers. First the ES-versus-Nasdaq conversion he uses for teaching, which the captions render as “ 5 or 5 for 20” (4:53 and 4:57); he immediately restates it as five handles on ES against twenty on the Nasdaq, so the intended ratio is treated as the rounded 1:4 he states rather than the garbled figure. Then the day’s total, which he says came in just about 80 Nasdaq handles, or about 40 on ES (5:47, 5:55 and 5:57). Both are speaker-reported figures from a short review clip. The recording contains no account statement, no risk per trade, no commission or slippage detail, and no verified fills, so none of it should be read as evidence of performance or counted as a repeatable result.
What the ICT Futures Review Establishes
Read as a sequence rather than a signal, the clip documents this order of operations:
- Form a directional bias from the draw on liquidity (here, lower prices).
- Note where price has already run relative equal highs and left a gap, and keep the first objective nearby rather than distant.
- Use the higher time frames to locate the destination, such as the first imbalance below a pool of sell-side liquidity.
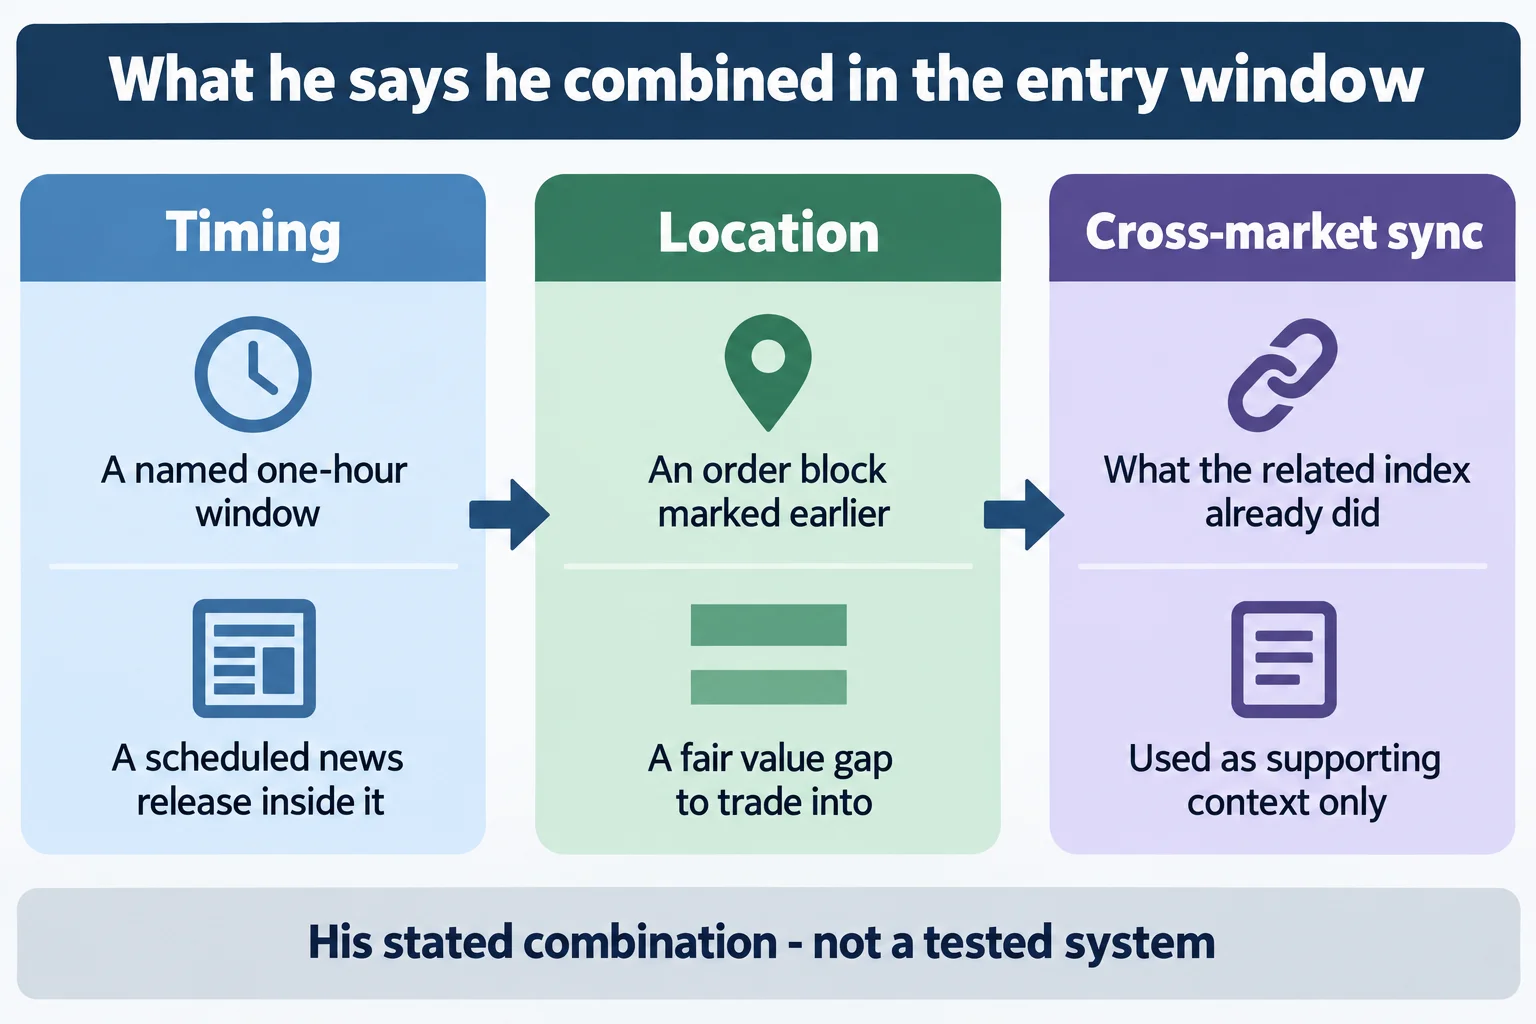
- Combine a clock window with a marked order block and a fair value gap for the entry.
- Use a related index’s behaviour as supporting context, not as a stand-alone trigger.
What the recording cannot do is confirm any of the reported executions. The captions do not establish contract symbols, exact entry and exit prices, position size, risk per trade, commission or slippage, and the day’s handle figure is his own retrospective claim rather than a verified statement. He also says plainly that one entry was not his best (5:16), which is worth keeping alongside the parts that worked, since the clip is a teaching walk-through and not a tested system.
Why the ICT Futures Review Is a Quick Walkthrough
He finishes the clip the way it starts, as a quick share rather than a full explanation, and points viewers at his own feed for the level details he does not re-draw here (0:36). The review is educational commentary on one speaker’s framework in one session; it is not official ICT material, it is not a tested trading system and it is not investment advice.
NQ Futures Review May 02, 2023
The Inner Circle Trader · published 2 May 2023 · about 6 minutes. This is the primary source for this article; every timestamp link above points into it.
The video is not embedded here because the owner has disabled playback on other websites. That was checked directly on 15 September 2026: the player loads and returns “Playback on other websites has been disabled by the video owner” instead of playing, at both desktop and mobile viewport sizes.
These are the sources checked for this article. The regulator and industry pages below are general material about leveraged futures trading and about trading systems sold to the public; they are not assessments of ICT or of anything said in the recording, and none of them verifies a statement made here. Any ICT, smart-money or third-party indicator, script, note set or transcript circulating outside the publishing channel’s own upload page is unofficial and untested here.
- [1] NQ Futures Review May 02, 2023 (The Inner Circle Trader; primary source; watch page read 15 September 2026, 5M59S)
- [2] The Inner Circle Trader (official YouTube channel; read 15 September 2026)
- [3] CFTC (Fraud Advisory: Commodity Trading Systems Sold on the Internet; read 15 September 2026)
- [4] NFA (Investor Education & Resources; read 15 September 2026)
This is independent educational commentary on one speaker’s framework and his review of one session. It is not official ICT material, it is not a tested trading system and it is not investment advice. Reported figures are the speaker’s own and are unverified. Leveraged index futures trading involves substantial risk and is not suitable for everyone.

