
Key takeaways
ICT’s July 23, 2023 review covers the US Dollar Index, EUR/USD, S&P 500 futures and Nasdaq futures without committing to a direction.
Read the full summary
ICT’s July 23, 2023 review covers the US Dollar Index, EUR/USD, S&P 500 futures and Nasdaq futures without committing to a direction. He notes the Dollar Index came one pipette short of a weekly reference high, marks two wick midpoints as levels to observe, and describes a small untraded liquidity void on the daily chart. He calls the EUR/USD weekly volume imbalance complete after a months-old draw on liquidity was delivered, then says the next move could run either way and drops to intraday sessions as a result. On the equity indexes he declines to call a top, ties any change of posture to a weekly close below a down-close candle’s low, and frames further downside as a retracement that need not break the bullish structure. His plan for the new week is intraday only, with Monday used to read the developing weekly candle and no trading before Tuesday.
How we researched this article
BestProps used document-based research from primary firm sources, checked September 24, 2026. The complete source list, scope, limitations, and commercial-state record appear near the end of this article.
In ICT Mentorship 2023 – July 23, 2023 Market Review, ICT examines the US Dollar Index, EUR/USD, S&P 500 futures and Nasdaq futures. The recording was made before the new trading week opened—he says the time was a little after four o’clock his local time—so the central lesson is about what to do when the available information does not justify a firm directional call.
This article is grounded in the recording’s timestamped English captions and summarises his interpretations. Where the captions misrecognise his vocabulary, the error is noted rather than silently corrected. His terminology and conclusions are his own framework; nothing here proves the concepts produce a repeatable edge.
Dollar Index: a wick midpoint and an untraded void
On the weekly Dollar Index chart at 0:31, ICT returns to a discount area he raised the previous week. He notes that price came one pipette short of touching the relevant high—the low of a particular weekly candle, which he identifies by the week’s date on the chart. He then marks the midpoints of two wicks and says he will watch how price behaves if and when it reaches either (1:18). In his vocabulary that midpoint is “consequent encroachment”; the captions render it “consequent encouragement,” which is a recognition error.
On the daily chart at 1:47, he points to a small space where, in his description, no trading printed between one candle’s high and the next candle’s low. He calls it a real liquidity void and sets out two readings rather than one: price could reprice up into it, or it could stay open while price trades lower—and he adds that such a void can remain open for a long time. The captions carry no prices, so its boundaries cannot be reconstructed from the transcript.
EUR/USD: a completed objective is not a new forecast
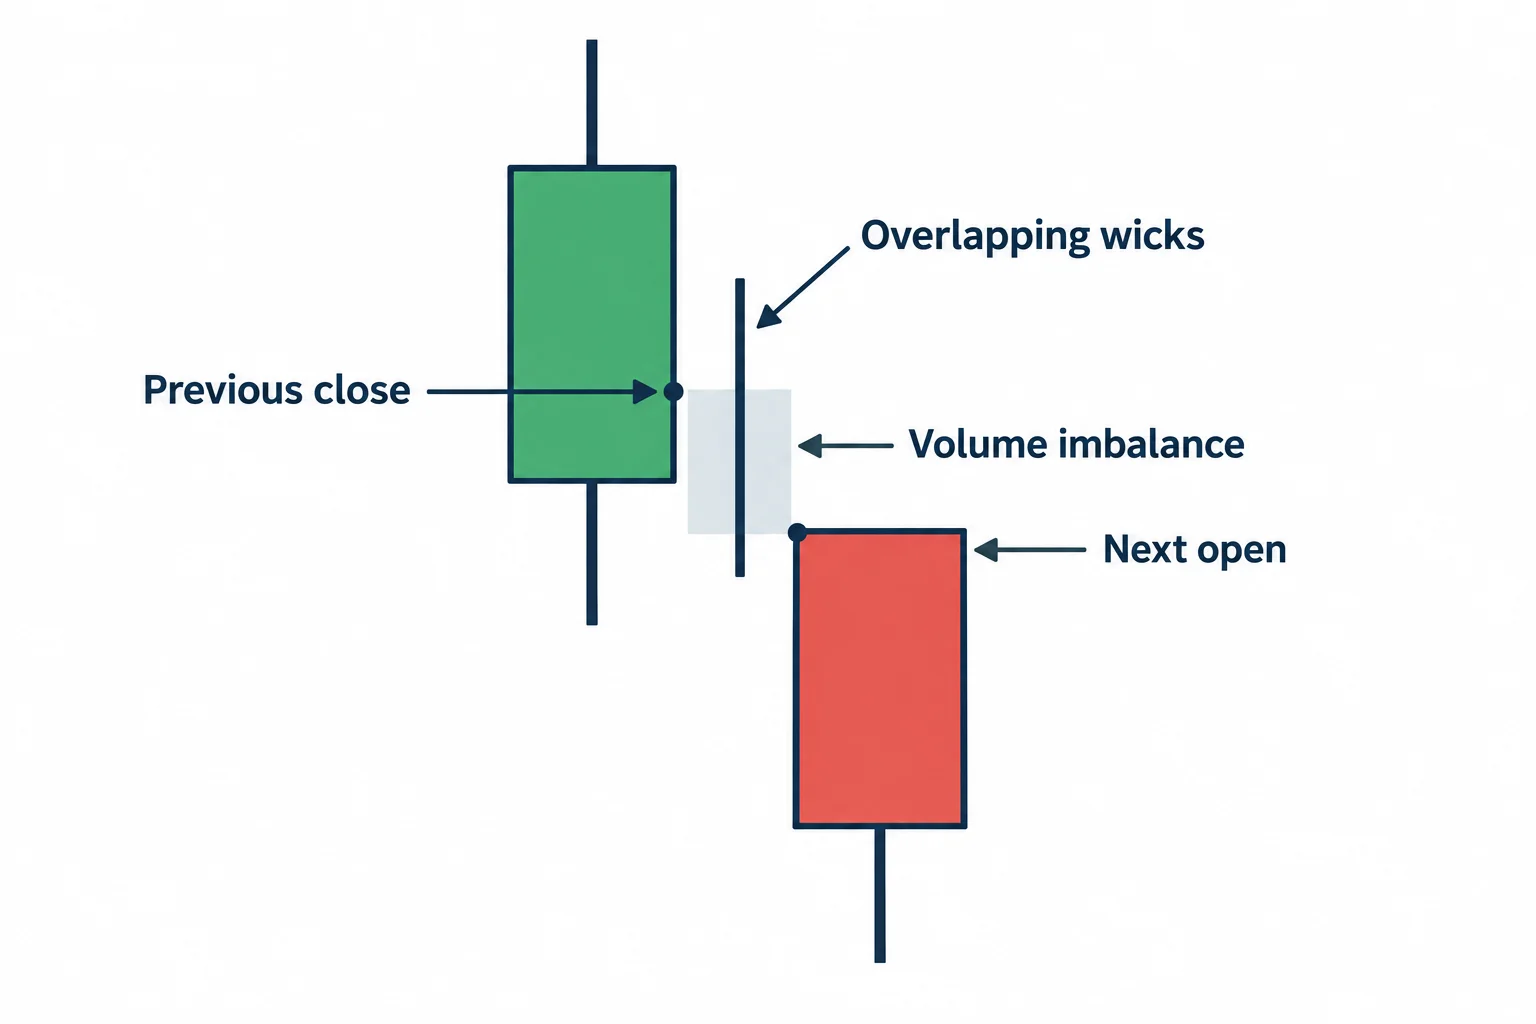
The EUR/USD section begins on the weekly chart at 2:37, where he defines a weekly volume imbalance as the difference between one weekly candle’s close and the next candle’s open when no candle body occupies the range between them. Wicks may overlap, he says, but that does not make the delivery efficient (3:12).
He states that a draw on liquidity he had discussed for several months was finally delivered (3:59): price traded up to the high of that weekly imbalance and closed back near its low end. He refers to a July 9 analysis video without naming its URL, so this article does not try to identify it.
At 5:33 comes the most useful passage in the recording. Acknowledging that viewers have just watched his expectation deliver, he says the obvious next question—“what’s the next move?”—does not have to be answered immediately. He sees a plausible draw higher into a fair value gap and a plausible dig deeper into an inefficiency, calls it a fifty-fifty proposition, and concludes that the appropriate response is to drop below the daily chart and trade the intraday London and New York sessions instead (6:27).
On the hourly chart at 6:43, he marks an upper and a lower area of interest but declines to lean either way because Sunday’s opening price was not yet available. He is explicit that this limitation is normal: Sunday’s opening price is, in his words, unknowable, and a trader has to submit to not knowing it and then watch how price behaves after the open (7:49).
S&P and Nasdaq: bullish, but conditional on a weekly close
Turning to the weekly S&P and Nasdaq charts at 8:13, ICT says both markets reached the upside inefficiencies he had flagged as likely draws, and that Nasdaq was sent higher off a weekly fair value gap in discount. He then states plainly that he is not trying to pick a top (9:05).
His change of posture has a specific trigger: a closing basis break below the low of a stated down-close weekly candle. He repeats that it has to be on a closing basis for both indexes. If that happened he would assume an intermediate-term high was forming for the S&P—explicitly not “the top,” and explicitly not a claim that price cannot go higher later in the year—and would shift to looking for lower-time-frame sell setups until the market showed it wanted to be bullish again. At the time of recording he says nothing on either chart indicates a top (10:13).
On the daily S&P chart at 10:24, he describes a retracement into an incompletely filled inefficiency, and notes it could trade down there without disturbing the longer-term bullish structure—there is a swing low with trailing stops beneath it, and a further inefficiency below that. He would like to see the lower area stay open as a breakaway gap. The scenario changes if price trades on a closing basis above Friday’s high. For Nasdaq he wants a move down into an order block, and possibly its mean threshold if the market gaps down first (11:47).
Intraday scenarios for the new week
At 13:14 ICT reviews a 15-minute S&P sequence built from a weekly volume imbalance, what he calls a balanced price range formed by a single up-candle buy-side imbalance paired with a single down-candle sell-side imbalance, sell-side liquidity, and a fair value gap. He favours an early-week probe of the lower sell-side pools unless price gets above the high he is using as his invalidation reference (14:58).
The Nasdaq 15-minute review at 15:10 follows the same conditional shape. He says the market looks heavy while it stays below a short-term high and describes a preferred gap-lower scenario that fills a gap and reaches into a fair value gap and breaker. He also mentions having traded this particular setup on the Friday (15:48), which is his own account of his own trade; the recording does not show the fill, the size, the risk or the result, and it should not be read as a verified outcome or something to copy.
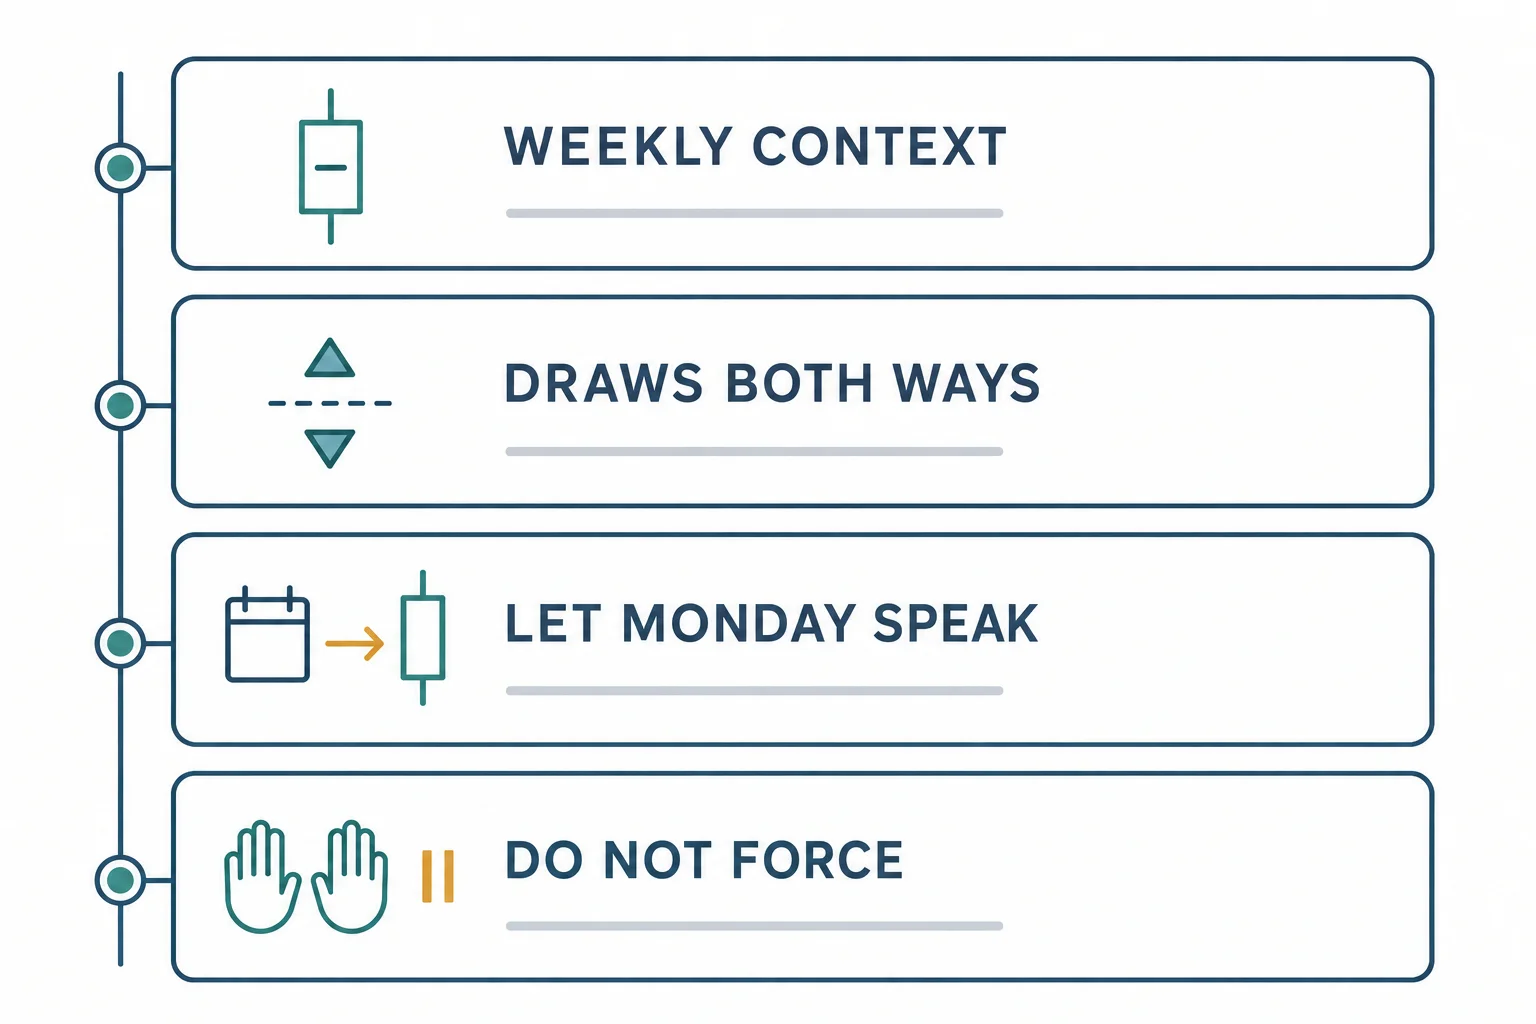
Immediately after describing the scenario he tells viewers not to bet on it, not even to take a trade on it, and to simply observe it (16:28). He says he will not be trading until Tuesday, using Monday to build a better foundation for what he thinks the weekly candle will do. His stated mode for the whole week is intraday only, with no daily bias: buy-side or sell-side liquidity and inefficiencies, and nothing else.
What carries over beyond the terminology
The closing message at 16:57 is a process point rather than a market call. ICT notes that July was a strong month for a daily-chart swing model, then adds that such setups do not appear every day or every week, and that the correct response when they are absent is to sit still and let the next one arrive. He frames the whole recording as a review and as counsel, and says he is going slowly into the new week.
Set his vocabulary aside and several general practices remain:
- State the invalidation level before describing the trade you expect.
- Separate a completed objective from a new forecast; the end of one move is not a reason to invent the next.
- When higher-time-frame evidence genuinely supports both directions, reduce the timeframe rather than the standard of evidence.
- Treat an unknown input—an upcoming session’s opening price—as unknown instead of assuming a value.
- Require a close, not just a touch, when the rule that matters is a weekly close.
This is independent educational commentary, not investment advice. Futures involve substantial risk, and no analytical framework guarantees a result.
Watch the original recording
This article draws on the timestamped English captions of ICT Mentorship 2023 – July 23, 2023 Market Review. Captions support the speaker’s words; they cannot independently establish chart prices or the outcome of any trade he mentions. The chart markup is the substance of the review, so the recording is worth watching directly.
Watch the original lesson on YouTube
The video cannot be played inside another website: when its embedded player was opened and clicked on 15 September 2026, the player itself reported “Video unavailable” and “Playback on other websites has been disabled by the video owner.”, with no duration and no playback progress reported. That message is the reason no embed is reserved or left blank here; the recording itself is available directly on YouTube.
Watch ICT Mentorship 2023 – July 23, 2023 Market Review on YouTube ↗
Primary source and further reading
- The primary source: the original July 23, 2023 market review: use the timestamp links above to compare each explanation with what he actually said.
- The Inner Circle Trader YouTube channel: the publisher’s own channel, where this review and adjacent sessions are posted. Unofficial third-party reuploads and summaries are not the source used here.
- YouTube’s “Embed videos & playlists” help page: platform documentation relevant to the disabled-embedding notice above.
- CFTC Learn & Protect: the US regulator’s investor-education and fraud-warning material. A general reference, not a statement that this recording or this article violates or complies with any particular rule.
This is independent educational commentary. It is not official ICT material, a tested trading system, or a claim that any reported result can be reproduced.


