
Key takeaways
ICT’s Market Review & Commentary, uploaded July 16, 2023, works through the U.S.
Read the full summary
ICT’s Market Review & Commentary, uploaded July 16, 2023, works through the U.S. Dollar Index, EUR/USD, E-mini S&P 500 and Nasdaq futures after a strong week. He treats old highs and lows as liquidity destinations rather than support and resistance, reads the Dollar Index approach into a weekly fair value gap formed by the weeks beginning March 28 and April 11, 2022, and expects EUR/USD to hold a weekly inversion fair value gap as support before running into a weekly volume imbalance — while conceding that spread widening, not the directional idea, would have stopped a long out. His homework is to overlay 0.25 / 0.50 / 0.75 Fibonacci gradients on that weekly imbalance and study lower-time-frame behaviour at each. For ES he describes a failed late-April-to-May seasonal weakness that argued for the opposite direction, then traces a narrow weekly liquidity void — distinct, in his terms, from a broad volume imbalance — down through daily, hourly and five-minute charts using its measured midpoint. For Nasdaq he lays out the TGIF model: after a large weekly range, look for a 20–30% retracement late in the week, with the 15,698.5 level as the 20% mark, and a Fibonacci extension to about 15,856.25 as a projected weekly range high. He states he went short into an inversion fair value gap and took “a little bit of heat.” Nothing in the transcript independently verifies the chart markings, the fills, the seasonal statistics or the claim that this is algorithmic delivery, so treat it as a chart-study lesson rather than a performance record.
How we researched this article
BestProps used document-based research from primary firm sources, checked September 24, 2026. The complete source list, scope, limitations, and commercial-state record appear near the end of this article.
In ICT Mentorship 2023 – Market Review & Commentary, uploaded July 16, 2023, ICT reviews the U.S. Dollar Index, EUR/USD, E-mini S&P 500 futures and Nasdaq futures. He interprets the preceding week through his concepts of liquidity, fair value gaps, order blocks, breakers, volume imbalances and seasonal tendencies, and he explicitly builds on his July 9, 2023 review.
This article is grounded in the recording’s timestamped English captions and summarises his interpretations. The captions support his descriptions; they cannot independently establish chart markings, fills, prices beyond those he states, or subsequent performance. His vocabulary and conclusions are his own framework.
Dollar Index: liquidity as a destination, not support
ICT opens on the weekly Dollar Index chart at 0:18 and refers viewers back to the July 9 review first. He says price drew toward sell-side liquidity and came within roughly a tick of the high of a weekly fair value gap—an interval he ties to the weeks beginning April 11, 2022 and March 28, 2022—and that he would watch whether it dug into that area during the coming week.
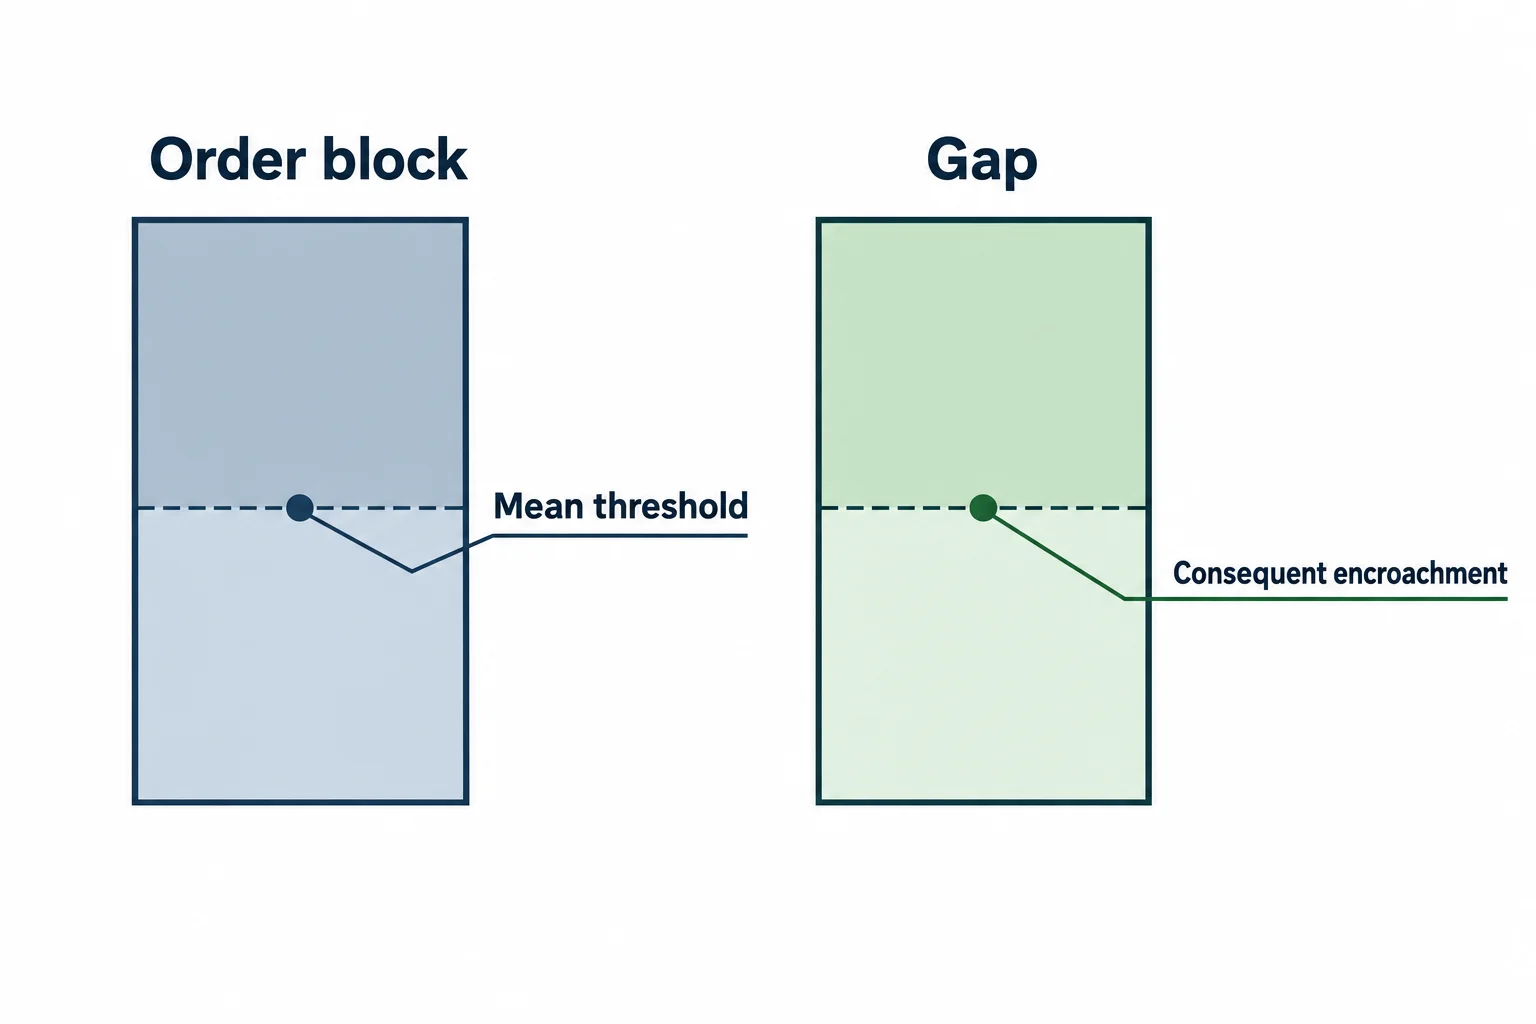
On the daily chart at 2:04 he returns to the breaker he had flagged on July 9, describes price opening and trading up into it, and measures its midpoint. He draws the terminology distinction explicitly: the midpoint of an order block is its “mean threshold,” while the midpoint of a gap or inefficiency is “consequent encroachment.” The captions render the second term as “consequent encouragement” throughout, a recognition error.
At 4:07 he makes the argument that carries the section. Reading viewer comments, he rejects the idea that he is calling sell-side levels support: in his framework buy-side liquidity above old highs, relative equal highs or a single high is a draw for markets going higher, and the equivalent is true below lows. He then says flatly that he does not believe in support and resistance. That is a statement of his method—useful for understanding how he annotates charts—and not an established fact about how markets price.
EUR/USD: an inversion gap as support, and a caveat about execution
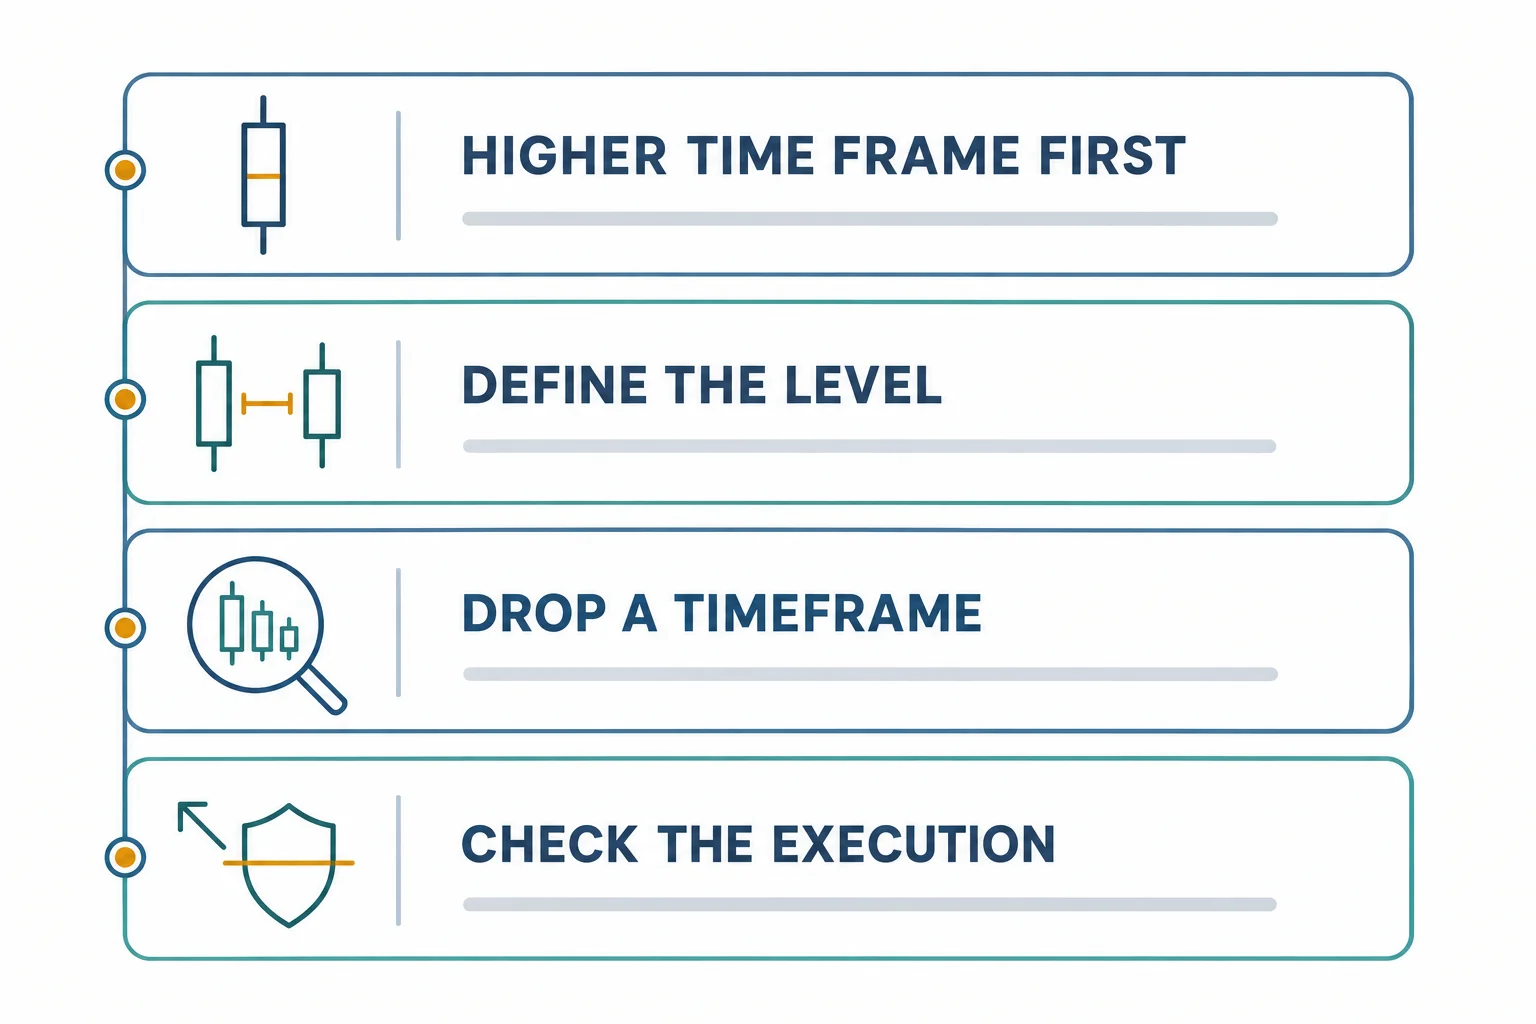
The EUR/USD section starts at 7:13 on the weekly chart. He notes that the weekly inefficiency has to be transposed onto the daily chart or you lose sight of the higher-time-frame context, then defines the weekly volume imbalance he had flagged for months and describes price drawing up into it (7:15).
The important distinction in this section is between a weekly inversion fair value gap and a liquidity void. He says he is looking for the level to act as support, which is what makes it an inversion gap in his vocabulary, rather than reading it as a sell signal (9:17).
He then supplies the most valuable caveat in the recording. At 9:37 he admits the lows on the displayed chart do not match one another, tells viewers not to be fooled by the visual representation, and says that, for the spread, a long would have been stopped out—the broker would have widened the spread and tagged the position before it could capture the move. Separating a correct directional narrative from an executable trade is a point that generalises well beyond his terminology.
On lower time frames he points to order blocks, gaps and a measuring gap—an inefficiency he treats as evidence instigating a new rally—as the way to study the move. His homework at 16:04 is specific: lay a Fibonacci overlay on the weekly volume imbalance from its actual high to its actual low, then study one- and five-minute behaviour every time price traded at or near the 0.25, 0.50 and 0.75 gradients.
ES: a failed seasonal tendency and a narrow liquidity void
At 16:51 ICT brings up an E-mini S&P seasonal tendency chart and describes his usual spring setup: a shorting opportunity into the last week of April and through May, with June typically producing a strong low. This year, he says, the internals did not present that idea technically, so no short was taken and no loss was incurred. He reads the absence of the expected seasonal weakness as information pointing the other way, and highlights the third weeks of May and June as historically favourable buying windows for index futures (18:11).
Two qualifications belong here. The premise itself—reading a failing seasonal tendency as the setup for explosive movement the other way—he credits to Larry Williams, whose course he says he studied in 1995 (48:36). And he names Steve Moore’s MRCI.com as his preferred source for seasonal charts while stating he has no business relationship with it (19:51). The recording supplies no statistical test of any seasonal claim, so these are tendencies he is reporting, not measured probabilities.
On the ES weekly chart at 20:37—a September 2023 contract—he draws a sharp contrast between a broad weekly volume imbalance and what he insists is a genuinely different object: a narrow interval between two weekly candles where he says no volume exists at all. He calls the latter a real liquidity void, notes that the broader area has been loosely called one, and says he went along with that looser usage early on to avoid confusing students (21:03). He measures the interval’s midpoint with a Fibonacci retracement, but the captions render the resulting figure as “4 500 59 and a half” (23:23), which is ambiguous as written and is flagged here rather than silently converted into a level. He then works the same higher-time-frame area down through the daily chart at 24:09, the hourly chart at 24:53 and a five-minute chart at 26:30 as a worked example of top-down analysis.
Nasdaq: the TGIF model and a projected weekly high
The Nasdaq section starts at 27:50. On the weekly chart he marks a weekly fair value gap that price traded into two weeks earlier, then measures the current week from its low to its high and marks the 20% and 30% levels. He defines TGIF as a day-of-week model: after a large directional weekly range, look for a retracement of roughly 20% to 30% of that range toward the end of the week. For the week shown he states the 20% level as 15,698.5 and calls it the level to watch for the rest of the presentation.
On the hourly chart he identifies what he calls a bullish ICT breaker, using the low-to-high range prior to a lower low as the measuring range, and applies Fibonacci extensions to it. Negative two standard deviations comes in, in his reading, at about 15,856.25—which he notes is not the actual high but close to it, and treats as a projected weekly range high (28:37). These are his projected levels, not outcomes.
He then follows the delivery lower through small inefficiencies and a return into a gap, and says price dived for sell-side liquidity below the weekly TGIF 20 level. At 39:58 he states that he went short there, inside the inversion fair value gap, took a little bit of heat on it, and then watched it run lower. He also points out that the week closed very close to the 20% level. That is his own account of his own trade: the recording does not show the entry, size, stop, exit or net result, and it should not be read as a verified outcome or something to copy.
What carries over beyond the terminology
Near the end ICT says the material is dense by design and that it cannot be learned from an abbreviated summary; he argues that the concepts require case-study repetition. Whatever one makes of the claim that his approach is uniquely accurate, the session models a few practices that stand on their own:
- Carry higher-time-frame annotations down to lower charts instead of re-deriving context on each one.
- Separate a directional forecast from the availability of an entry and acceptable risk—as his own spread remark shows.
- Measure a level before deciding what price should do at it; a midpoint is only useful if it was defined in advance.
- Treat a failed seasonal pattern as information, and treat a seasonal pattern itself as context needing confirmation rather than a signal.
- Study a completed session in detail rather than immediately hunting the next forecast.
His stronger assertions—that this reflects algorithmic delivery, and that no other educator teaches it—are his opinions about his own method. The transcript cannot substantiate them, and nothing here is investment advice or a promise of performance.
Watch the original recording
This article draws on the timestamped English captions of ICT Mentorship 2023 – Market Review & Commentary. Captions support the speaker’s words; they cannot independently establish chart prices or the result of the trade he describes. The chart markup is the substance of the lesson, so the recording is worth watching directly.
Watch the original lesson on YouTube
The video cannot be played inside another website: when its embedded player was opened and clicked on 15 September 2026, the player itself reported “Video unavailable” and “Playback on other websites has been disabled by the video owner.”, with no duration and no playback progress reported. That message is the reason no embed is reserved or left blank here; the recording itself is available directly on YouTube.
Watch ICT Mentorship 2023 – Market Review & Commentary on YouTube ↗
Primary source and further reading
- The primary source: the original July 16, 2023 Market Review & Commentary: use the timestamp links above to compare each explanation with what he actually said.
- The Inner Circle Trader YouTube channel: the publisher’s own channel. The July 9, 2023 review that this session explicitly builds on is posted there; look it up on the channel rather than relying on reuploads. Unofficial third-party reuploads and summaries are not the source used here.
- YouTube’s “Embed videos & playlists” help page: platform documentation relevant to the disabled-embedding notice above.
- CFTC Learn & Protect: the US regulator’s investor-education and fraud-warning material. A general reference, not a statement that this recording or this article violates or complies with any particular rule.
This is independent educational commentary. It is not official ICT material, a tested trading system, or a claim that any reported result can be reproduced.

