
Key takeaways
ICT Episode 39 studies a bearish June 2022 E-mini S&P 500 futures session using a 4070 sell-side liquidity objective, a daily fair value gap below it, the New York midnight open and Power of Three accumulation, upward manipulation and bearish distribution.
Read the full summary
ICT Episode 39 studies a bearish June 2022 E-mini S&P 500 futures session using a 4070 sell-side liquidity objective, a daily fair value gap below it, the New York midnight open and Power of Three accumulation, upward manipulation and bearish distribution. The simplified model focuses on eight thirty a.m. for economic releases, nine thirty a.m. for the regular U.S. equity open and one thirty p.m. for post-lunch setups. Traders first establish higher-time-frame direction and a liquidity target, then wait for a short-term high to be swept, bearish displacement and a retracement into a three-candle fair value gap, preferably with price at or above the midnight open in a bearish scenario. The afternoon variation watches noon through one p.m. highs for a buy-side liquidity run and bearish breaker, but neither the pattern nor a liquidity sweep is valid without the broader objective and expected follow-through. ICT recommends taking one opportunity, using backtesting and paper or demo trading, avoiding revenge trades and reducing exposure when expected displacement fails. The article notes that ICT-specific mechanisms and performance claims lack independent statistical verification, while unavailable charts prevent confirmation of exact entries and fills.
How we researched this article
BestProps used document-based research from primary firm sources, checked September 19, 2026. The complete source list, scope, limitations, and commercial-state record appear near the end of this article.
In 2022 ICT Mentorship Episode 39, ICT reviews a bearish session in the June 2022 E-mini S&P 500 futures contract and then extracts a simpler study framework from it. The central lesson is that a price level should not be considered in isolation: ICT combines a directional narrative, liquidity objectives, higher-time-frame reference points and specific New York session times.
This is a summary of ICT’s interpretation of the session, not independent proof that markets follow the mechanism he proposes. The recording’s charts are not available in the transcript, so exact chart markings, entries and fills cannot be independently verified here.
ICT Episode 39 Higher Time Frame Objective
ICT begins with a daily chart beside an hourly chart. At 00:12, he explains that the purpose is to show how lower-time-frame movement is subordinate to levels identified on a higher time frame.
His stated bias was bearish. He focused on relative equal lows as a source of what he calls sell-side liquidity, with the 4070 area serving as a near-term objective. If price moved through those lows, he expected attention to shift toward a daily fair value gap below them. In ICT’s framework, this implied the possibility of a larger daily range rather than a brief sweep followed automatically by a reversal.
That distinction is important to the lesson. Around 06:14, ICT warns that it is not always enough to run below relative equal lows and then simply go the other way; the broader narrative determines whether price reverses after reaching liquidity or continues toward another higher-time-frame objective. He is explicit that the shape alone is not a mechanical signal.
ICT Episode 39 Chart Setup Essentials
ICT recommends beginning analysis on the higher time frame and transferring only relevant levels to the execution chart. His suggested annotations include:
- A likely liquidity objective above or below the market.
- A level that would support or challenge the directional bias.
- A higher-time-frame fair value gap or other “PD array” used in his terminology.
- The New York midnight opening price.
At 07:57, he identifies an hourly fair value gap and bearish order block. He describes a fair value gap as a three-candle formation in which part of the middle candle’s range is not overlapped by the adjacent candles. These are ICT-specific interpretive concepts; the episode does not provide statistical testing of them.
ICT Episode 39 Midnight Time and Power of Three
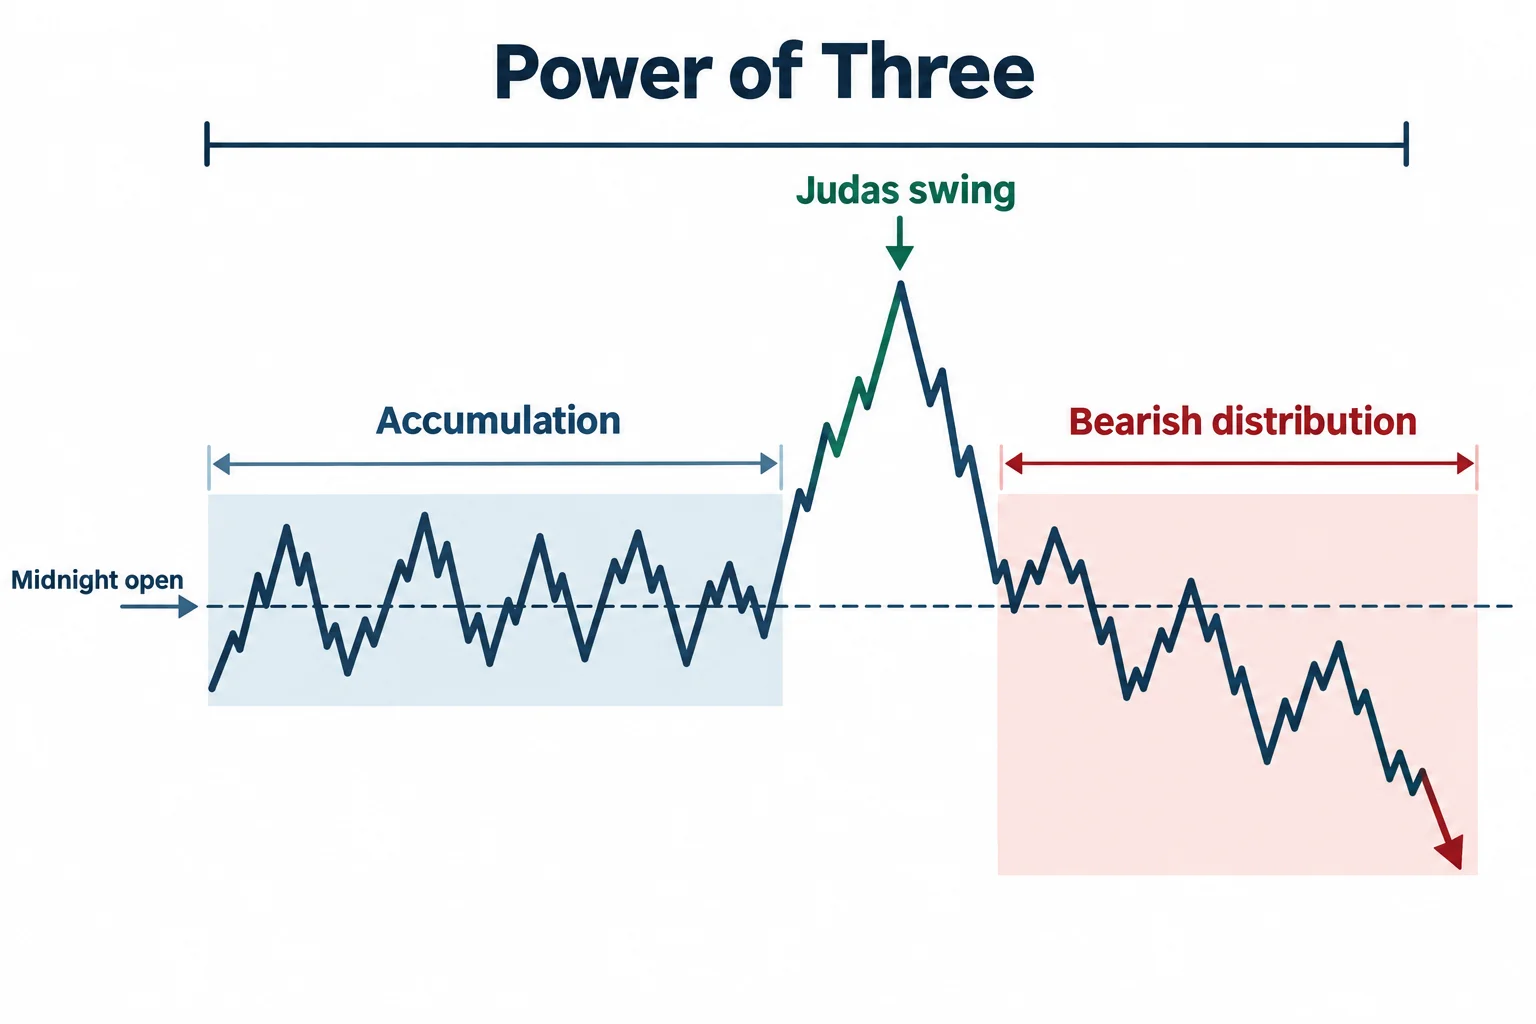
A major part of the review applies ICT’s “Power of Three” concept. Beginning around 10:57, he frames the session as accumulation, an upward manipulation or “Judas swing,” and then bearish distribution.
For a day expected to expand lower, ICT says he prefers potential short locations at or above the midnight New York opening price. In the reviewed sequence, he interprets the rally into a short-term premium and the subsequent break below relative equal lows as support for the bearish narrative. The next objectives, in his account, were the 4070 area and the daily fair value gap beneath it.
This is not presented as a rule that the midnight open always predicts direction. Rather, direction is selected first, and the opening price is then used as a contextual reference for premium or discount.
ICT Episode 39 Afternoon Session Setup
At 15:29, ICT turns to afternoon trading. Before considering an entry, he says a trader should ask what the daily range is attempting to accomplish: continued expansion, a morning reversal, a countertrend move or consolidation ahead of news.
For the reviewed bearish day, he treats the noon-to-1:00 p.m. New York lunch period as a potential source of short-term highs. He then discusses a post-lunch run above buy-side liquidity followed by a decline. Around 20:17, he labels the resulting structure a bearish breaker: price trades above a prior high, reverses beneath a short-term low and later returns toward the broken structure while the larger narrative remains bearish.
ICT explicitly says the shape alone is insufficient. Without a bearish objective and surrounding context, he regards the pattern as speculation rather than a valid breaker setup. Later, at 1:10:28, he identifies 1:30 p.m. New York time as the principal post-lunch study window used in this model.
ICT Episode 39 Three Session Study Windows
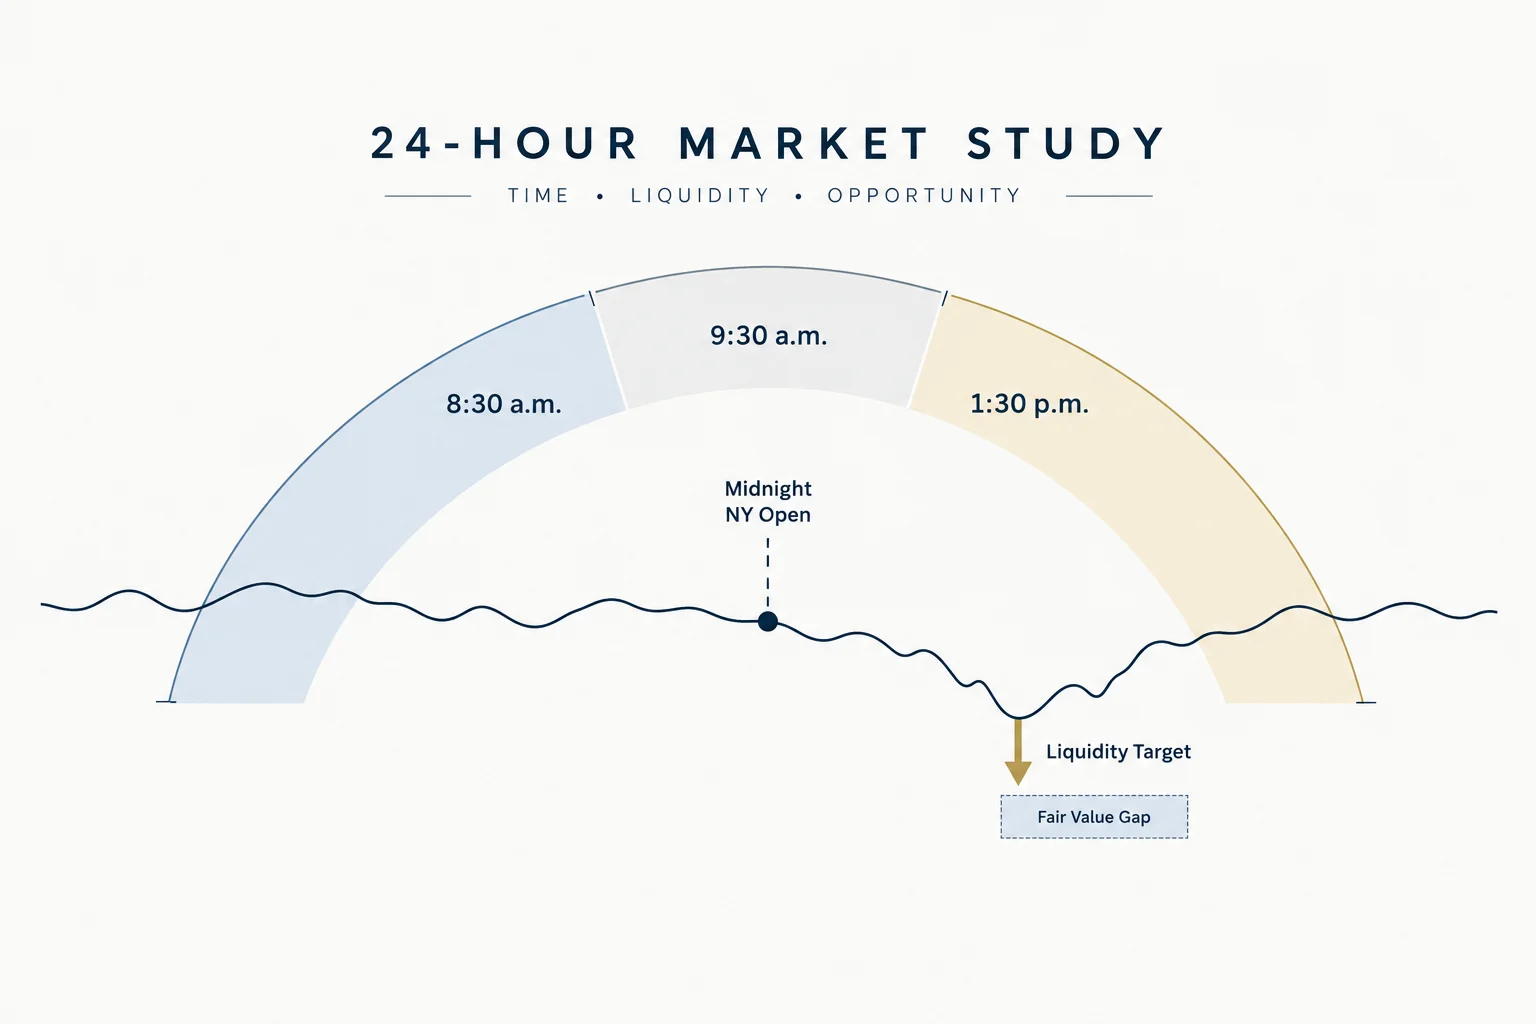
The second half of the episode describes a deliberately narrow model ICT says he was teaching his son. Its purpose was to reduce distractions and study one recurring sequence: identify a liquidity target, wait for displacement, and look for a return into a fair value gap at a designated time.
The three principal windows discussed are:
- 8:30 a.m. New York time: commonly associated in the lesson with scheduled economic releases.
- 9:30 a.m.: the opening of the regular U.S. equity session.
- 1:30 p.m.: a post-lunch opportunity aligned with the daily narrative.
At 39:29, ICT begins illustrating the 8:30 framework. In a bearish scenario, his sequence is: establish a downside liquidity target, observe price above the midnight opening price, wait for a short-term high to be taken, then look for bearish displacement and a retracement into the resulting fair value gap. The inverse logic would apply to a bullish scenario, although this episode concentrates on the bearish example.
ICT Episode 39 Setup Management and Discipline
ICT repeatedly cautions inexperienced viewers against moving directly to live funds. He advocates chart study, backtesting, paper trading or demo execution while learning the model. He also discusses using a small, predetermined objective as a training constraint, but his numerical examples and personal performance claims should not be interpreted as typical or independently verified results.
The broader educational takeaway is process control:
- Choose one live-trading opportunity rather than attempting every session window.
- If an objective is reached, observe later setups instead of automatically trading again.
- Do not rush to recover a loss.
- Review whether price behaved as the narrative required.
- If the expected displacement or reaction fails to appear, treat that as contrary information.
One example appears near 1:03:38. ICT explains that repeated sell-side liquidity runs without meaningful downward progress, followed by price moving above a candle he expected to cap the market, caused him to reassess a demo short. The useful general principle is not the unseen trade itself, but the instruction to define what should happen after entry and reduce exposure when that expected behavior fails.
How to Study 2022 ICT Mentorship Episode 39
A practical review exercise is to mark the midnight open, the three session times, prior short-term highs and lows, and any fair value gaps visible on historical charts. Then record whether the proposed sequence appeared without assuming that every formation was tradable. This converts the episode into a testable observation exercise while keeping ICT’s market claims distinct from established facts.
The episode closes by emphasizing patience, breaks from study when overwhelmed, and gradual development rather than immediate dependence on trading income. Those cautions are especially important because futures trading involves substantial risk and the transcript provides no independently audited evidence of profitability.
Watch 2022 ICT Mentorship Episode 39
This article draws on the timestamped English captions of 2022 ICT Mentorship Episode 39, which were prepared by automatic transcription of the recording. Captions are a source for the speaker’s words, not independent proof of the reported trading performance. The recording’s chart detail remains important when following the annotations.
Watch the original lesson on YouTube
The video cannot be played inside another website: when its embedded player was opened and clicked on 22 September 2026, the player itself reported “Playback on other websites has been disabled by the video owner” and settled on a “Watch on YouTube” prompt, with no duration and no playback progress reported. That message is the reason no embed is reserved or left blank here; the recording itself is available directly on YouTube.
2022 ICT Mentorship Episode 39 Sources
- The original Inner Circle Trader lesson: use the timestamp links in this article to compare the explanation with its source.
- YouTube’s embedding documentation: platform guidance relevant to the external watch link above.
- 17 CFR 4.41: disclosures concerning hypothetical performance: a regulatory reference, not a statement that a particular recording or this article meets every legal requirement.
- Nasdaq Trader: a third-party reference for market data and session times discussed in the lesson; it is unofficial and untested as a source for this model.


