
Key takeaways
2022 ICT Mentorship Episode 29 reviews a paper-trading session that ICT identifies as Monday, May 16, 2022.
Read the full summary
2022 ICT Mentorship Episode 29 reviews a paper-trading session that ICT identifies as Monday, May 16, 2022. He builds a bullish Nasdaq bias from relative equal highs at 12,553.25, supports it with SMT divergence (Nasdaq making lower lows while the S&P holds its corresponding low), rejects a one-minute short because the displacement leg did not leave a fair value gap above its midpoint, and instead describes a run on sell stops, a bullish market-structure shift, and a retracement into a fair value gap. He paper-trades the cleaner S&P structure, reports no Nasdaq executions, and uses a close-proximity entry after recording delays caused him to miss the preferred gap, later adding after another bullish shift and small gap. The session was expected to remain relatively lethargic before May 17 retail-sales data and a Federal Reserve chair appearance. ICT explicitly identifies the activity as paper or demo trading, warns viewers not to assume they can reproduce it or expect profitability, and provides no independently verified or statistical evidence that the framework has a profitable edge.
How we researched this article
BestProps used document-based research from primary firm sources, checked September 25, 2026. The complete source list, scope, limitations, and commercial-state record appear near the end of this article.
2022 ICT Mentorship Episode 29 is a review of a paper-trading session that ICT identifies as Monday, May 16, 2022. The lesson connects a pre-session bullish bias with intermarket divergence, a short-term market-structure shift and retracements toward a fair value gap. It also discusses adapting when the preferred entry is missed.
The recording is best treated as an explanation of ICT’s discretionary framework, not as independent evidence that the framework is profitable. ICT repeatedly identifies the activity as paper or demo trading, and the transcript cannot independently verify anything shown visually on the chart.
ICT Mentorship Bullish Bias
ICT begins by returning to what he calls relative equal highs in Nasdaq at 12,553.25, which he regarded as potential upside liquidity. He says this level helped establish his bullish view for the session. He also notes that both Nasdaq and the S&P had daily swing lows, although the S&P did not present the same relative-equal-high configuration.
See his explanation of the initial bias at 0:30.
Within ICT’s terminology, liquidity is a prospective destination for price rather than a guaranteed target. A useful educational distinction is that bias and entry are separate decisions: a directional expectation may limit which setups receive attention, but it does not itself supply an entry signal.
2022 ICT Event and Volatility Planning
At 1:15, ICT refers to retail-sales data and a Federal Reserve chair appearance scheduled for the following day, May 17, 2022. He interprets the session before those events as relatively lethargic and expects a smaller range.
His broader point is that expected volatility conditions should influence setup selection. A quiet session does not necessarily prevent trading, in his view, but it can make execution more demanding. This is a historical discussion of that particular session, not a current economic-calendar notice.
ICT Mentorship SMT Divergence
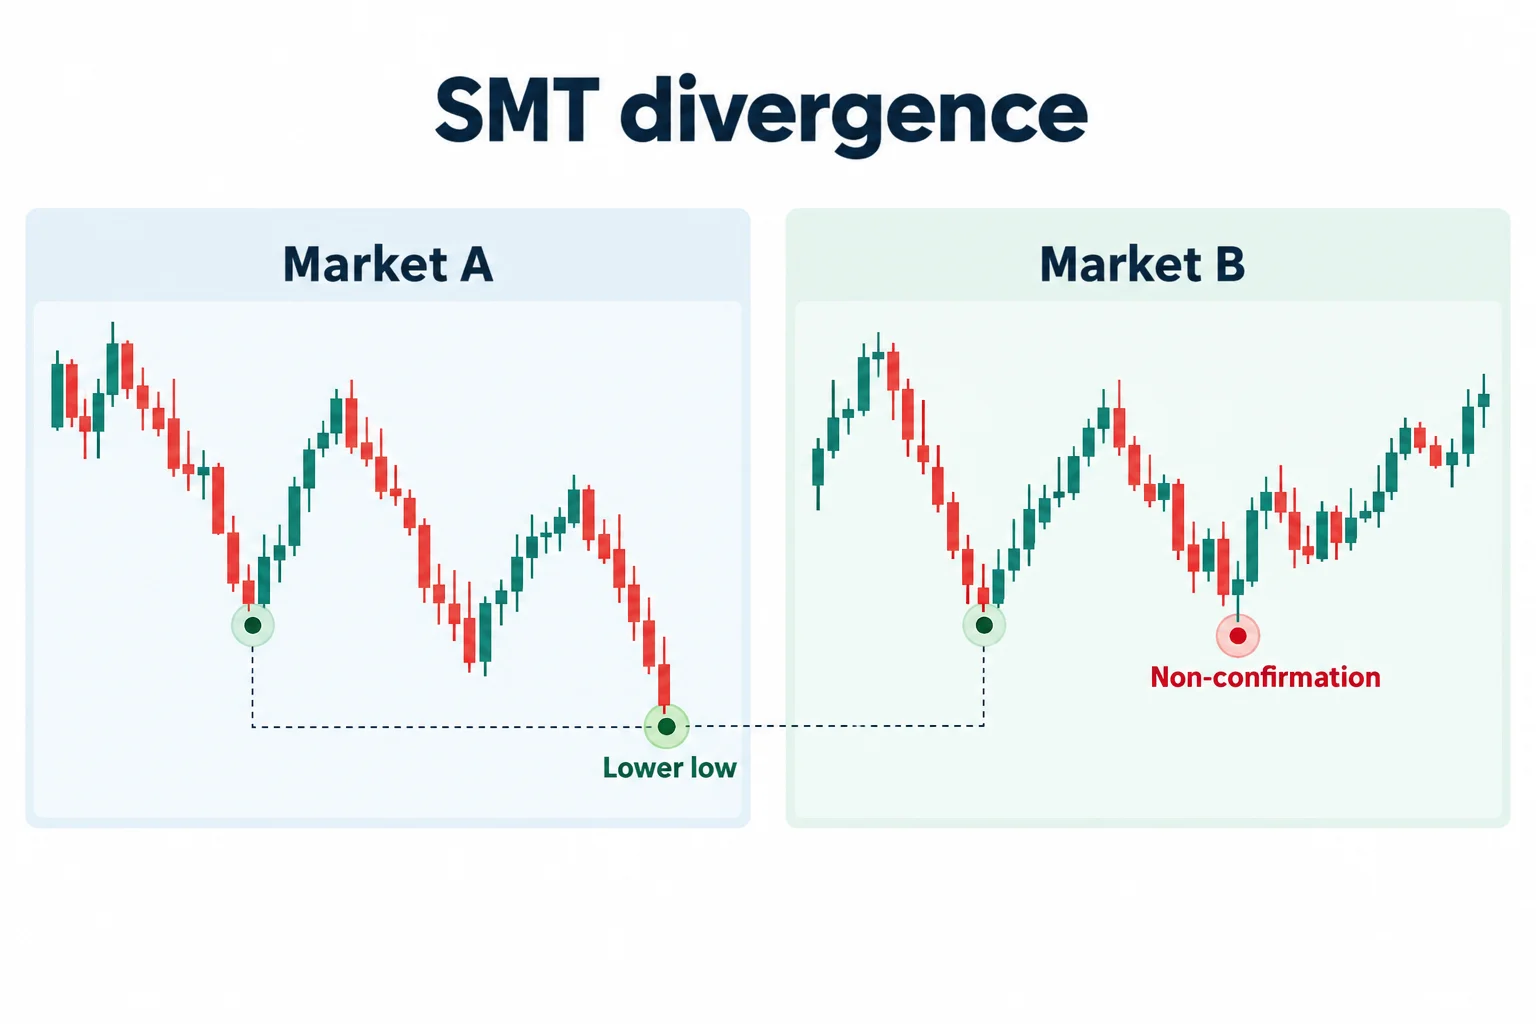
The central analytical idea appears around 3:51. ICT compares the short-term lows in Nasdaq and the S&P. As he describes it, Nasdaq formed lower lows while the S&P resisted moving below its corresponding low. He labels this disagreement an SMT divergence, expanding the abbreviation in the recording as “smart money technique” or “smart money tool.”
ICT uses that relative behavior as supporting evidence for his existing bullish bias. His sequence can be summarized as follows:
- Begin with a bullish directional premise.
- Compare related equity-index markets rather than reading either market in isolation.
- Observe that one index makes a lower low while the other does not confirm it.
- Treat the non-confirmation as support for looking for a long setup, not as a standalone order signal.
This is ICT’s interpretation of intermarket price action. The episode does not provide a statistical test showing how frequently this type of divergence succeeds.
Why ICT Rejected the Episode 29 Short Setup
At 4:55, ICT reviews a one-minute-chart decline that might superficially look like a short opportunity. He rejects it because it does not satisfy his stated model. In particular, he says the relevant displacement leg did not leave the fair value gap in the required area above the leg’s midpoint.
This section illustrates model discipline: not every break of a short-term low qualifies as a trade merely because price subsequently declines. ICT also filters the setup through his bullish bias, saying that he was not interested in shorts during this session.
ICT Mentorship Long Entry and Fair Value Gap
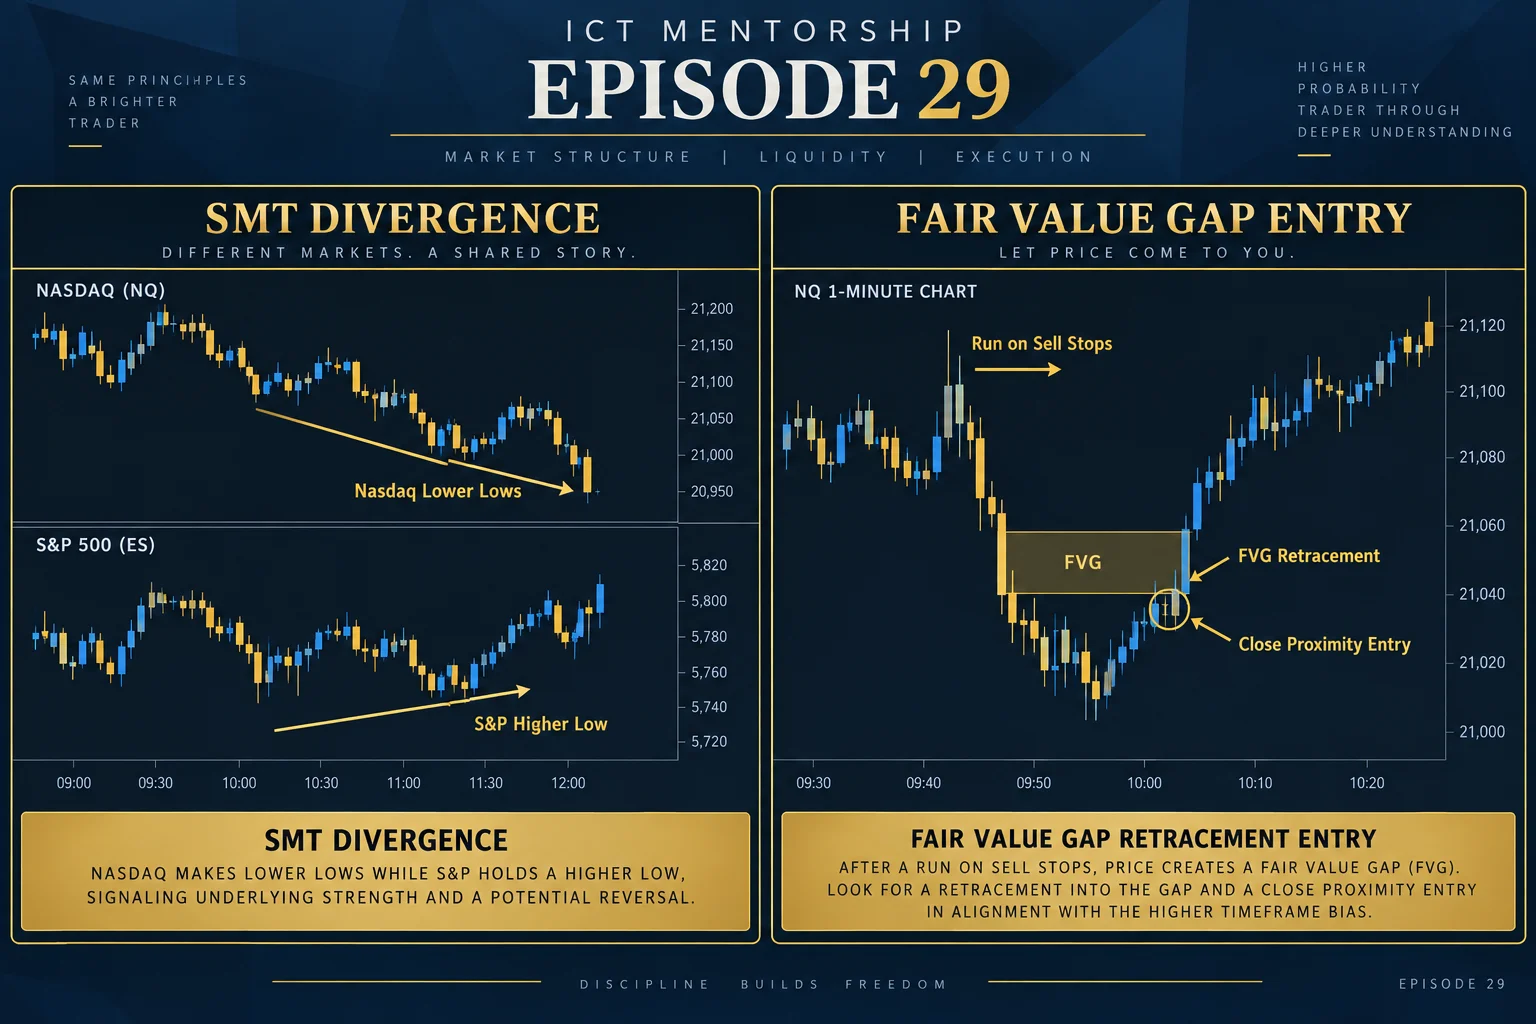
ICT then describes a run on sell stops, a rally and a retracement into a fair value gap. In his framework, the rally produces a short-term bullish market-structure shift, while the pullback offers a potential long-entry area.
The detailed entry discussion starts at 6:45. ICT says the S&P presented the cleaner structure, whereas Nasdaq looked less orderly. He reports using the S&P for the paper trade and later states that no executions occurred in Nasdaq.
Close Proximity Entry
A practical theme in the episode is what ICT calls a “close proximity entry.” He explains that chart-recording difficulties delayed him, so he did not enter precisely inside the preferred fair value gap. His position is that an entry near the modeled area may still be acceptable when the ideal level has been missed.
At 7:47, he identifies several one-minute candles that, in his reading, provided opportunities either within or close to the gap. He then describes adding after another bullish shift and a small subsequent gap.
The general educational lesson is not that proximity makes any late entry valid. Rather, the acceptable distance, invalidation point and resulting risk all need to remain consistent with the trader’s predefined model. The transcript supplies ICT’s retrospective explanation but does not establish a universally valid tolerance.
ICT Mentorship Paper Trading Limits
ICT is explicit at 2:09 that the session uses paper or demo trading. Later, around 13:07, he cautions viewers that they should not assume they can reproduce what he demonstrates or expect profitability.
Much of the closing discussion responds to criticism of earlier demonstrations and platform records. Those personal claims are not necessary to understand the trading lesson and cannot be independently resolved from captions alone. The source supports only that ICT presents the session as a live-data paper-trading demonstration and attributes the outcome to his reading of price action.
2022 ICT Mentorship Episode 29 Takeaways
- ICT separates a higher-level bullish bias from the lower-time-frame entry trigger.
- He uses relative behavior between Nasdaq and the S&P as SMT divergence supporting that bias.
- He rejects patterns that do not meet his displacement and fair-value-gap criteria.
- He allows an entry near, rather than exactly within, the preferred area when the broader setup remains intact.
- He characterizes the demonstration as paper trading and expressly avoids promising that viewers can replicate it.
This summary is educational commentary on ICT’s stated methods, not investment advice or a claim that the demonstrated concepts provide a proven trading edge.
Related Video
References
- ICT 2022 Mentorship Episode 29 (YouTube) — Primary video source for this article.
- TradingView — Charting platform used in the episode for analysis and paper trading demonstration.
- CME Group Equity Index Futures — Official specifications for E-mini S&P 500 (ES) and Micro E-mini Nasdaq-100 (MNQ) contracts referenced in the session.
- Fair Value Gap (Investopedia) — General reference for the FVG concept discussed in the episode; not affiliated with or endorsed by ICT.


