
Key takeaways
The Inner Circle Trader’s public YouTube recording reviews the June 28, 2022 morning session in the S&P E-mini and E-mini Nasdaq across fifteen-minute, five-minute, and one-minute charts.
Read the full summary
The Inner Circle Trader’s public YouTube recording reviews the June 28, 2022 morning session in the S&P E-mini and E-mini Nasdaq across fifteen-minute, five-minute, and one-minute charts. ICT identifies the S&P as the relative-strength leader because Nasdaq made a lower low while the S&P did not, creating an SMT divergence, then describes both contracts making a Judas swing at the nine thirty open that attacked the initial daily low and previous day’s low before rallying into a premium ahead of the ten o’clock news. After a heavy bearish candle and distribution toward relatively equal lows, his one-minute model is a short-term low broken with displacement, a fair value gap, a retracement into that gap, relatively equal lows as the first liquidity objective and partial, then another break lower, another gap, short reaccumulation, and rebalancing. He applies the sequence to Nasdaq as a rally into liquidity, displacement below a short-term low, retracement into the resulting fair value gap for the short, a first partial at sell-side liquidity, and further selling after rebalancing. The 257-second recording reports no prices, fills, position size, stops, costs, or verified results, relies on automatically generated captions, and should be treated as historical educational commentary rather than a tested system or investment advice.
How we researched this article
BestProps used document-based research from primary firm sources, checked September 25, 2026. The complete source list, scope, limitations, and commercial-state record appear near the end of this article.
In the Index Futures AM Session Review – 06/28/2022, published by The Inner Circle Trader, he calls it a quick little review and walks one morning across two screens: the S&P E-mini on the left, the E-mini Nasdaq on the right, both fifteen-minute (0:09 , 0:17), then down to five- and one-minute charts. The watch page lists it as public at 257 seconds, published 28 June 2022 at 09:04 PDT.
Every timestamp link here comes from the recording’s own automatically generated English caption track, which is not human-verified, so unclear wording is qualified rather than silently corrected. No chart is visible in that source: it can preserve what he says about his charts, but it cannot confirm that a level printed, that an objective was reached or that any described setup produced a fill. His statements stay attributed to him throughout.
ICT Index Futures Relative Strength and SMT Divergence
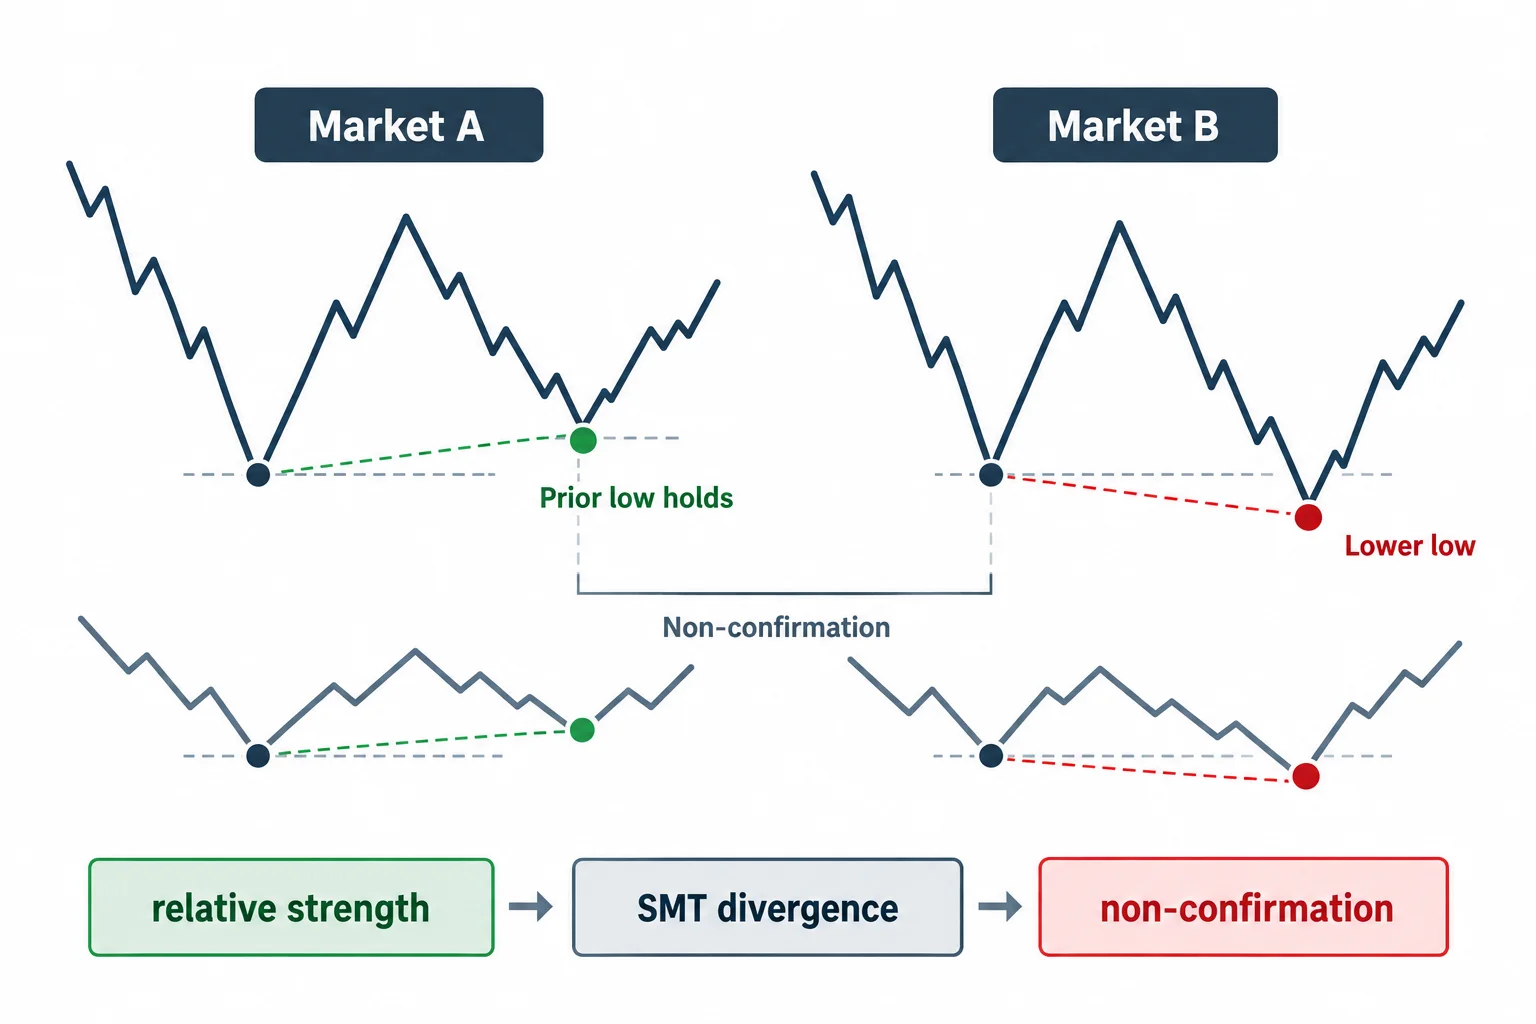
At 0:21 he calls the S&P the “relative strength leader this morning” because the Nasdaq had made a lower low that the S&P did not make (0:25 , 0:31), and he calls that disagreement an SMT divergence (0:34). In his framework related markets are read against each other so one can confirm or fail to confirm the other’s new high or low, and here the non-confirmation is what he reads as strength. He adds that this low was taken out (0:39) and that he had already described the sequence in short vignettes on his own social feed (0:43). It is a comparative observation rather than a standalone trigger, combined with the time of day and the lower-time-frame behaviour that follows.
ICT Index Futures Judas Swing and News Reaction
He says he was watching a rally toward buy-side liquidity while waiting for the 10 o’clock news to hit, and that the move came ahead of it (0:51 , 0:54 , 0:59); the captions are unclear at that point about exactly where he expected it to run. At 1:12 he points to an order block and the final portion of an imbalance the move reached (1:15), and he says both the S&P and the Nasdaq had what the captions render as a “Judas swing” at the 9:30 open (1:19): it broke down and attacked the lows he had marked, which he describes as the day’s initial low and the previous day’s low (1:23 , 1:27 , 1:30). In his usage the Judas swing is the initial, misleading move around an opening reference before the session he expects develops. He reports no order or fill at this stage.
ICT Index Futures Premium and Equal Lows
On a five-minute chart (1:35) he says the markets rallied and built in a premium to the 9:30 opening going into the 10 o’clock news (1:44 , 1:47), then points to one candle that broke down heavily (1:57) and reads what follows as more shorts accumulated and distribution down into relatively equal lows (2:02 , 2:05 , 2:11). His own qualification matters: he says the move might not be done, but by his read it had already travelled too far for the day to chase (2:15 , 2:18), and that he would look at what the afternoon session gave (2:24). That is a statement about where he considered the opportunity to have passed, not evidence that an entry would otherwise have been safe or profitable.
ICT Index Futures One-Minute Model
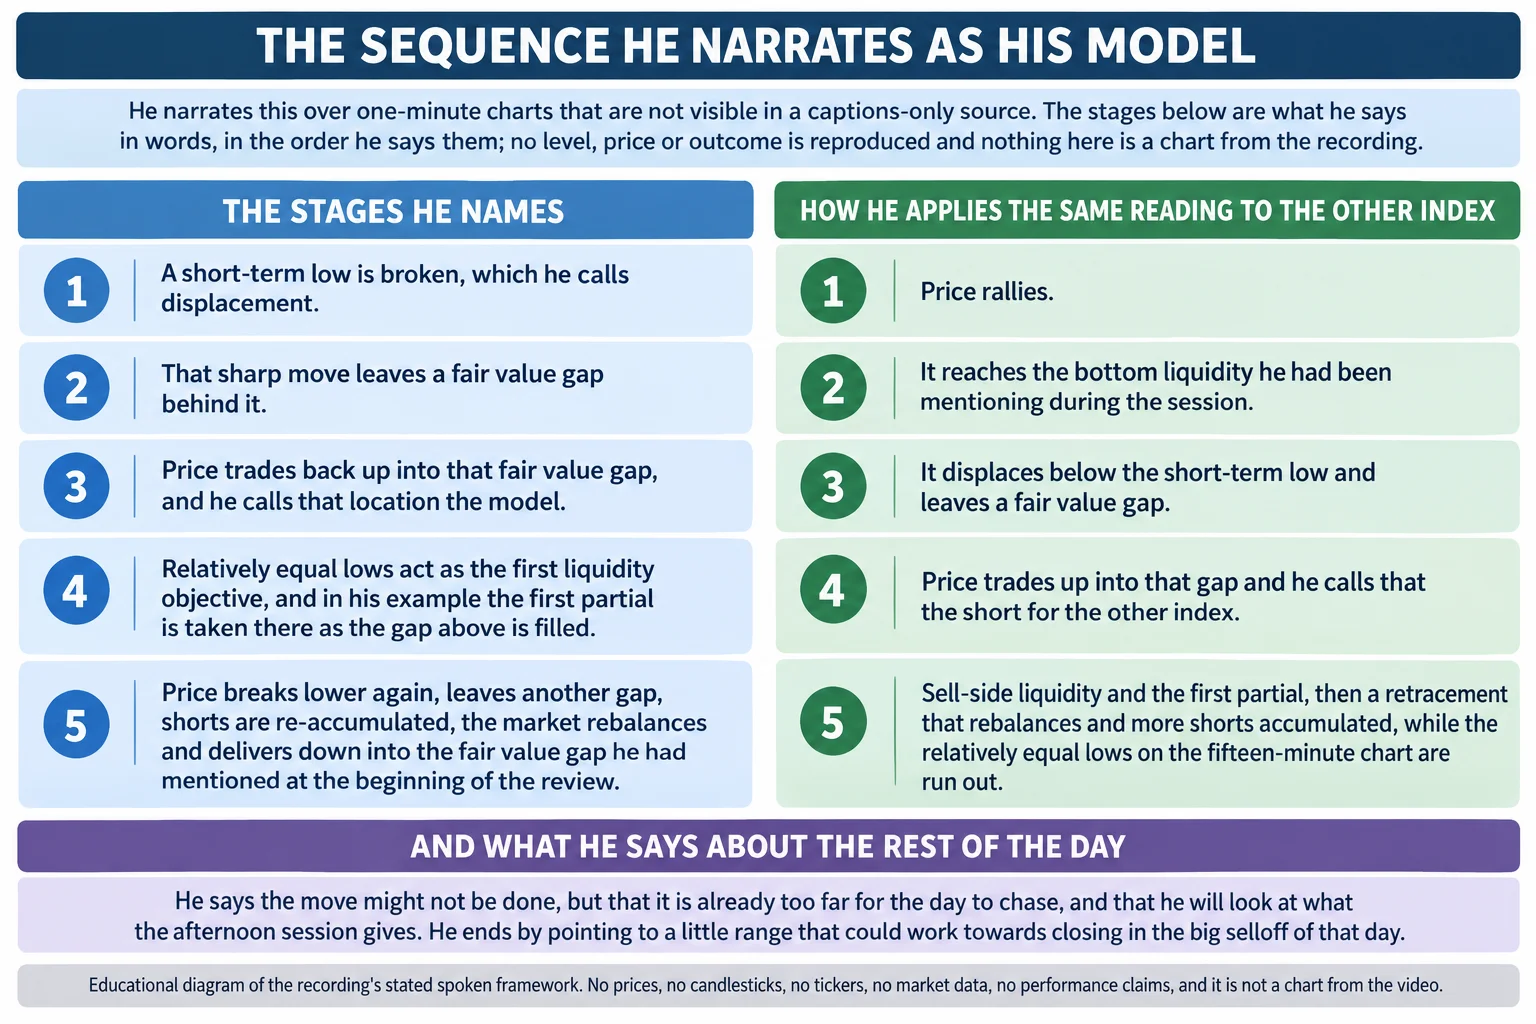
At 2:30 he switches to a one-minute chart and lays out the sequence he treats as his model: a short-term low broken with what he calls displacement (2:39); the fair value gap that move leaves; the trade back up into that gap, which he calls the model (2:43); relatively equal lows as the liquidity objective he takes a first partial against as the gap above is filled (2:48); then another break lower with a further gap and shorts re-accumulated before the market rebalances and delivers down into the fair value gap he had mentioned at the start (2:54 , 3:05 , 3:10). In his framework a fair value gap is a stretch of price delivery left inefficient that may attract a revisit, and relatively equal lows are a pool of resting orders beneath price. What the section describes is the order of operations, not one level.
ICT Index Futures Nasdaq Setup
At 3:22 he applies the same reading to the Nasdaq: price rallies into the bottom liquidity he had been mentioning during the session (3:24), displaces below the short-term low and leaves a fair value gap (3:28), then trades back up into that gap, which he calls the short for that market (3:31). He describes sell-side liquidity and a first partial (3:34), a retracement that rebalances and further shorts accumulated (3:37 , 3:40), and notes that the relatively equal lows on the fifteen-minute chart had since been run out (3:48). He signs off pointing to a little range there that he said could work toward closing in the day’s big selloff (4:03 , 4:07).
How to Read This ICT Futures Session Review
The teaching value is in how he folds several observations into one narrative: relative strength between two related contracts, a time-based opening move, a liquidity objective, bearish displacement and a retracement into an imbalance. Keep his interpretation separate from the evidence, though. The recording reports no fills, size, stop placement, costs or outcome, and it ends before the rest of that session is documented. It is best read as commentary on one historical morning and an explanation of terms (SMT divergence, Judas swing, displacement, fair value gap, relatively equal lows), not as a performance record, a tested system or a reason to copy the sequence.
Watch the ICT Index Futures Session Recording
Index Futures AM Session Review – 06/28/2022
The Inner Circle Trader · watch page lists publish 28 June 2022 09:04 PDT and a length of 257 seconds, about 4 minutes 17 seconds · public, not unlisted. This recording is the primary source for every timestamp link on this page.
The recording is not embedded here. An embedded player was tested directly on 16 September 2026 from a BestProps page origin, on desktop and mobile viewports: the frame loads and then reports “Playback on other websites has been disabled by the video owner”, with no playable stream and no duration reported. The link above opens the recording on YouTube itself.
ICT Index Futures Session Resources
The regulatory pages below are cited for background risk and disclosure language only: the CFTC advisory notes that hypothetical trading results are typically simulations over historical price data rather than real fills, and Investor.gov states that day trading is extremely risky and can result in substantial financial losses in a very short period. Neither evaluates this speaker, tests any concept named in the recording, or verifies a level or a result. Any ICT, smart-money or third-party indicator, script, note set or re-upload circulating outside the publishing channel’s own page is unofficial and untested here.
- [1] Index Futures AM Session Review – 06/28/2022 The Inner Circle Trader (primary source; watch page read 16 September 2026, published 28 June 2022 09:04 PDT, listed at 257 seconds).
- [2] The Inner Circle Trader (official YouTube channel) (read 16 September 2026), the publishing channel for the index-futures session reviews this recording belongs to.
- [3] U.S. Commodity Futures Trading Commission, Fraud Advisory: Commodity Trading Systems Sold on the Internet (read 16 September 2026), warns that hypothetical trading results are typically simulations using historical price data, the standard applied here to unverified trading claims.
- [4] U.S. Securities and Exchange Commission, Investor.gov, Day Trading (read 16 September 2026), the regulator’s plain-language warning that day trading is extremely risky and can result in substantial financial losses in a very short period. Background context only; it does not address this recording.
Primary source: ICT, “Index Futures AM Session Review – 06/28/2022”, The Inner Circle Trader; watch page publish 28 June 2022 09:04 PDT, listed at 257 seconds. The transcript used was the recording’s own automatically generated English caption track, not human-verified captions, so ambiguous wording is qualified rather than corrected silently. The recording’s charts are not reproduced anywhere on this page.
This commentary is for education only and is not investment advice. Futures trading involves substantial risk, and neither the recording nor this article establishes that any pattern, level or model will be profitable.
