
Key takeaways
In ICT Mentorship Core Content – Month 12 – Long Term Top Down Analysis, a fifty-four-minute lesson published 27 October 2022, ICT describes the monthly review he runs after each month closes and how he carries the result onto the weekly chart.
Read the full summary
In ICT Mentorship Core Content – Month 12 – Long Term Top Down Analysis, a fifty-four-minute lesson published 27 October 2022, ICT describes the monthly review he runs after each month closes and how he carries the result onto the weekly chart. He says he starts with the calendar rather than price, checking what the month or the coming month has tended to do (3:20); he then looks for a quarterly shift over the next three to four months (5:37); adds interest-rate differentials as context (6:40); classifies the market profile (8:41); compares related markets and recent highs and lows (23:19); and finally maps levels from what he calls the PD array matrix (32:18). The worked example is an end-of-May 2017 Australian dollar analysis (37:34). He reports that the following months supported the read; no entry, fill, risk figure or account result appears anywhere in the recording.
How we researched this article
BestProps used document-based research from primary firm sources, checked September 24, 2026. The complete source list, scope, limitations, and commercial-state record appear near the end of this article.
This is a transcript-grounded explanation of one speaker’s stated method. He calls it his personal approach rather than a general rule (1:34), and he cautions more than once that the individual concepts are strongest when used together rather than as isolated signals. The captions are the source for what he says and for every number below; the reviewer did not see the charts. The interest-rate figures and central-bank dates in the lesson are 2017 observations that were current when it was recorded, not current data.
What the monthly review is meant to produce
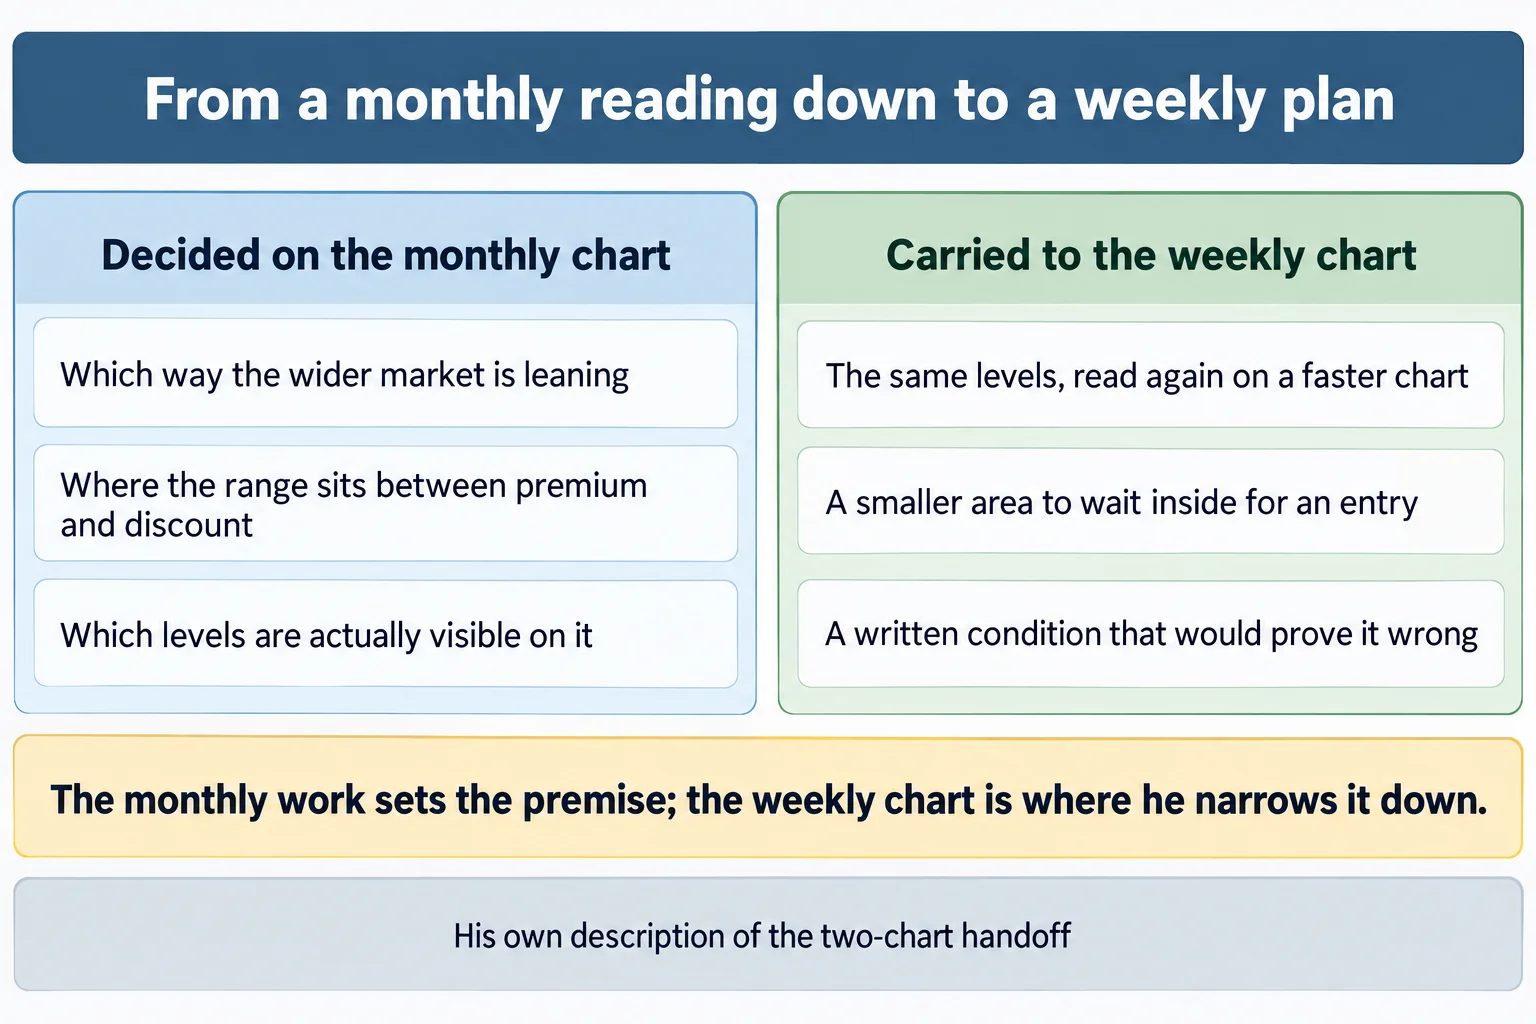
He frames the exercise as a review completed at the end of a month, with four objectives: assess how the monthly perspective might affect a given market, develop a higher-timeframe directional bias, classify what he calls PD arrays so they can identify focal levels, and repeat the analysis every month (2:53). The output is a bias, a set of price areas and an expectation to carry onto the weekly chart — not a forecast of an entire monthly candle. He acknowledges near the end that the read can be wrong and that his response is sometimes to wait for more information rather than force a conclusion (32:18).
The order he says he works in
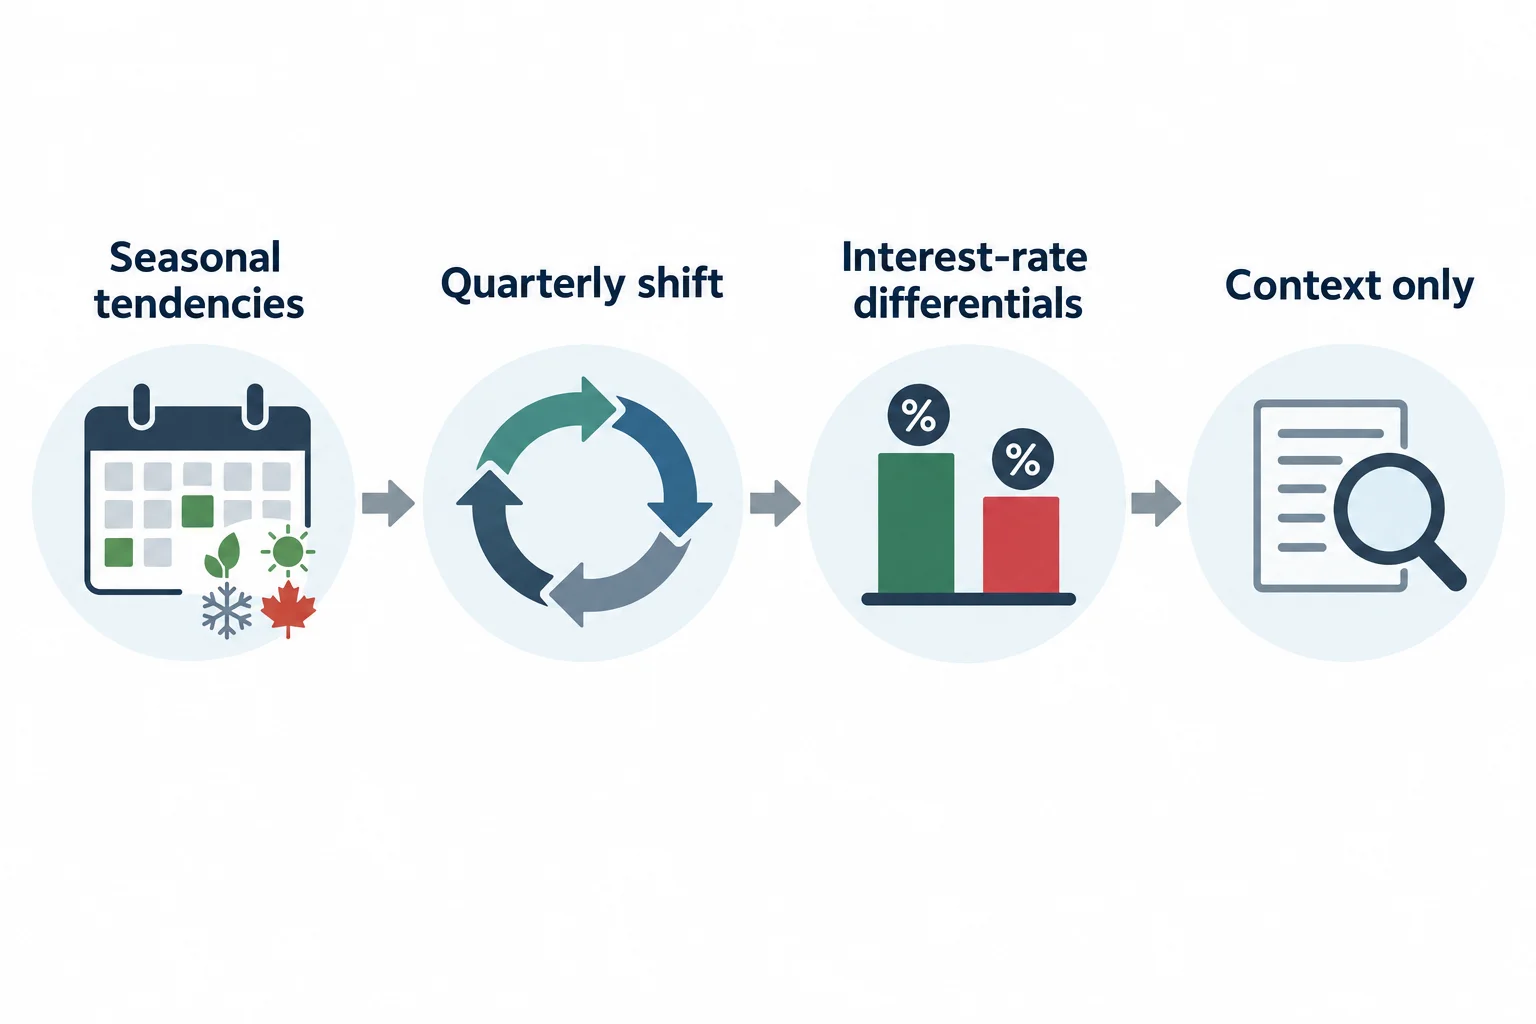
The first step is the calendar, not price. He reviews the seasonal tendencies he has taught for the month in progress and the month about to begin (3:20), and is careful about what that is worth: he says there is not a seasonal tendency for everything in every month, and calls the exercise “not a Panacea… not a be-all end-all,” useful mainly for planning which markets might move without even knowing where price is (17:48).
Second, he looks for a quarterly shift — how the market has been predisposed to behave over a three-to-four-month cycle — and asks whether the recent direction continues or turns. He is explicit that the duration is not rigid and that he will look back three or even four months for context (5:37 and 15:04). Third, he adds interest-rate differentials, comparing what two currencies pay and looking to pair the higher-yielding one with the lower-yielding one; he says he taught the mechanics earlier in 2017 and refers viewers to that material rather than repeating it (6:40).
Fourth comes the market profile. He asks whether the monthly is trending, consolidating, reversing or retracing, and says the answer changes what he looks for next: continuation in a trend rather than trying to call a top or bottom, evidence of a break in consolidation, or a price area from which the larger direction might resume in a retracement (8:41). He also describes how the nine-to-eighteen-month trend feeds this: if the longer trend is clear he prefers ideas aligned with it, and if it is unclear or consolidating he says his personal approach is to anticipate a reversal of the previous three or four months’ direction (18:39 and 20:21).
Fifth, he compares markets. He defines the current market structure by classifying recent highs and lows and then comparing them across positively and negatively correlated markets, looking for what he calls SMT divergence — his term for a disagreement between markets that normally track each other (23:19). Sixth and last, he locates what he calls the institutional focus points inside the PD array matrix, working within the scope of roughly the last nine to eighteen months (32:18).
Mapping the levels, and a caveat about terminology
Within the chosen range he separates premium from discount, draws equilibrium, and marks only the arrays that are actually visible on the chart. He is direct that not every range will contain all of them: “I give you the PD arrays; it doesn’t mean not every price range is going to have every single one of them… there’s only going to be a few sometimes.” His stated choices at that point are an order block, a rejection block, an old high or low, or a liquidity pool (49:40).
He also describes how he rounds levels. Using one of his own examples, a level he reads as 73.80 needs no adjustment because it already sits on a whole number, while 73.82 would be rounded to 73.85 on the reasoning that price is trading down into it (50:31). The point he makes of it is that the matrix narrows the options to a small set rather than leaving the chart ambiguous.
The Australian dollar example
The worked example starts at 37:34 and reconstructs a monthly Australian dollar analysis as of the end of May 2017 (37:34). He first states the seasonal tendency he is working with for that market — an expectation of higher prices into May, a summer low in the June–July window, a rally toward August and then weakness into October — and then blocks off the May month on the chart to project into June (37:53 and 38:48). He also brings the US Dollar Index onto a monthly chart for the inter-market comparison (44:22).
He then lines the inputs up against each other: the seasonal expectation of a higher June, a quarterly drift that had been running lower for the preceding months, and the rate differential as it stood before and after the central-bank change he dates to 14 June 2017 (42:35) (39:58 and 42:35). He compares the Australian dollar against the US Dollar Index for relative strength and reads the disagreement between their highs and lows as SMT divergence, then identifies a monthly area he calls a bullish order block, taken from the open of the lowest down-closed candle (47:35). He defines the range around that area, notes that price is below equilibrium and therefore in a discount array (51:06), and summarises the read as a bullish seasonal month, a quarterly shift in order and price sitting in consolidation expecting higher prices (51:43).
His conclusion is a monthly bullish premise, with buy stops above the consolidation as the objective and a run above the range highs as the expectation. He says the expectation was never for a single month but for several, and that June and July then delivered for anyone who was long the Australian dollar (52:39 and 52:47). That is his characterisation of a chart he is describing from memory of 2017. The transcript cannot confirm the levels, any entry, any fill, the position size, the risk taken or the result, and he presents no account figures anywhere in the lesson.
What this recording does not establish
- No verified result. There is no account, no fill detail and no realised profit or loss in the recording. The outcome of the example is narrated, and the reviewer could not check the chart it refers to.
- No independent levels. Every level and range described above is spoken by the speaker or marked on his own charts, which the reviewer did not see.
- No frequency data. The lesson gives no count of how often a seasonal tendency holds, how often a quarterly shift materialises, or how often the mapped arrays are respected.
- Dated macro figures. The rate differentials and central-bank dates are 2017 observations. He says himself that the macro inputs should be updated, and none of them describes present conditions.
- No standardised terminology. PD array, SMT divergence, order block, rejection block and liquidity pool are his own working labels, not universal classifications, and the captions garble some of them.
Watch the original recording
ICT Mentorship Core Content – Month 12 – Long Term Top Down Analysis
The Inner Circle Trader · uploaded 27 October 2022 · about 54 minutes. The lesson itself refers to an August 2017 mentorship session, so the recorded material is older than the upload. This is the primary source for this article; every timestamp link above points into it.
The video is not embedded here because playback on other websites has been disabled for it. That was checked directly on 15 September 2026 from a BestProps page origin: the embedded player loads and returns “Playback on other websites has been disabled by the video owner” instead of playing, at both desktop and mobile viewport sizes, so no empty player is left on this page.
Resources
These are the sources checked for this article. The publisher’s own channel and site are the first-party record of what ICT releases; the platform page explains the embedding restriction above; the regulator page is general material about trading systems marketed to the public. None of them assesses the speaker, verifies a level or a statement in the recording, or tests the framework described. Any ICT, smart-money or third-party indicator, script, note set or re-upload circulating outside the publisher’s own pages is unofficial and untested here.
- ICT Mentorship Core Content – Month 12 – Long Term Top Down Analysis — The Inner Circle Trader (primary source; watch page read 15 September 2026, 54m10s)
- The Inner Circle Trader — official YouTube channel (read 15 September 2026)
- The Inner Circle Trader — publisher’s own site and free library (read 15 September 2026)
- YouTube Help — Embed videos & playlists (read 15 September 2026) — platform guidance on embedded playback, relevant to the restriction noted above.
- CFTC — Fraud Advisory: Commodity Trading Systems Sold on the Internet (read 15 September 2026) — general guidance on how hypothetical or simulated trading results are presented to the public.
This is independent educational commentary on one speaker’s own teaching. It is not official ICT material, it is not a tested trading system and it is not investment advice. No trading result is reported from this recording because none is given in it. Leveraged trading carries substantial risk.

