
Key takeaways
In “ICT Mentorship Core Content – Month 11 – Bond Mega-Trades”, recorded in July 2017 as the final lesson of that month’s content, ICT sets out a conditional way of studying the large annual moves in 30-year Treasury bond futures.
Read the full summary
In “ICT Mentorship Core Content – Month 11 – Bond Mega-Trades”, recorded in July 2017 as the final lesson of that month’s content, ICT sets out a conditional way of studying the large annual moves in 30-year Treasury bond futures. The framework is: expect a tendency for the bond market to weaken early in the year and trade down into a seasonal low somewhere between May and June (0:48); look for higher-time-frame institutional order flow that argues for higher prices and for price trading in a discount (5:51); then scan the 5-year note, 10-year note and 30-year bond daily for what he calls interest-rate SMT divergence, one maturity failing to confirm a low the others made (6:26); and aim for the fall highs, while he states the rally may last only a month or two (6:47). He calls the seasonal low “a statistical Edge” that is “not 100” (4:46) and later says 2012 and 2013 were “dud years” with no bullish setup (35:36). The retrospective review from 2008 to 2017 uses assumed round-number entries and calculates contract movement with hindsight; it establishes no fills, costs, slippage, margin or realised result. Nothing here is investment advice.
How we researched this article
BestProps used document-based research from primary firm sources, checked September 24, 2026. The complete source list, scope, limitations, and commercial-state record appear near the end of this article.
The source for this article is the video’s own timestamped English captions. He opens by identifying the recording as the July 2017 mentorship content and the final lesson for that month (0:12).
The seasonal window he builds the year around
ICT describes the bond market as unusually regular: a “very repeating phenomenon that takes place every year” (0:41). His stated seasonal pattern is weakness from the start of the year down into a low that forms “sometime during may and or June every year” (0:57).
He then qualifies it before doing anything else with it. Because the May–June low can historically be seen does not mean “every single year is going to create a seasonal low for the bond market in May and or in June”; it means the period is one to be looking at (1:28). At 4:41 he puts a number on the same idea in his own terms: anticipating the seasonal low is “enough to give you a statistical Edge”, and an edge “is not 100 … it just means that … more times than not there’s usually a seasonal low forming between May and June”.
Two practical consequences follow in the recording. He says that if the seasonal low does not come to fruition in May and June, the follow-on business he plans to cover belongs in his August material rather than being forced into this window (9:48). And he frames the whole exercise as one setup to wait for every year rather than a reason to keep producing bond trades (27:01).
The four stages he reduces the model to
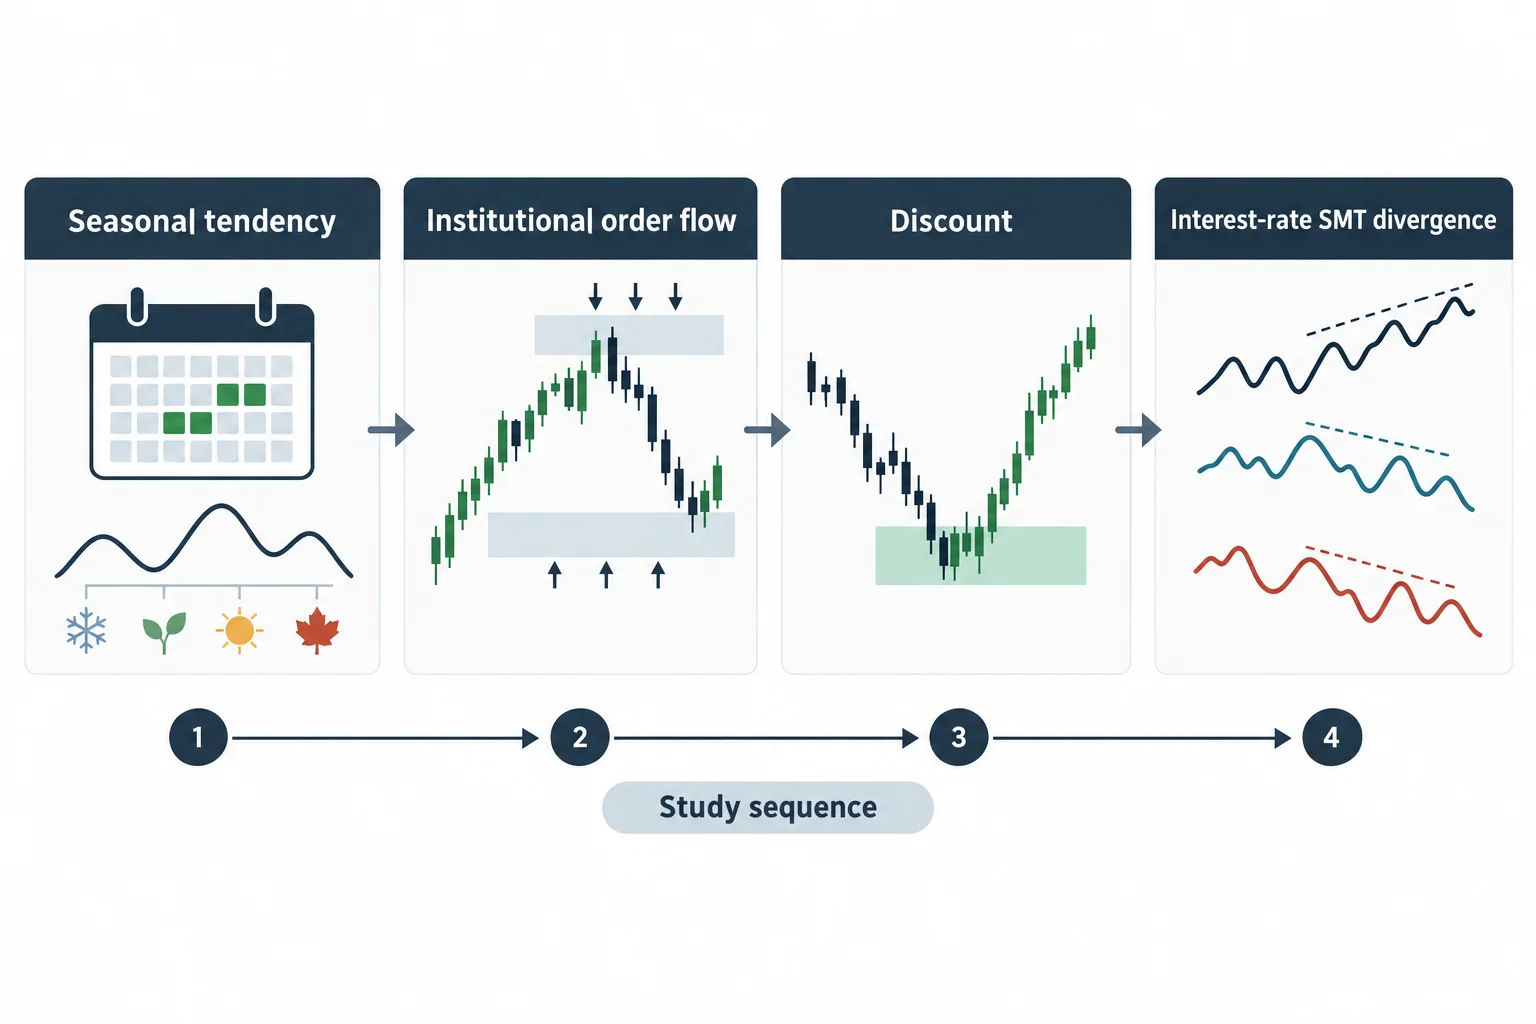
From 5:29 he simplifies the approach into a sequence, saying he is presenting it in the same fashion as the three preceding lessons. Stage one is the seasonal tendency in late spring or early summer — the May–June bond low (5:40). Stage two is identifying institutional order flow, and specifically waiting for “a higher time frame institutional PDA” — his term for a price-delivery array — while looking for signs that the higher time frame should be seeking higher prices (5:52). Stage three is the condition that “the market goes into a discount”, after which he says the stage is properly set (6:17). Stage four is the daily scan of the three maturities for interest-rate SMT divergence (6:24).
What he does not supply in this recording is the execution layer. Entry decisions “based on institution order flow and entry techniques” are, he says, covered elsewhere in the mentorship and spelled out in the August top-down analysis material (6:34). A reader following the model from this video alone has the conditions that qualify an idea but not the rules that place and size an order or set risk.
He also states the objective and its limits. The aim is “a move or duration that takes us into the fall months”, the fall highs (6:47). Immediately afterwards: “it does not mean that the bond market is going to Rally that long it just may rally a month or two” (6:56). The September–October period is what he waits for to anticipate intermediate-term highs (7:06).
What he means by interest-rate SMT divergence
He introduces the term at 3:48 and calls it “that little silver bullet you’re looking for for qualifying and confirming” the idea. His explanation of why it should appear is stated at 12:23: the three Treasury markets “have to move in concert with one another”, so if they diverge, “it just takes one that is your early warning sign”. He attributes the crack in the correlation to the size of institutional order flow, saying that when large participants step in they spread risk across short-, intermediate- and long-term maturities (12:34). That is his market interpretation, offered through an analogy about an elephant pressing its foot into mud; the recording contains no order-flow records, so who traded and why is not established by this source.
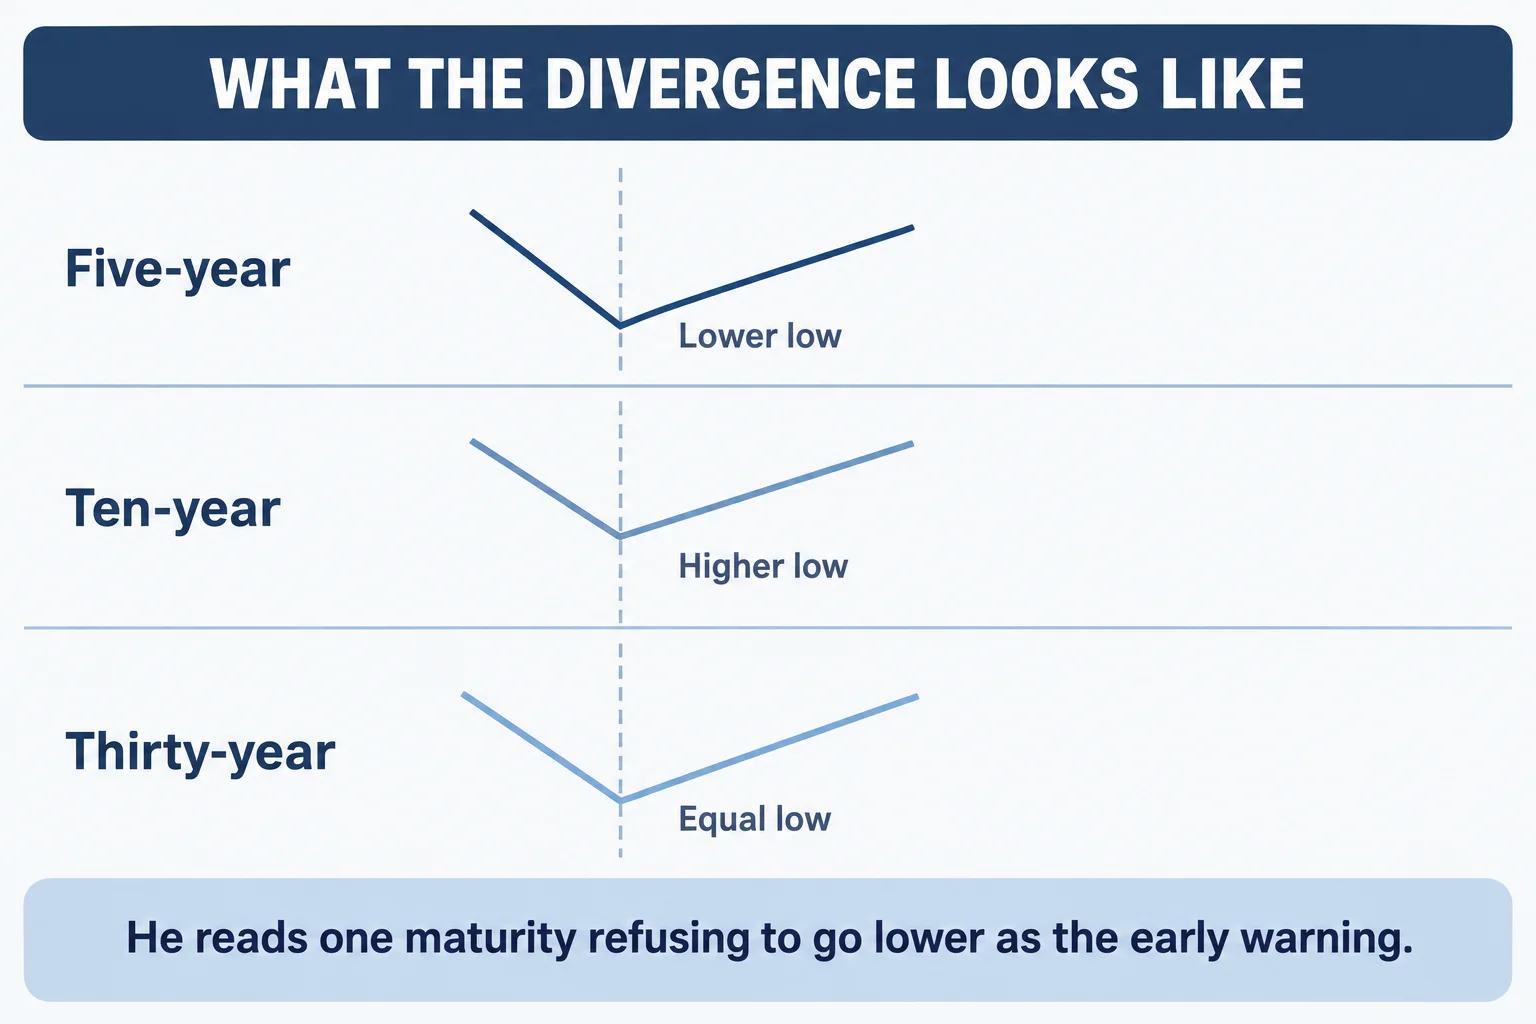
The clearest illustrated case is the pattern he walks through from 11:47 and repeats shortly after: the 5-year made a lower low, the 10-year made a higher low, and the 30-year made “almost equal lows” (11:57). He restates it instrument by instrument — the 5-year went lower, the 10-year diverged, the 30-year was “basically unchanged or equal low” — and calls that, in itself, SMT (14:00). Note the direction of the non-confirmation in that example: it is the 10-year refusing to follow the 5-year to a new low.
The 2008–2017 review, including the years it did not work
Most of the recording is a retrospective walk through yearly charts from 2008 to 2017 (14:46). The examples are presented as historical study: he picks round-number entries after the fact and counts the contract movement that followed. In the 2012 discussion, for instance, he says the 5-year made a lower low while the 10-year and the bond market made higher lows, comments that on that basis he would not need to drop to a lower time frame, and then assumes an entry at 148 with movement counted in thousand-dollar increments per contract (32:15). The transcript does not establish fills, commissions, slippage, margin requirements, risk taken or realised profit for any year, and the article does not report his counts as results.
The counterexamples are the most instructive part. He says 2012’s opportunity did not paint out the mega trade he wanted (34:01). For 2013 he reports that the May–June window produced a lower low that came “a little late”, going into July, in all three maturities, that bonds were in a downtrend with “absolutely zero Mega trade forming”, and that 2012 and 2013 were therefore “dud years” — while noting those years still offered the shorter September–October buying opportunities he looks for, just not the large annual move (34:19).
He applies the same honesty to 2011 and 2016. The 2011 signal he shows formed on 8 July rather than inside May or June, an example he uses to show the seasonal window “can be sometimes a little bit late” (27:23). In 2016 he describes a divergence with higher lows into June and assumes a 163 entry, then adds that the move “dies out in July and goes lower” and that the September–October–November period did not deliver the higher high — though he still counts the year as having paid (his label) in mega-trade terms (40:09).
The final case is 2017, the year the recording was made. He shows the 5-year and 10-year making higher lows in the May–June window while the 30-year bond made a lower low, calls the SMT divergence present, and assumes a 150 entry with about seven thousand dollars of contract movement counted (41:11). He then says the rest of the year had not yet been seen (42:11), and closes by declining to call that outcome a mega trade himself: “I’ll let you determine whether seven thousand dollars per contract is a mega trade. Personally I don’t believe it is. I’d like to see … about ten thousand dollars or more” to qualify (42:42). He also states plainly that he does not “have a crystal ball to tell you if it’s going to do it here or not” (42:35).
What the lesson is and is not useful for
The transferable content here is a study routine rather than a signal. A calendar tendency can define when it is worth paying attention. A higher-time-frame read can test whether the direction is supported. Comparing related instruments can test whether the move is confirmed or non-confirmed. An objective expressed as a window rather than a date, with an explicit statement that the move may end sooner, is a more honest way to hold an expectation than a fixed target.
Several things the framework does not provide are also worth stating. Seasonality is a tendency he describes, not a guarantee, and he says so twice. The examples are selected from a decade of hindsight and were not presented with a defined sample, so the frequency of failure is not measured in the recording; his own “dud years” comment is the closest it gets to a failure count. The entry and risk layer is explicitly deferred to other material. And the divergence evidence is chart reading, not order-flow data. Anyone studying the idea should test it on complete data with pre-defined rules, including the years that did not work.
He ends by encouraging the same exercise forward and backward: go back and look at earlier years than this, change the data on the intraday chart, and look for the divergence between the low’s formation and where the divergence appeared, adding that in his view “the Divergence is always there, it’s never missing” (43:20). That final claim is an assertion about his own chart selection. It is stated as his observation, is not tested in the recording, and a reader who repeats the exercise should expect to find the cases where it is not there as well.
Watch the original lesson
This article draws on the timestamped English captions of “ICT Mentorship Core Content – Month 11 – Bond Mega-Trades”, recorded for July 2017 and listed at about 44 minutes. Captions are a source for the speaker’s words; they cannot verify chart prices, fills or outcomes, and the reviewer read captions rather than watching the charts.
Watch the original lesson on YouTube
This lesson cannot be played inside another website. When its embedded player was opened and clicked on 15 September 2026, the player itself reported “Playback on other websites has been disabled by the video owner.” at both desktop and mobile widths, with no duration reported and no playback progress. That is why no embed is used here. The video is public on YouTube and plays normally on its own watch page.
Watch “ICT Mentorship Core Content – Month 11 – Bond Mega-Trades” on YouTube ↗
Resources
These are the sources checked for this article. The publisher’s own pages are the first-party record of what ICT releases; the Treasury and CFTC pages are neutral references for the instruments he discusses and for how marketed trading systems are described to the public. None of them assesses the speaker, verifies a chart level or a result in the recording, or tests the framework. Any ICT, smart-money or third-party indicator, note set, script or re-upload circulating outside the publisher’s own pages, and any indicator built on these concepts, is unofficial and untested here.
- [1] ICT Mentorship Core Content – Month 11 – Bond Mega-Trades — The Inner Circle Trader (primary source; watch page read 15 September 2026, listed at about 44 minutes)
- [2] The Inner Circle Trader — official YouTube channel (read 15 September 2026)
- [3] U.S. Department of the Treasury — Daily Treasury Par Yield Curve Rates (read 15 September 2026) — the official published yields for the maturities this lesson compares.
- [4] CFTC — Fraud Advisory: Commodity Trading Systems Sold on the Internet (read 15 September 2026) — background on how hypothetical or simulated results reach the public.
This is independent educational commentary on one speaker’s own retrospective review. It is not official ICT material, it is not a tested trading system and it is not investment advice. Every dollar figure appearing above is the speaker’s own hindsight arithmetic from an assumed entry, not an audited result. Leveraged futures trading carries substantial risk.
