
Key takeaways
ICT’s Commitment of Traders method starts from the CFTC weekly futures-only short-format report and calculates commercial net positioning as commercial longs minus commercial shorts — for the Japanese yen report displayed in the lesson, 143,450 longs minus 76,426 shorts for a 67,024 net-long reading — but treats neither net long nor net short as a…
Read the full summary
ICT’s Commitment of Traders method starts from the CFTC weekly futures-only short-format report and calculates commercial net positioning as commercial longs minus commercial shorts — for the Japanese yen report displayed in the lesson, 143,450 longs minus 76,426 shorts for a 67,024 net-long reading — but treats neither net long nor net short as a standalone trade signal. Above the zero line he calls the commercials’ position a longer-term buy program and below it a sell program, while movement inside rolling six- and 12-month high-low ranges of the net position is what he uses to look for shorter-term hedging in the opposite direction. He plots at least a year of data with commercials in red, large traders in green and small speculators in blue, then blends the zero-line regime, the localized ranges and his own institutional order-flow and premium/discount PD array readings. In his 2016–2017 Japanese yen example the commercial line sat below zero through price action he read as bullish, and he says shorter-term sell hedges remained possible after the line crossed above zero in the last week or so of November 2016. He adds that one-, two- and four-year extremes in the net position may deserve more weight than short-term hedging signals. The lesson is paper-trading material: it contains no tested edge, no entries, no risk limits and no verified performance.
How we researched this article
BestProps used document-based research from primary firm sources, checked September 24, 2026. The complete source list, scope, limitations, and commercial-state record appear near the end of this article.
In ICT Mentorship Core Content – Month 10 – Commitment Of Traders, ICT explains how he reads Commitment of Traders (COT) data for commodity and currency futures. He introduces the lesson as the first of the June 2017 ICT Mentorship commodity trading lessons (0:51) and warns at the outset that everything in the commodity segment should be viewed as paper trading, not an actual trade, and that he is not a CTA (0:20).
Two dates need keeping apart. The recording dates its own content to the June 2017 mentorship, and the data he reads is current as of 5 June 2017 (7:10); the YouTube upload recorded in the video’s own metadata is 16 October 2022, and the lesson runs about 34 minutes. Every calendar reference below therefore belongs to the 2016–2017 period the lesson discusses, not to the upload date.
The lesson uses Japanese yen futures as its working example and argues that a commercial net position should not be treated as a standalone buy or sell signal. The discussion is educational and reflects ICT’s own market framework; it does not establish that the method predicts prices or produces profitable trades. This article is built from the timestamped English captions of the recording, which are a record of the speaker’s words and not independent evidence for anything he reports about markets. A transcript also cannot show the chart details, order fills or later market outcomes.
How ICT uses Commitment of Traders data
He begins with the raw data. The COT report is a weekly release from the Commodity Futures Trading Commission, published at cftc.gov, and he works from the futures-only report in short format rather than the version that folds in options positions, which he says he never concerns himself with (1:01).
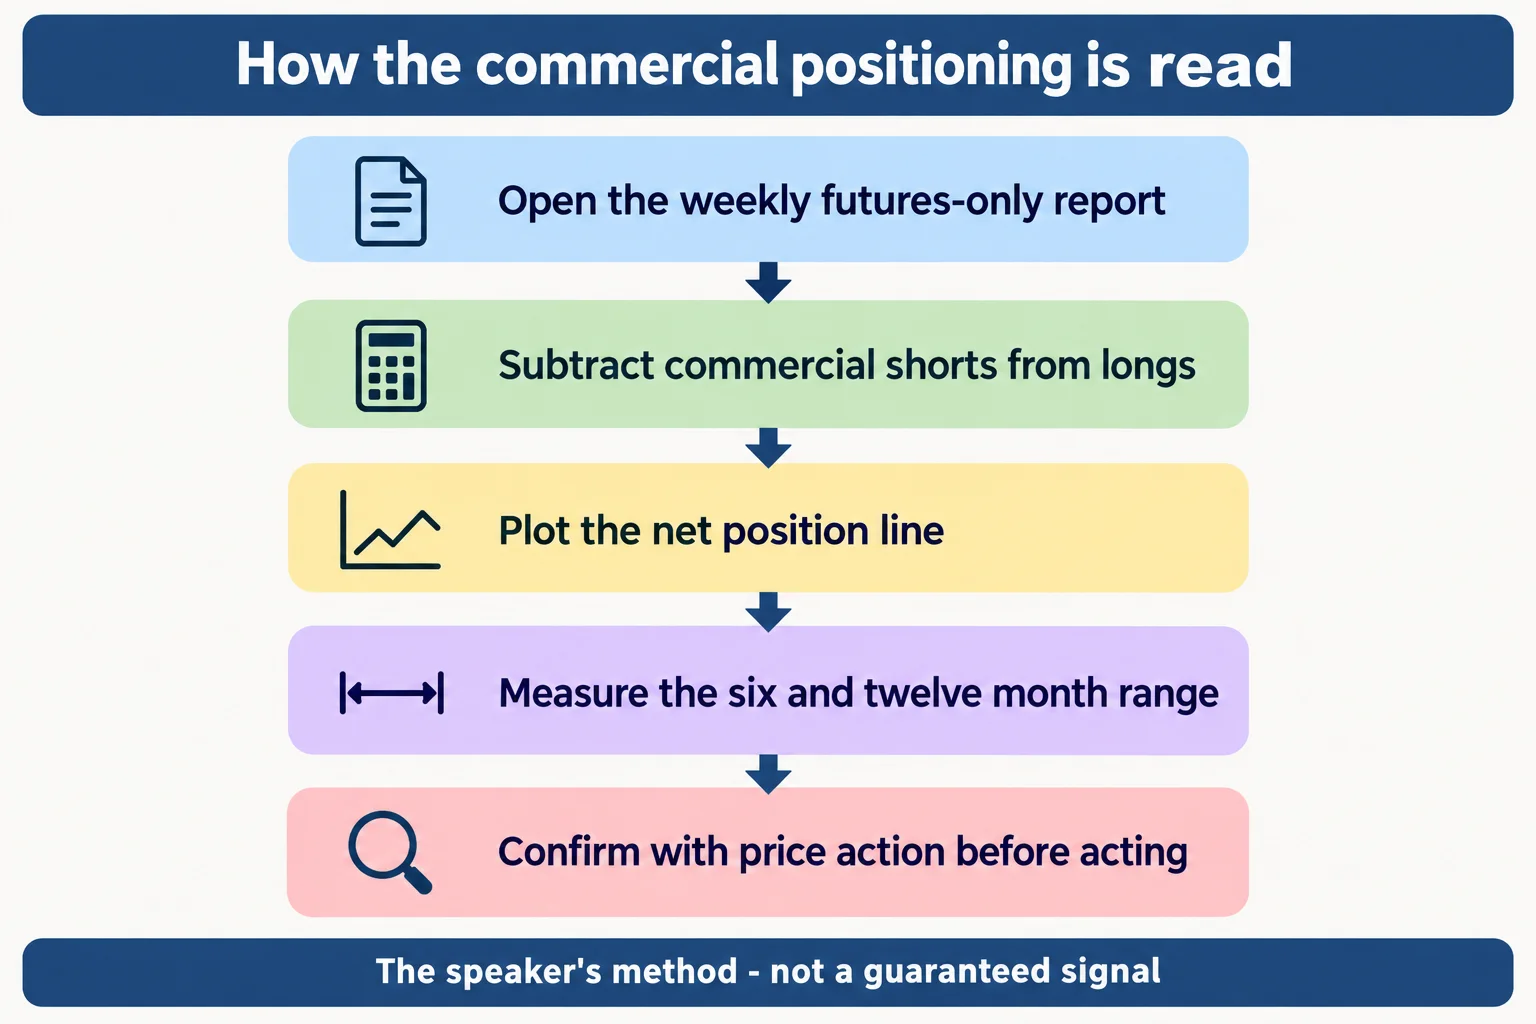
His calculation is deliberately simple:
- Locate the commercial long and short columns in the centre of the report.
- Subtract commercial shorts from commercial longs.
- Treat a positive difference as net long and a negative difference as net short.
For the Japanese yen futures report on screen he reads 143,450 commercial long contracts against 76,426 short, giving a net-long difference of 67,024 contracts (2:17). He then says that figure on its own “tells us nothing” about the current hedging program, which is the reason the rest of the lesson exists (2:56).
He explains why the commercials’ positions need that extra step. Their nature as participants is different from a retail speculator: they are typically large corporate producers or users of a commodity, and in currency markets they can be banks or lending institutions providing liquidity and managing exposure to a currency whose value “is going to be fluctuating all the time” (9:17). A cocoa consumer buying ahead of an expected price rise and a bank managing currency flows are both hedging a business need, so their net position need not resemble directional speculation by an individual trader.
What the commercial net position is meant to show
He describes how to plot the data: a daily chart of the contract with the net-trader-position line added in the indicator pane, showing at least a year of price action, and he names barchart.com as the site he uses for it (3:22). In that display the commercial line is red, the large traders’ line green and the small speculators’ line blue (3:45).
The zero line is his first layer:
- Above zero: the commercials are net long, which he calls a longer-term buy program.
- Below zero: the commercials are net short, which he calls a longer-term sell program.
He is explicit that this is a regime description and not a trigger. A net-long commercial line does not mean a trader should simply buy, and a net-short line does not automatically justify selling, because the commercials are hedging business exposure rather than expressing a directional opinion (7:41). He also discounts the other two lines: he says the large speculators are effectively the opposite side of the commercial position and the small speculators are the less-informed crowd, so his attention is on the commercial line (9:49). In the charts used later in the lesson he erases the other two lines with paint to make the commercial line easier to read, and says the exercise is not necessary once a viewer is used to the data (10:05).
Buy program versus hedging program
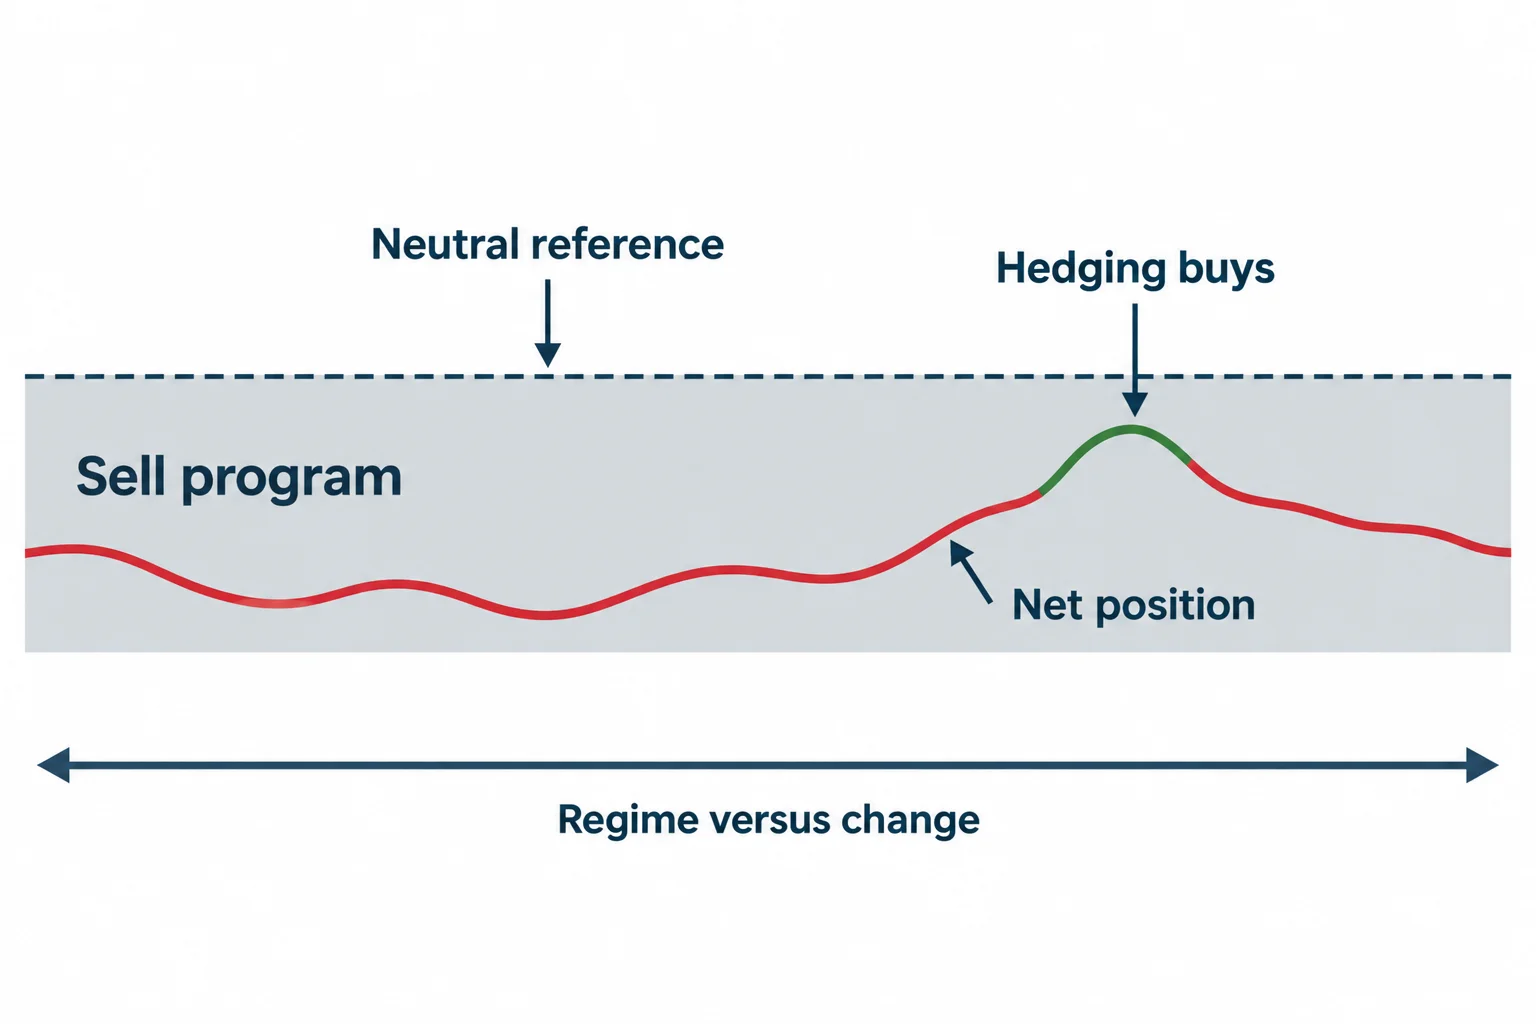
This is the central distinction of the lesson. The buy or sell program is the macro picture, taken from the sign of the net position; inside it, he says, there are hedging programs that run in the other direction (7:52). A larger long-term sell program can contain bullish hedging buys, and a long-term buy program can contain short-term sell hedges (19:07).
To locate those shorter-term changes he measures the highest and lowest commercial net readings over the last six months and the last 12 months, and treats that observed range as the frame rather than relying only on the absolute zero line (11:29). Once the range is defined, he looks for the points where the net position pushes beyond it — the moments he calls the hedging program kicking in (22:51).
The procedure he summarises near the end is:
- Establish whether the commercial net position is above or below the zero line, which gives the buy or sell program.
- Find the highest high and lowest low of that net position over the last six months and 12 months.
- Watch for movement inside that range for what he describes as smaller hedging programs, the buy and sell actions taken around specific price levels.
- Blend that reading with institutional order flow — whether price is respecting discount or premium PD arrays — before drawing a conclusion (31:57).
One capture problem is worth flagging honestly. The auto-generated captions repeatedly render a word as “nodules” in contexts such as “these green little nodules” and “nodules kicking in in January” (22:46). The intended word is not recoverable from the captions alone; what the passages support is that he is pointing to small localized turns in the net-position line, inside the defined range, marking the intervals where the hedging activity showed up. The captions also mangle a few other phrases, including “net Trader’s position line chart” for the net position line and “PD arrays” in one place; those are treated here as the concepts he describes, not as new terminology.
The 2016–2017 Japanese yen example
He walks through the Japanese yen from January 2016 to January 2017, dividing the year into the stretch before the 2017 new year and the stretch after it (13:38). For the first half of 2016 he reads the price action as bullish on his own order-flow terms: short-term lows were taken out and price rallied, down-closed candles were respected as bullish order blocks, and the premium arrays were broken through (14:40). The commercial line, by contrast, sat below zero from around January or February 2016 until the last or middle week of November 2016 (16:21) — which, read the conventional way, would have signalled short the whole way up. He uses that divergence to make his point about the traditional reading of the report.
He then shows what he does with it. Even while the commercial line stayed below zero for many months, he says you can still identify the points where the commercials stepped in and bought aggressively, pushing price higher without the net position crossing zero, and that is the filter he adds to the report (17:18). Conversely, and this is the part he revisits at the end, a commercial net position above zero does not prevent short-term selling: he says you can still see short-term sell hedges inside the larger buy program when the recent six- or 12-month range indicates the commercials are net short in the newly defined range (30:59).
He dates the switch itself to the last week or so of November 2016, when the commercial line moved from net short below the zero basis line to net long, and stayed above it afterwards (11:55). He then re-plots the post-November stretch, erases the speculator lines, and reads the six-month range to point out the intervals — January, mid-March and the last week of May — where he says the largest advances in price followed the hedging activity (25:47). This is his reading of charts on screen; the captions establish what he says about them, not that those chart readings are correct.
Near the close he adds a qualification about scale. If commercials reach a four-year, two-year or one-year extreme in the highest high or lowest low of their net positions, he says a long-term trend reversal is usually at play, and in that situation he will discount the short-term hedging signals (28:42). He credits the extremes-only approach to Larry Williams, whose 1970 commodity book he cites as his early influence on this data (4:22).
What the method does and does not establish
The useful part of the lesson is the distinction between the level of the commercial net position and the change in it. The zero line describes whether reported commercial longs exceed shorts at that moment; a rolling range describes where the current reading sits against its own recent history. Those are different observations, and neither explains why the participants hold the positions they hold. He says as much: he claims no knowledge of the commercials’ underlying fundamentals and says all he can do is see what they are doing graphically (28:03).
His own summary blends three inputs: the above- or below-zero program, the 12- and six-month range of the commercial net position, and his reading of institutional order flow (33:08). The first comes from a public weekly report that anyone can download. The other two are interpretive: order flow, order blocks and PD arrays are asserted inside his methodology rather than tested here, and he recommends watching the recording more than once because the two things happening at the same time — the long-term program and the hedging inside it — are easy to conflate (30:04).
Worth stating plainly for anyone considering the approach: COT reports are periodic positioning snapshots published with a lag, not real-time trade instructions. The method as taught here is a way of organising that data inside a discretionary chart framework. The lesson contains no tested rule, no sample of results, no entries, no position sizing and no risk limits, and it presents no evidence that trading this way is profitable. Futures and options are leveraged, and losses can exceed the amount committed. Nothing here is investment advice.
Watch the original lesson
This article was written from the timestamped English captions of the recording; the timestamp links above point to the passages being described.
Watch the original lesson on YouTube
The recording cannot be played inside another website. When its embedded player was loaded and clicked in a real browser on this article’s behalf on 15 September 2026, the player reported “Playback on other websites has been disabled by the video owner” and offered a “Watch on YouTube” prompt, with no duration loaded and no playback progress. No half-working embed is left here for that reason; the recording plays normally on YouTube itself.
Watch ICT Mentorship Core Content – Month 10 – Commitment Of Traders on YouTube ↗
Primary source and further reading
- The original Inner Circle Trader lesson: use the timestamp links in this article to compare each explanation with its source.
- CFTC — About the COT Reports: the official description of the report, including that it moved from monthly to weekly publication in 2000, which is the weekly release the lesson works from.
- CFTC — COT Explanatory Notes: the regulator’s definitions of the commercial and non-commercial categories and of the reportable and non-reportable positions, useful for checking what the columns on the report actually mean.
- CFTC — historical compressed COT data: the archive of past reports by year, which is the public data anyone would need to reconstruct the six- and 12-month ranges described here.
- CME Group — FX futures and options: the exchange whose Japanese yen contract the lesson uses as its example, and the venue whose contract specifications determine how the reportable positions are defined.
This is independent educational commentary. It is not official ICT material, not a tested trading system, and not a claim that any described reading produces results. The barchart.com charting site named in the lesson is a third-party service used for drawing the net-position line; this article did not test its data or its indicators, and nothing here should be read as an endorsement of them.
