
Key takeaways
BestProps independently summarizes The Inner Circle Trader’s live-feed paper-trading walkthrough of a bullish E-mini Nasdaq-100 futures liquidity run, where a bearish fair value gap qualifies as an inversion fair value gap after price closes above it and the New York midnight opening price serves as the expected liquidity draw and session bias reference.
Read the full summary
BestProps independently summarizes The Inner Circle Trader’s live-feed paper-trading walkthrough of a bullish E-mini Nasdaq-100 futures liquidity run, where a bearish fair value gap qualifies as an inversion fair value gap after price closes above it and the New York midnight opening price serves as the expected liquidity draw and session bias reference. ICT adds exposure on a return to the inversion fair value gap high, places protection relative to the setup candle low, and grades continuation through consequent encroachment at a wick midpoint, allowing probes below it but expecting candle bodies not to close and hold beneath it. Resistance includes stacked inversion fair value gaps, wick midpoints, the midnight open, an untested gap, and relatively equal overnight highs, so he rolls the stop, removes a large portion near the midnight open at 20 minutes 29 seconds, and places a stop on only part of the remainder at 22 minutes 42 seconds to reduce exposure while retaining participation toward higher highs. He prefers bullish imbalances to remain partly unfilled because he interprets the open portion as possible breakaway or measuring-gap behavior. The exercise uses a paper account, any cited dollar amount is hypothetical, contract counts are insufficient to reconstruct sizing, and the fills and the final outcome were not verified. ICT emphasizes anticipation at the live hard right edge rather than replay, predefined rules over ideal exits, and accepting that the remaining position may be stopped out. TradingView interval settings can change how wick, overlap, and displacement conditions appear, while CME Group’s NQ specifications determine how structural invalidation translates into account risk but provide no directional evidence.
How we researched this article
BestProps used document-based research from primary firm sources, checked September 24, 2026. The complete source list, scope, limitations, and commercial-state record appear near the end of this article.
Navigating High Resistance Liquidity Run Conditions, credited to The Inner Circle Trader and inventoried with an upload date of 2026-08-10, is a single live-session walkthrough rather than a definition lesson. ICT narrates a bullish paper-trading exercise in an index futures market while price pushes into a crowded area, and the recording’s central subject is what he does with the idea once the path stops looking clear. The narration begins at 0:04 and the useful material is the decision sequence, not an unseen outcome.
This page is independent educational commentary. It summarises the recording’s spoken content, attributes its interpretations to the speaker, and does not present the demonstrated exercise as a recommendation, a verified result, or a measured edge.
ICT Liquidity Run Thesis and Midnight Draw
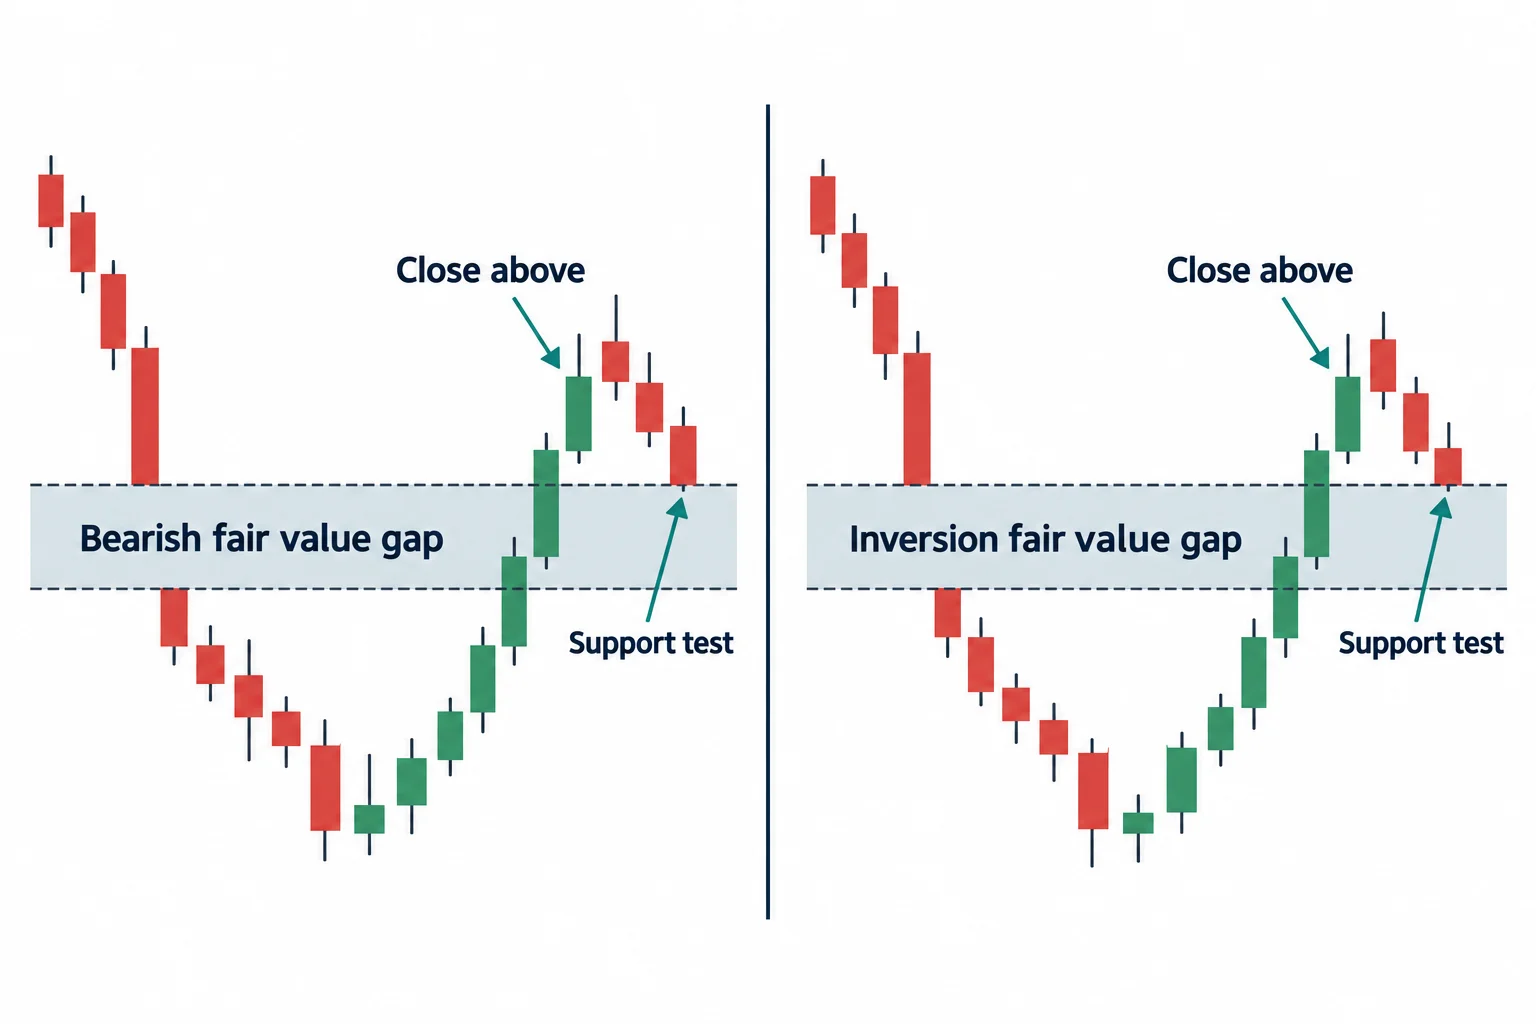
ICT opens by describing a long position taken up to a stated initial size, with a protective stop placed relative to the low of the candlestick associated with the setup (0:04 to 0:25). He says he will add exposure if price returns to kiss the high of what he calls an inversion fair value gap, and names the New York midnight opening price as his expected draw on liquidity (0:42).
He later restates the sequence as a qualification process. In his terminology a bearish fair value gap becomes an inversion fair value gap once price closes back above it, and he points out where the area was qualified and confirmed before he used it as an entry reference, describing two occasions on which it did so (11:24 to 12:42).
The level he watches most closely inside the setup is the midpoint of a chosen candle wick, which he calls consequent encroachment. His stated expectation is that a wick may probe below that midpoint but that bodies should not close and hold beneath it, and that the current or next candle should show prompt willingness to move higher. He spells this out at 1:23 and repeats it on a higher reference at 3:33.
High Resistance in the ICT Liquidity Run
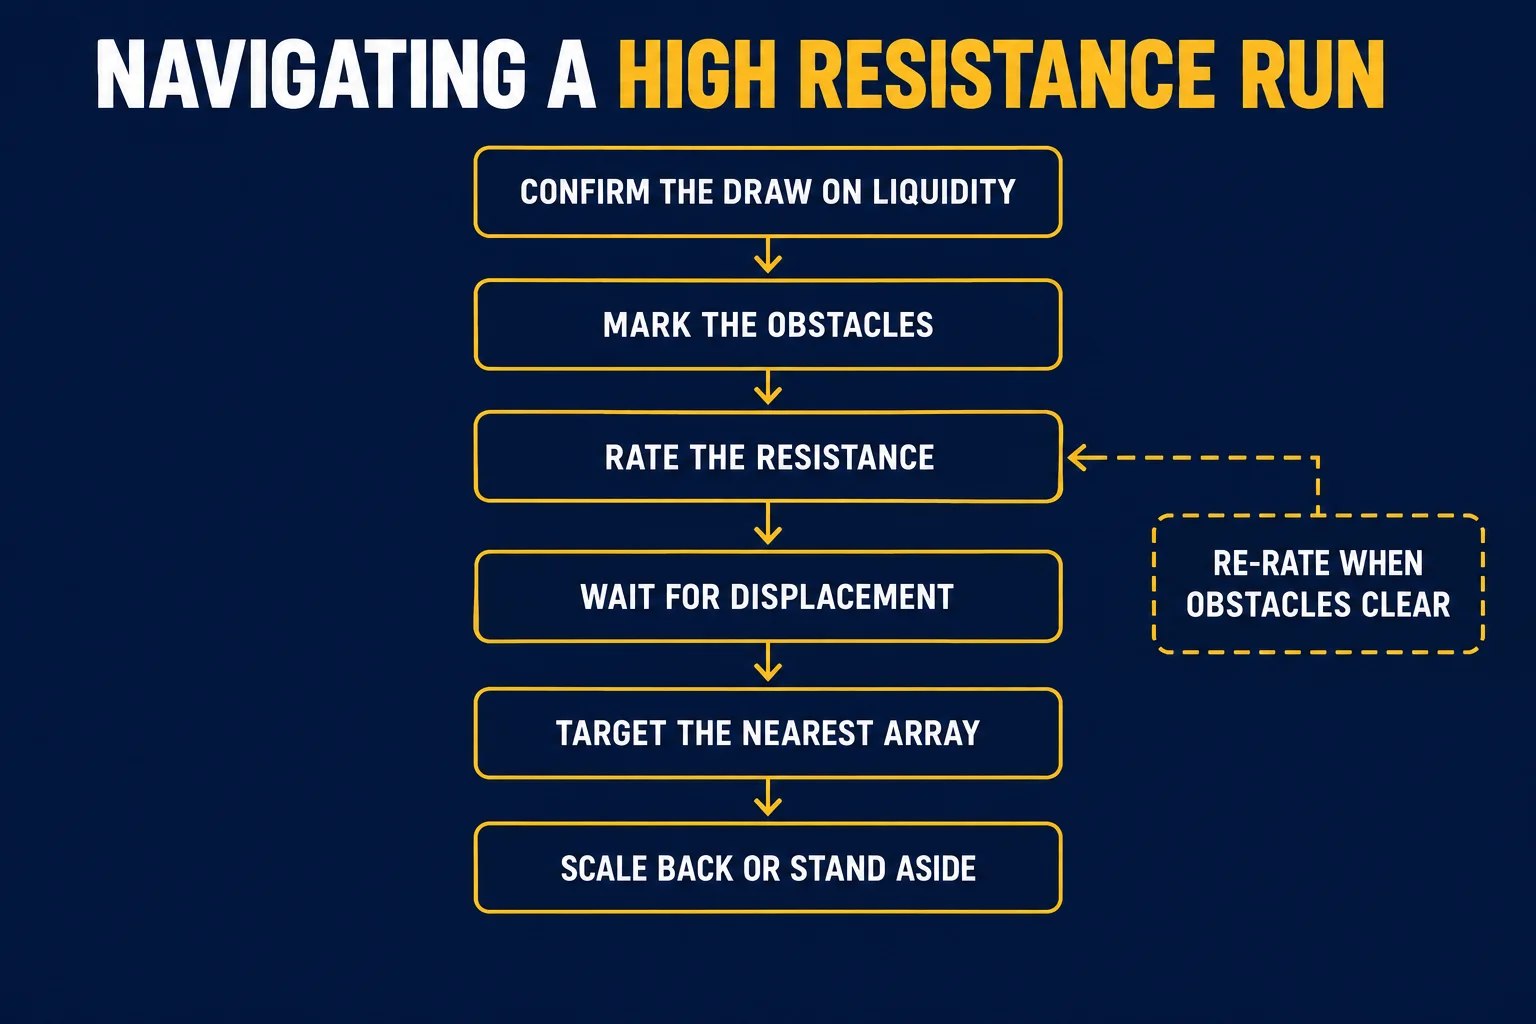
The directional idea stays bullish, but the route to the stated objective is not presented as open. ICT identifies several overlapping references sitting between price and higher liquidity: the New York midnight opening price, earlier inversion fair value gaps, wick midpoints he is grading, and overnight swing highs that he describes as relatively equal. Around 15:32 he tells viewers the price action may get messy in that zone, with two potential inversion fair value gaps stacked against a stronger gap and an untested gap.
He treats the midnight opening price as something more than a line: at 11:06 he calls it a magnet-style draw on liquidity and a session-level bias reference, and at 22:21 he notes that it is so far offering substantial initial resistance, with price spending time north of it before moving lower. Instead of treating that as immediate invalidation, he lists the candle-reference checks he is balancing: the remaining portion of a bullish fair value gap, the midpoint of a relevant wick, the opening price of a candle used in his analysis, the swing low supporting the setup, and the midnight opening price itself.
Managing High Resistance Liquidity Run Positions
The recorded response to resistance is to reduce exposure rather than insist on the furthest objective. ICT describes rolling his stop as price advanced and taking a partial near the midnight opening price, saying at 20:29 that he had taken a large portion of the position off there and kept the remainder open for higher relative equal highs.
When price begins to struggle, he demonstrates a narrower technique at 22:42: placing a stop order on only part of the remaining position so that a move below the selected low reduces exposure without closing everything. He frames this as price-based and psychological at once, saying the reduction lessens the need to be right and leaves some participation if the original idea resumes. At 24:46 he argues that traders cannot expect the ideal exit on every position and should instead work from predefined rules, protocols and procedures.
Two disclosures matter when reading the narration. First, he states at 6:18 that he is teaching through a paper-trading account rather than placing live orders. Second, the dollar figure he attaches to the partial is described by him as hypothetical (20:54). Neither the account type nor the amount is evidence of a realised result, and contract counts in the narration are not consistent enough to reconstruct a size ledger.
ICT Liquidity Run Portion Left Open Signal
One recurring observation in the recording concerns imbalance that is only partly filled. ICT says he would be pleased to see part of a gap or imbalance stay open while price is bullish, and argues that a fully filled gap makes it harder for price to prove it wants to continue higher (10:03 to 10:35). He applies the same reasoning to a buy-side imbalance later, saying that if a portion is left untraded the gap can act like a breakaway or measuring gap relative to where the run began (13:45 to 14:12). This is his interpretation of what he is watching, not a measured test of gap-fill behaviour.
Navigating Liquidity Run Conditions With Anticipation
ICT repeatedly contrasts his approach with reactive trading and with market replay. He argues that predicting is the work, that retail traders are trained to react, and that his aim is to anticipate (18:56 to 19:23). He also stresses that the demonstration is on a live price feed at the hard right edge rather than replay, arguing that a replay setting hands the trader knowledge of what already happened (8:46 to 9:16). At 25:06 he makes the same point about the partial reduction: he says he anticipated that price could move below a nearby low and arranged the reduction in advance, which he presents as the reason the move did not produce a panicked response.
Checking ICT Liquidity Run Conditions and Claims
The statements above are drawn from the recording’s spoken narration. A reader can verify the sequence, the terminology and the position-management commentary by listening to the timestamped passages linked on this page. What the transcript cannot establish is how the chart actually looked at each reference, whether the narrated orders would have filled as described, the exact final size at each step, or how the exercise ended after the recording stops. Any chart appearance in the recording was not visually verified for this page.
The narrative also should not be read as proof that the concepts shown carry a reliable trading edge. The generalisable part of the lesson is process, not the specific levels: define a directional idea and a plausible liquidity objective, anchor it to stated price references, write down which candle behaviour supports continuation, write down which close or level would weaken the thesis, and decide in advance whether exposure will be reduced when resistance appears rather than relying on a single all-or-nothing exit. A valid process can still end with the remaining position stopped out, which is exactly what ICT allows for in the recording.
ICT Navigating High Resistance Liquidity Run Conditions Video
The mapped source for this article is Navigating High Resistance Liquidity Run Conditions on the channel The Inner Circle Trader. This BestProps page is independent educational commentary written from the recording’s automatically generated transcript: it is not a transcript reproduction, not an official ICT lesson, and not an endorsement of the setup or of any level named in it.
Watch the original lesson on YouTube
Playable in-page embedding could not be established for this upload, so no player is embedded here and no embed frame is left blank. An embedding check on 2026-09-13 returned a YouTube player configuration error (Error 153), and an earlier check the same day returned “Playback on other websites has been disabled by the video owner.” Either message means the same thing for this page: the lesson is watched directly on YouTube rather than inside BestProps.
Watch Navigating High Resistance Liquidity Run Conditions on YouTube ↗
High Resistance Liquidity Run Sources and Account Rules
Four references support this article: the source recording itself, this site’s drawdown comparison page, a platform help page on chart intervals, and the exchange product page for the futures market named in the transcript.
Check the ICT Recording and Transcript Source
The mapped upload Navigating High Resistance Liquidity Run Conditions was read for this article through an automatic speech-recognition transcript of the full original audio (whisper-large-v3-turbo), not through YouTube captions.[1] The transcript covers the complete downloaded audio and its own quality check reports no low-confidence segments, but its wording and numbers are machine-generated and its timestamps are automated, so specialised terms and any named prices should be checked against the audio before being quoted. No visual chart verification was performed, and the narrated session date is not established by the upload date.
Separate Liquidity Resistance From Account Limits
The BestProps page Prop Firm Drawdown Rules Explained compares static, trailing, intraday, end-of-day, daily and balance-based drawdown calculations across named programs and links the provider documents it used. Read its own disclosure: its stated sources were checked on August 1, 2026 and the page labels itself stale and asks readers to recheck before relying on it; it also states that drawdown methods vary by firm, program, stage, account size and platform, and that the page reports no first-hand account purchase, trading or payout testing.[2] A high-resistance route does not change those limits: a slower path means more exposure to the daily loss, trailing and consistency terms your provider currently documents, so confirm them on your own dashboard.
Check How Platform Bars Affect ICT Conditions
The TradingView help page Time intervals: a quick introduction and tips explains that an interval sets the amount of time or trading activity each bar covers and that intervals relate to the instrument’s trading hours, with separate sections on choosing and customising an interval.[3] That matters when grading candle behaviour of the kind ICT describes: wick midpoints, overlap and displacement all read differently depending on the interval and the session schedule behind it. The page documents the platform, not ICT methodology or anyone’s record.
Use Exchange Data for Liquidity Run Contracts
The CME Group product page E-mini Nasdaq-100 Overview describes the NQ contract’s multiplier and minimum tick and states that access is close to 24 hours.[4] Tick size and contract multiplier are what translate a structural invalidation into account risk; they are not evidence about where price will go. Specifications, margins and hours can change, so confirm them on the exchange page before sizing anything.
ICT Liquidity Run Sources
- [1] YouTube: Navigating High Resistance Liquidity Run Conditions – The Inner Circle Trader (source recording; read via automatic speech-recognition transcript of the full audio, transcript generated 2026-09-13)
- [2] BestProps: Prop Firm Drawdown Rules Explained (document-based comparison; page states sources checked 2026-08-01 and labels itself stale)
- [3] TradingView Help: Time intervals – a quick introduction and tips (platform documentation for chart intervals and trading hours)
- [4] CME Group: E-mini Nasdaq-100 Overview (exchange product page for NQ contract size, tick and hours)
BestProps is not affiliated with The Inner Circle Trader, TradingView or CME Group, and no source listed here endorses this article, this site or any setup. Draw on liquidity, liquidity run, liquidity sweep, order block, fair value gap, inversion fair value gap, consequent encroachment, imbalance, displacement, premium and discount are used on this page only as descriptive study terms. The recording narrates a paper-trading exercise, and a hypothetical dollar figure mentioned in it is reported as hypothetical rather than as a payout. Nothing here demonstrates a tested, repeatable or profitable result, and no claim is made that any level, array or sequence repaints less, predicts price or was verified on a live funded account.
Educational commentary only. This page describes one recording’s narration and does not provide individualised financial advice or promise trading results. Trading futures involves substantial risk of loss, and past or hypothetical performance does not indicate future results. Verify current prop-firm rules directly with the firm before trading.