
Key takeaways
ICT Charter Price Action Model 9, One Shot One Kill, is a short-term teaching framework for capturing one substantial portion of a weekly range by forming a weekly or monthly directional hypothesis, refining it on daily, four-hour and one-hour charts, and concentrating on Monday through Wednesday for a possible weekly high or low.
Read the full summary
ICT Charter Price Action Model 9, One Shot One Kill, is a short-term teaching framework for capturing one substantial portion of a weekly range by forming a weekly or monthly directional hypothesis, refining it on daily, four-hour and one-hour charts, and concentrating on Monday through Wednesday for a possible weekly high or low. The model pairs internal range liquidity such as fair value gaps, liquidity voids and order blocks with external range liquidity such as stops beyond equal highs or equal lows, assessing internal origins for moves toward external liquidity and external sweeps for returns toward internal references. ICT cites a 50–75 pip teaching objective but does not claim it occurs every week, and he acknowledges wrong directional calls, losses and unsuccessful setups. Lower-timeframe scalping and day-trading models guide stop adjustments and profit-taking only when their own objectives are reached, while premature break-even moves may interrupt the weekly thesis. Model 8 or later scalping models can provide contingency entries when the ideal Model 9 setup is missed. Buy-side imbalance and sell-side inefficiency describe the same rapid upward delivery, sell-side imbalance corresponds to buy-side inefficiency, and the midpoint of a fair value gap is called consequent encroachment. The framework lacks controlled testing, complete execution records or verified evidence of consistent profitability and should be treated as educational chart-study vocabulary rather than investment advice.
How we researched this article
BestProps used document-based research from primary firm sources, checked September 24, 2026. The complete source list, scope, limitations, and commercial-state record appear near the end of this article.
In ICT Charter Price Action Model 9 – One Shot One Kill, ICT presents a short-term model intended to frame one substantial portion of a weekly range rather than repeatedly trade every intraday fluctuation. The lesson combines weekly directional analysis, early-week timing, liquidity classifications and lower-timeframe trade management.
“One Shot One Kill” is a descriptive name, not a promise of a single perfect trade. From 0:37 ICT says it is not his goal to teach viewers to expect the outcome every single week, and he states plainly that there will be losses. The transcript documents ICT’s interpretation of price action; it does not independently establish the model’s accuracy or profitability.
ICT Model 9 Weekly Price Action Framework
ICT begins by defining the setting as a weekly range expansion. His process starts with weekly analysis to form an opinion about whether price is more likely to expand upward or downward, and he notes at 1:56 that monthly charts can assist with the same question. That higher-timeframe opinion then supplies the intended direction for analysis on the daily, four-hour and one-hour charts.
He stresses that not every day must move in the weekly direction. At 4:31 he says Monday, Tuesday and Wednesday are when a weekly high or low is expected to form, and at 7:18 he explains this is why the model deliberately limits its focus to those three days. This differs from Model 8, which he describes at 4:36 as not requiring a hunt for the weekly extreme.
At 20:23 ICT describes the practical ambition of the model: get as close as possible to the weekly high or low and be content with capturing a large part of the expected weekly range. At 20:40 he states the objective as 50 to 75 pips, after having said near the start of the lesson that this is a per-week figure he is working toward on a consistent basis. That number is part of his teaching example, not a verified performance result.
ICT Model 9 Internal and External Price Liquidity
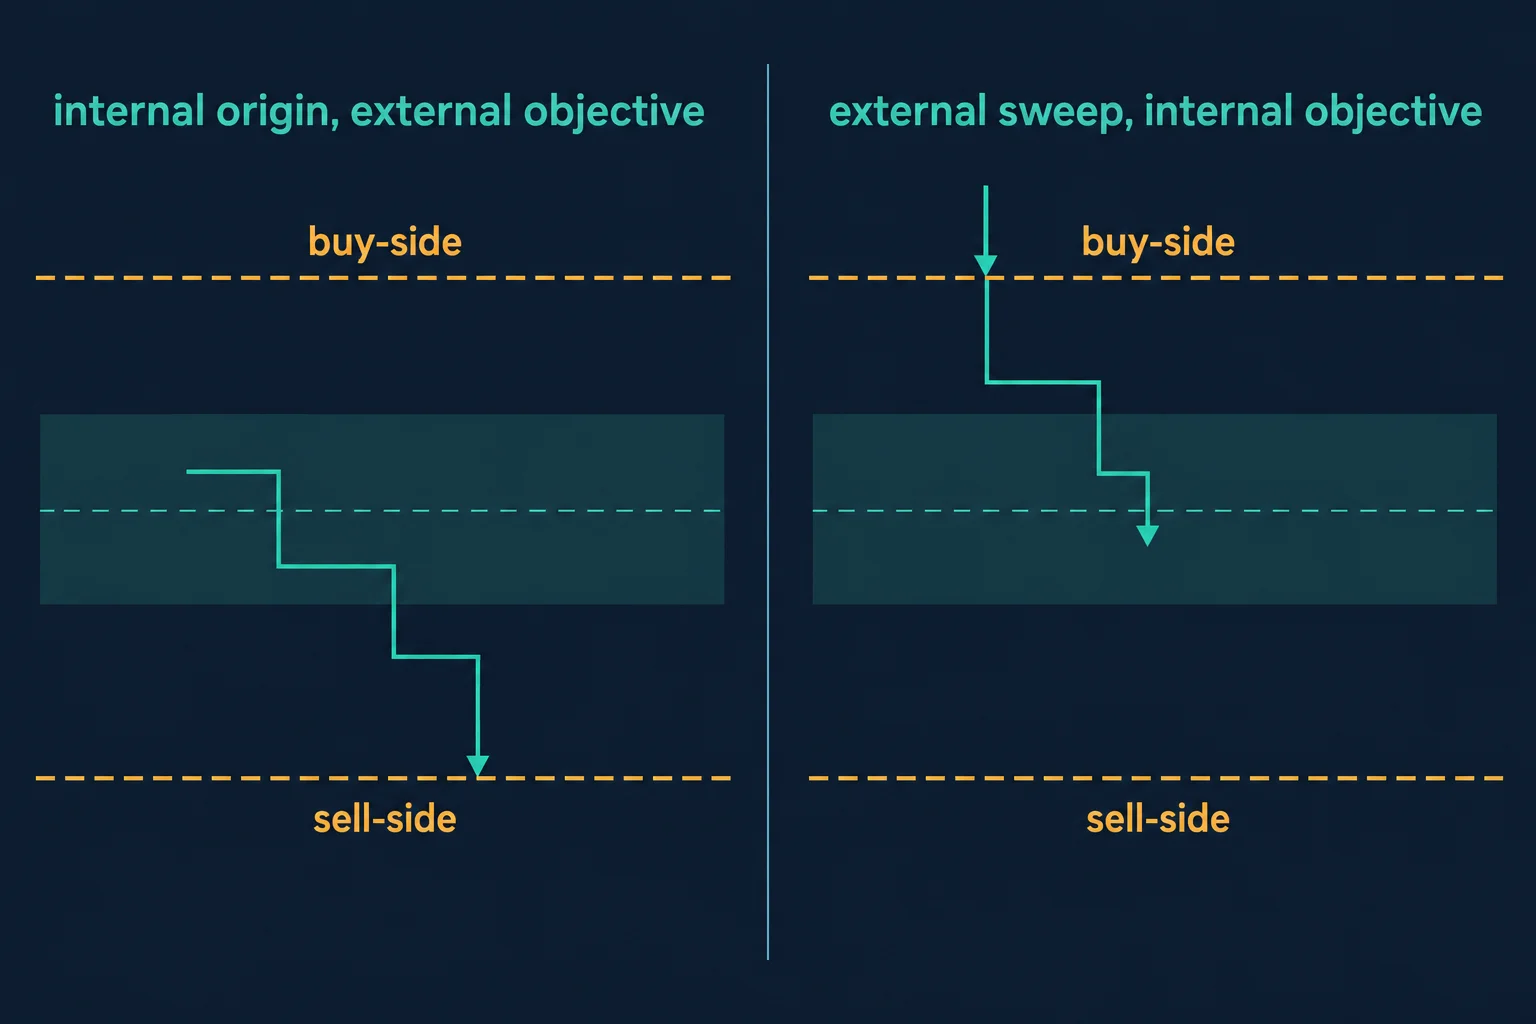
The lesson’s central organizing idea begins around 9:30. ICT separates liquidity references into two categories:
- External range liquidity: levels outside a defined dealing range, which he illustrates with runs on outside double-top highs and double-bottom lows.
- Internal range liquidity: references within the range, which he lists as fair value gaps, liquidity voids and order blocks.
ICT’s proposed pairing is stated at 10:47: most of the time internal range liquidity entries will run to external range liquidity, and he calls that a low-resistance liquidity run. At 11:11 he gives the converse, describing a turtle-soup style entry that fades a run on double-top highs in a bearish condition and then targets internal range liquidity for exits. He revisits the same relationship at 58:25, asking directly whether a particular volume imbalance should be classified as external or internal range liquidity.
He also ties the classification to the order in which he reads the price delivery arrays, noting at 44:14 that not every price action fractal contains every array. These are ICT’s chart-reading conventions, not direct observations of actual institutional orders.
ICT Model 9 Price Imbalances and Inefficiencies
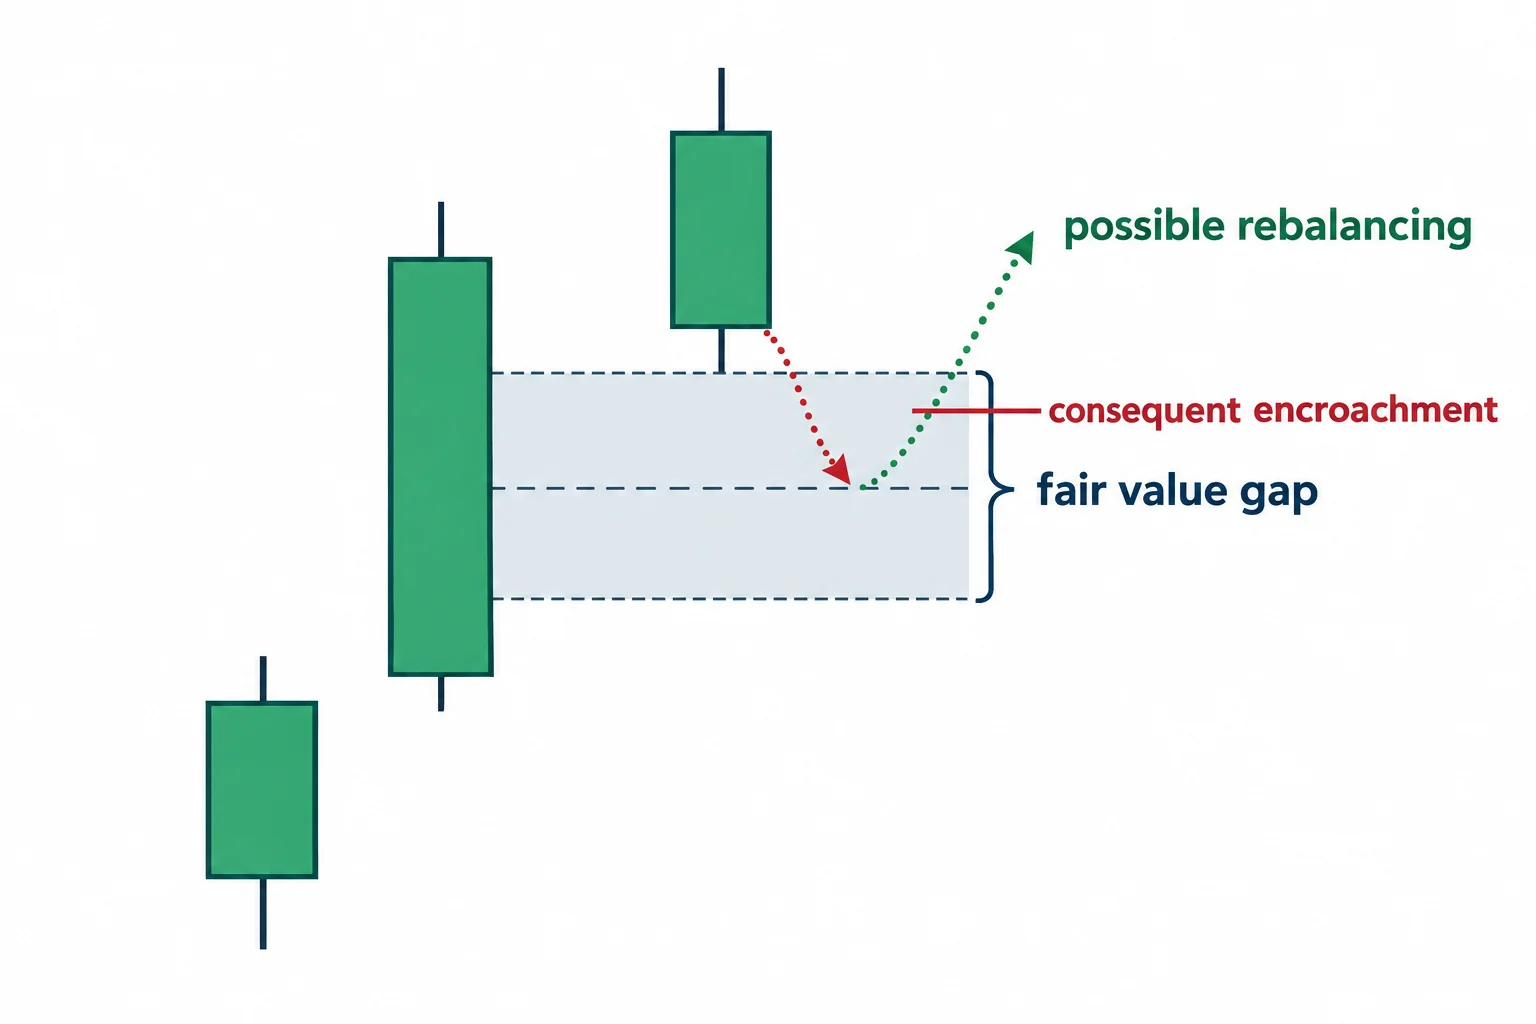
A terminology clarification appears around 14:17. ICT says that when a market rallies sharply it often creates a fair value gap or liquidity void where there are one or a couple of large up candles, and at 14:31 he labels that a “buy side imbalance, sell side inefficiency.” He adds at 14:37 that the two terms mean the same thing and that he uses them interchangeably depending on how he is looking at price. In the opposite direction, sell-side imbalance corresponds to buy-side inefficiency.
Within his framework, a forceful move may leave an area that price could later revisit for rebalancing, and the lesson uses fair value gaps and liquidity voids to represent those areas. ICT emphasizes that identifying one is not enough by itself: it must fit the higher-timeframe narrative and the current range. He later identifies the midpoint of a fair value gap as consequent encroachment at 52:34; the automated transcript renders this term inconsistently elsewhere in the recording, including once as “consequent encouragement,” so that wording should be treated as a speech-recognition artifact.
ICT Model 9 Entry Timing and Price Action Management
Model 9 is not presented as an isolated entry pattern. ICT argues that lower-timeframe models help manage a position based on a weekly objective. Beginning around 28:59, he explains that when a lower-timeframe trade model reaches a level where it would ordinarily take profit, that is the only time he would move the stop on a Model 9 position.
He develops the rule concretely later. At 31:32 he says the stop is brought down to a logical level when a scalper or day-trading model is profitable. In the December example he first uses a run into equal lows as a profit area for a scalper at 31:58 and an area in the late New York hour at 32:09, then says the stop loss is brought to break-even only after price reaches the next level, at 32:29. At 32:38 he says explicitly that the stop is not micromanaged until Friday, when he becomes aggressive about trailing it, and at 34:49 he adds that a Thursday pullback is not a reason to trail the stop.
The broader educational principle is that the holding period and management rules should match the thesis. A weekly-range idea naturally allows more fluctuation than a scalp. He also notes the psychological side at 33:08, saying that fear of taking a loss can prevent a trader from taking a gain. This does not determine an objectively correct stop location, and the transcript cannot confirm the chart levels or executions shown onscreen.
When You Miss an ICT Model 9 Price Setup
ICT does not describe One Shot One Kill as the only permissible approach. At 25:44 he acknowledges that a trader will miss the ideal entry, and at 23:36 he asks what the contingency plan is, answering that Model 8 or a scalping model taught later in the series can be used instead. At 25:57 he notes Model 8 can also help mitigate a loss taken while trying to trade a Model 9 setup, and at 27:18 he accepts that if the opportunity arrives on Wednesday it has been missed, adding at 27:25 that Friday still offers something. His larger point is that different models are modular.
Importantly, the lesson also includes a losing example. At 54:24 ICT walks through the week of December 7th to 13th, when repeated short expectations did not produce the anticipated move because price was returning into an older area of institutional order flow. He says plainly at 54:42 that this is what will happen to the viewer and that trading enough times will produce a loss, and at 54:48 he calls this the week where following the model would have produced one. That passage reinforces his opening warning about realistic expectations.
ICT Model 9 Price Action Takeaways
The lesson can be reduced to a structured study process:
- Define a higher-timeframe dealing range and directional hypothesis.
- Mark internal references and liquidity beyond the range.
- Focus Model 9 analysis on Monday through Wednesday for a possible weekly extreme.
- Assess whether a move begins from internal or external liquidity and identify the opposing category as a possible objective.
- Use lower-timeframe structures to evaluate stop and profit decisions rather than reacting to every small fluctuation.
- Accept invalidation and reassess, using a secondary model, instead of assuming the weekly narrative must be correct.
This is best treated as a vocabulary and chart-review framework for studying ICT’s market interpretation. The recording does not provide controlled testing, complete execution records or evidence that the model produces consistent returns. Markets involve substantial risk, and this summary is educational rather than investment advice.
Watch the original recording
The video mapped to this article is ICT Charter Price Action Model 9 — One Shot One Kill, a public upload on the channel The Inner Circle Trader dated 6 February 2024 and running 3,930 seconds. Every timestamp link above points into that recording. The transcript used for this guide was produced by local automatic speech recognition of the complete original audio rather than from YouTube captions, so its wording should be treated as automated, not human-verified. The recording’s charts and on-screen annotations were not examined by this review.
Reference sources and provenance
These references support specific points in the guide above. None of them is an ICT publication, none endorses or tests the approach, and none is offered as evidence for the statements shown in the recording.
Why a stated pip objective is not a performance record
A weekly figure such as 50 to 75 pips describes an intention, not a measured result. The U.S. Commodity Futures Trading Commission states on its Forex Frauds page that “two out of three retail foreign exchange traders lose money each quarter.”[2] That sentence is quoted as general context for retail participation in these markets and says nothing about this speaker, his method or the December example used in the recording.
Risk context for a model built on frequent intraday participation
Investor.gov, the U.S. Securities and Exchange Commission’s investor education site, describes day trading as “extremely risky” and states that it “can result in substantial financial losses in a very short period of time.”[3] Model 9 is framed around repeated weekly attempts at an intraday objective, so that framing is relevant as general risk context. It makes no claim about the speaker or his statements.
Why the recorded examples are illustrations, not audited results
The December illustrations in the recording are chart walkthroughs rather than a disclosed track record, and 17 CFR 4.41 explains why a performance claim needs care: the regulation’s prescribed statement notes that “these results are based on simulated or hypothetical performance results that have certain inherent limitations,” and adds that “simulated or hypothetical trading programs in general are also subject to the fact that they are designed with the benefit of hindsight.”[4] The recording does not present its examples in that form, so no outcome on this page should be read as an audited or independently verified result.
Why the player above is the check on every timestamp
The whole article rests on the mapped upload, so the reader’s own control is the embedded player. YouTube’s help documentation states that “you can add a YouTube video or playlist to a website or blog by embedding it” and that age-restricted videos cannot be watched on most third-party sites, redirecting viewers back to YouTube instead.[5] The upload used here is publicly listed and not age-restricted, and the embed was play-tested rather than assumed to work.
Sources
- [1] Primary source: ICT Charter Price Action Model 9 — One Shot One Kill (The Inner Circle Trader)
- [2] CFTC Learn & Protect: Forex Frauds
- [3] Investor.gov (U.S. Securities and Exchange Commission): Day Trading
- [4] 17 CFR 4.41: Advertising by commodity pool operators, commodity trading advisors, and the principals thereof
- [5] YouTube Help: Embed videos & playlists
Any ICT, SMC or third-party indicator, script, transcript, note set, spreadsheet or social summary circulating outside the publishing channel’s own upload page is unofficial and untested here. Kill zone, optimal trade entry, PD array, liquidity void, order block, consequent encroachment, sell-side inefficiency and buy-side inefficiency are the speaker’s own framework and terminology. No win rate, drawdown figure, fill, position size or account result is claimed anywhere in this article.
Leveraged foreign-exchange trading carries substantial risk. Moving a stop only when a lower-timeframe model reaches its objective, waiting to bring a stop to break-even, and reserving aggressive trailing for Friday all change the distribution of outcomes, and none of them removes slippage or the possibility of loss. This article is educational commentary, does not provide individualised financial advice, and reports no outcome from any session or account.
