
Key takeaways
ICT Price Action Model 9, the One Shot One Kill model, is a selective weekly FX trade plan targeting 50 to 75 pips through five stages of preparation, opportunity discovery, trade planning, execution and management.
Read the full summary
ICT Price Action Model 9, the One Shot One Kill model, is a selective weekly FX trade plan targeting 50 to 75 pips through five stages of preparation, opportunity discovery, trade planning, execution and management. Traders mark the highest high and lowest low of the prior 20 weeks, form a weekly bias toward old highs or buy-side liquidity or old lows or sell-side liquidity, align a PD array and calendar catalyst, then wait for an opposing retracement into premium or discount before seeking a demo-account entry on a 15-minute chart during the London or New York kill zones. Management uses either one 50-pip target or an 80% exit at 50 pips with the remainder managed toward 75 pips, reduces stop distance by 25% after 50% of the objective and moves the stop to break-even after 75%. Position sizing uses account equity multiplied by risk percentage and divided by stop distance, with a hypothetical $10,000 account, 1% risk and 20-pip stop. Risk is halved after a full loss, restored after half the loss is recovered and reduced after five consecutive wins. The EUR/USD example for the week ending December 4, 2020 uses a bullish bias, a 20-week-old high, a higher-time-frame fair value gap and a December 1 Federal Reserve chair appearance, followed by a New York optimal trade entry and claimed 50-pip objective. Model 9 can be combined with Model 8 through separate orders, earlier partial profits, a larger weekly target, measured moves and pyramiding only on the permitted side of equilibrium, including multiple 1% allocations. ICT prefers Monday for information and Tuesday or Wednesday for setups, but the stated 70% Tuesday tendency, chart levels, fills and profitability are not independently verified.
How we researched this article
BestProps used document-based research from primary firm sources, checked September 24, 2026. The complete source list, scope, limitations, and commercial-state record appear near the end of this article.
ICT Price Action Model 9, called the “One Shot One Kill” model, is presented as a structured plan for seeking one larger weekly foreign-exchange move rather than repeatedly trading every intraday fluctuation. In the primary video, ICT frames the objective as 50 to 75 pips per week, while repeatedly emphasizing preparation, selective execution and risk management.
This is ICT’s interpretation of market behavior, not proof that markets follow a fixed algorithm or that the model will be profitable. The lesson also includes an older EUR/USD example associated with the week ending December 4, 2020. Although ICT describes an execution and its result, the transcript alone cannot verify chart levels, orders, fills or performance.
The ICT Model 9 Five-Stage Trade Plan
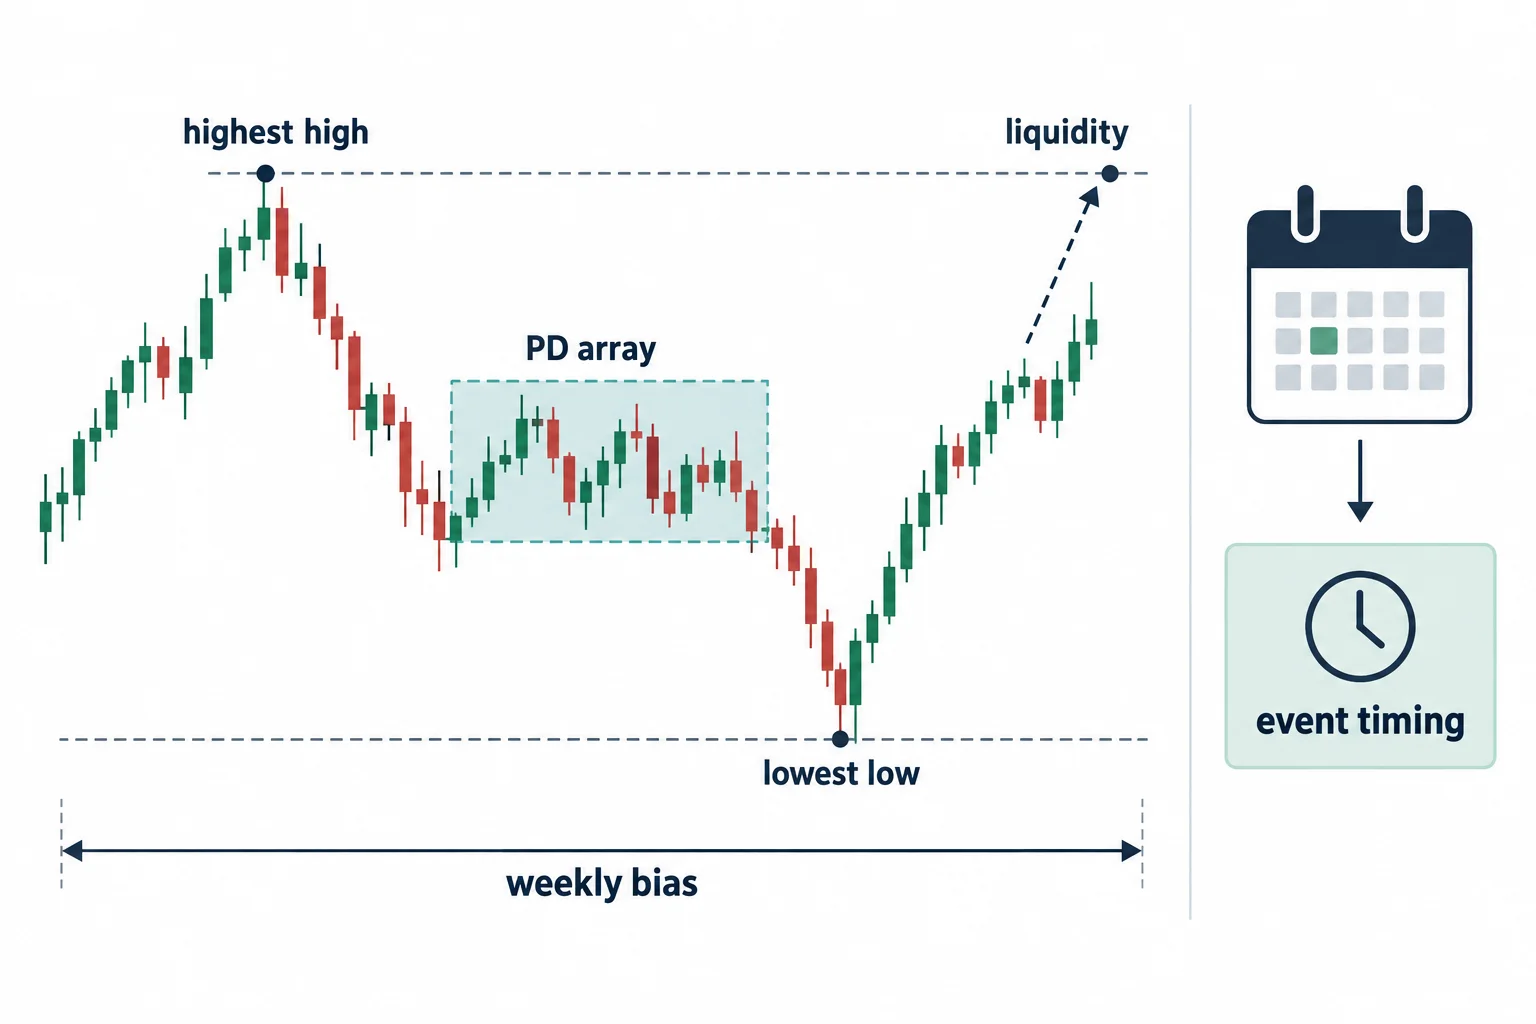
At 1:18, ICT organizes Model 9 into five stages:
- Preparation
- Opportunity discovery
- Trade planning
- Trade execution
- Trade management
Prepare With the 20-Week Price Range
The preparation stage begins with medium- and high-impact calendar events, current market structure and a possible weekly range profile. At 1:58, ICT shifts a range-analysis concept from days to weeks: identify the highest high and lowest low of the previous 20 weeks.
Within that range, the trader is instructed to form a directional hypothesis about which old high or low price might approach next. ICT calls these potential destinations liquidity and looks for a “PD array” aligned with the weekly bias. The transcript uses PD array as established course terminology but does not define every qualifying structure in this lesson.
ICT then connects the directional idea with a scheduled event that might introduce volatility. This does not mean a news release determines direction; within the model, it is treated as a possible timing catalyst after a higher-time-frame bias has already been formed.
Find the ICT Trade Opportunity
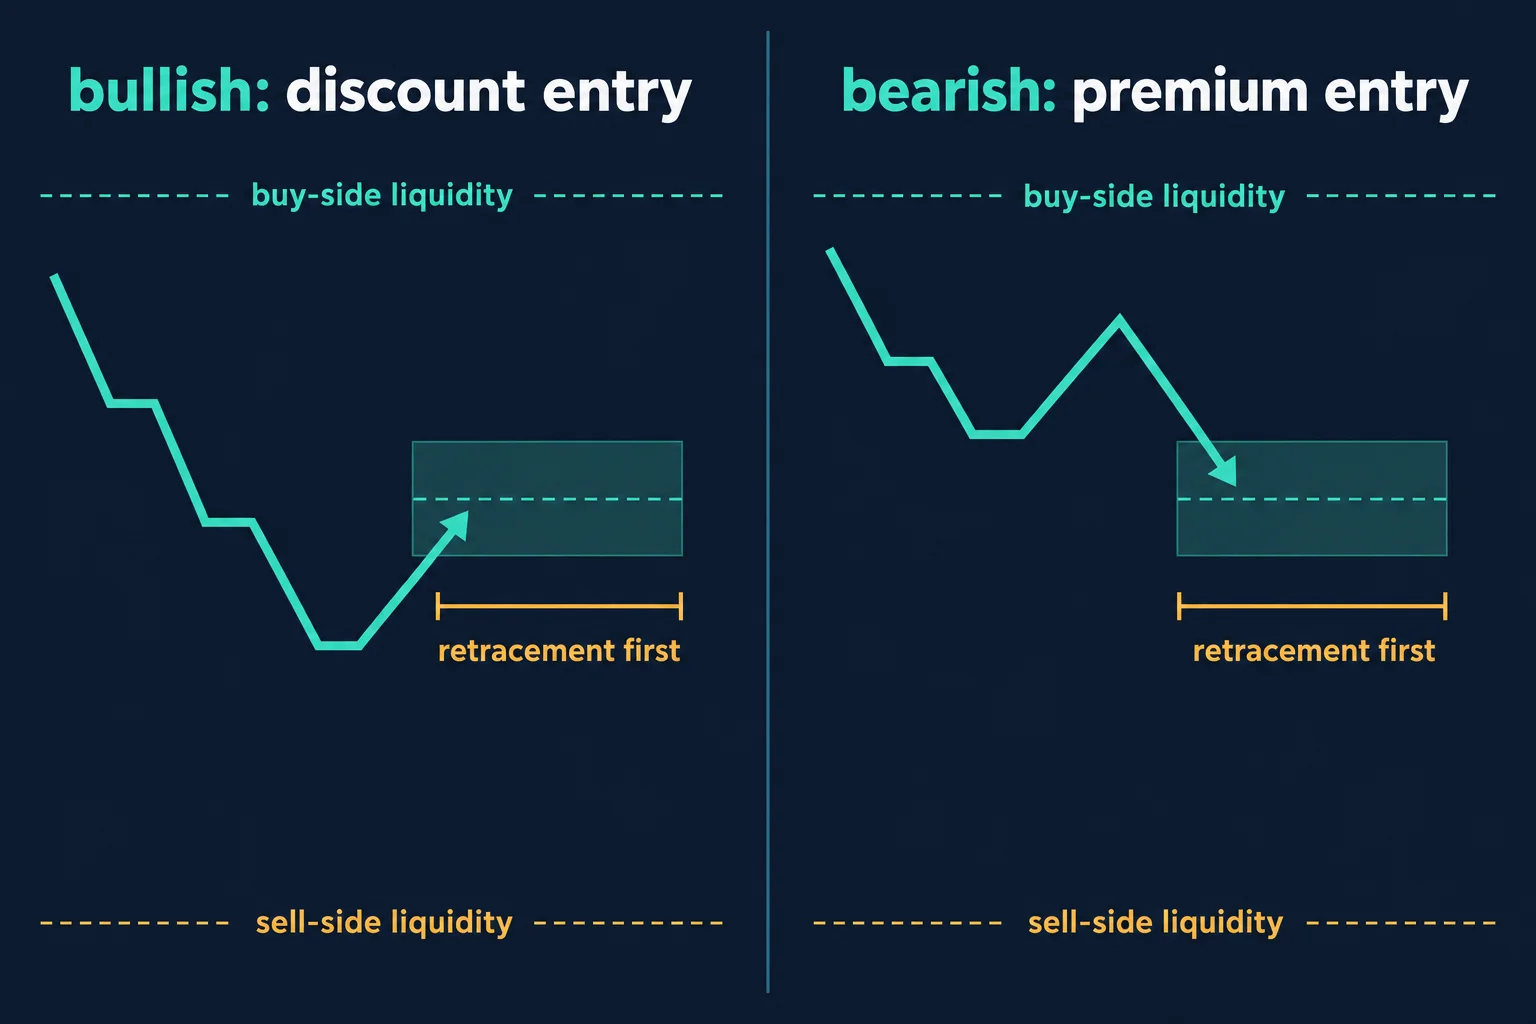
At 3:51, the lesson turns to finding a plausible 50-to-75-pip range. For a bullish thesis, ICT looks for a move toward old highs or what he terms buy-side liquidity. For a bearish thesis, he looks toward old lows or sell-side liquidity.
The 50-pip figure is a planning objective, not a guaranteed market movement. ICT says he prefers the lower end of the stated range rather than requiring every position to capture a full 75 pips.
Plan for an Opposing Price Move
ICT’s trade-planning rules look for price to move temporarily against the intended direction near a period of expected volatility. In a bearish scenario, that means a rally into an area he regards as premium or buy-side liquidity. In a bullish scenario, it means a decline into an area he regards as discount or sell-side liquidity. The relevant discussion begins at 4:53.
In general educational terms, this is a top-down workflow: establish a weekly hypothesis, identify a possible destination, wait for a retracement and only then look for an entry pattern. It is not simply an instruction to trade whenever economic news appears.
Execute the Trade in London or New York
At 5:27, ICT describes using a 15-minute chart during the London or New York “kill zones.” For bearish conditions, he anticipates either a retracement higher into what he calls an optimal trade entry or a raid above prior stops. The bullish setup reverses that logic.
The lesson specifies demo-account execution. This is important context: the material is presented as a training exercise, and the transcript does not establish live fills or independently verified returns.
ICT Model 9 Trade and Risk Rules
The basic management plan starts with a single 50-pip target. An alternative described at 6:39 is to close 80% after 50 pips and manage the remainder toward 75 pips, taking partial profits around short-term highs or lows.
ICT also proposes reducing stop exposure as a trade progresses:
- After reaching 50% of the expected objective, reduce the stop distance by 25%.
- After reaching 75% of the expected objective, move the stop to break-even.
These are the speaker’s model rules, not universally optimal stop practices. Moving a stop cannot eliminate slippage, execution risk or the possibility of loss.
From 7:42, ICT explains position sizing as account equity multiplied by the chosen risk percentage, divided by the stop distance in pips, with the result translated into the appropriate pip value and rounded down. He uses hypothetical $10,000 demo-account examples with 1% risk and a 20-pip stop. Contract size and pip value must be handled consistently; the simplified formula is not sufficient by itself for every instrument or account currency.
At 9:47, ICT sets out the drawdown control: after a full loss, cut the risk percentage in half, and resume normal risk once half the prior loss has been recovered. At 10:24 he adds that he also reduces risk after a series of five winning trades. These controls are intended to moderate drawdowns and aggressive sizing, but the video supplies no statistical test demonstrating their effectiveness.
ICT Model 9 EUR/USD Trade Example
At 10:50, ICT applies the framework to EUR/USD during the week ending December 4, 2020. He describes a bullish weekly bias, a 20-week-old high as a prospective draw and a higher-time-frame fair value gap. He then focuses on Tuesday, December 1, when a scheduled Federal Reserve chair appearance was expected to introduce volatility.
ICT says the intraday market advanced, retraced into an optimal trade entry during the New York session and permitted a 50-pip objective. Exact entry prices are intentionally not supplied in this lecture, and the audio transcript cannot confirm the chart annotations or execution.
Combining ICT Price Action Models 8 and 9
The later section, beginning around 18:18, explains how ICT combines Model 9 with Model 8. His approach uses separate orders with the same general entry thesis: one order seeks earlier, more aggressive partial profits, while the second is reserved for the larger weekly objective.
He also discusses measured-move projections, partial exits and pyramiding only while price remains on the permitted side of his framework’s equilibrium level. These techniques increase complexity and can increase total exposure. ICT gives examples using multiple 1% allocations, so viewers should not mistake the phrase “one shot” for one indivisible order or minimal risk.
ICT Model 9 Trade Plan Takeaways
Model 9 is best understood as a selective checklist rather than a standalone signal: develop a weekly bias, mark the 20-week range, identify a liquidity objective, consult the calendar, wait for a retracement during a specified session and define risk before entry. At 16:25, ICT adds that he prefers using Monday for information and looking for the setup on Tuesday or Wednesday. His stated “70%” Tuesday tendency is not substantiated with data in the transcript and should be treated as an unsupported teaching claim.
The closing discussion reinforces that the method depends on judgment and prior course concepts. At 32:07, ICT explicitly says traders will not master the market and should instead focus on controlling how they engage with it. That caution is more transferable than any particular pip objective: a plan can organize decisions, but it cannot guarantee direction, execution quality or profit.
Watch the original recording
The video mapped to this article is ICT Charter Price Action Model 9 — One Shot One Kill Trade Plan & Algorithmic Theory, a public upload on the channel The Inner Circle Trader dated 8 February 2024 and running 2,129 seconds. Every timestamp link above points into that recording. The transcript used for this guide was produced by local automatic speech recognition of the complete original audio rather than from YouTube captions, so its wording should be treated as automated. The recording’s charts and on-screen annotations were not examined by this review.
Reference sources and provenance
These references support specific points in the guide above. None of them is an ICT publication, none endorses or tests the approach, and none is offered as evidence for the statements shown in the recording.
Why a scheduled news release is not a direction signal
Model 9 pairs a weekly directional hypothesis with a scheduled event, and the recording uses a Federal Reserve chair appearance as the volatility catalyst in its December 2020 illustration. The Federal Reserve publishes its own meeting calendar as a service to the public.[3] A calendar entry fixes when volatility may arrive; it says nothing about which way price will resolve, which is the distinction the recording itself draws when it treats the event as a timing catalyst rather than a directional input.
Calendar-driven participation and prop-firm rules
The model deliberately concentrates execution around high-impact economic releases. Firms that fund traders commonly restrict or penalise holding positions through those same windows, so a method built on news-driven execution needs to be checked against the account’s own published rules before it is applied.[1] That page is BestProps’ own rules documentation and is cited here for the constraint, not as an endorsement or test of Model 9.
Why a pip objective is not a performance record
A stated weekly target such as 50 to 75 pips describes an intention, not a measured result. Investor.gov, the U.S. Securities and Exchange Commission’s investor education site, describes day trading as “extremely risky” and states that it “can result in substantial financial losses in a very short period of time”.[4] That framing is quoted only as general risk context for a plan built around frequent intraday participation; it makes no claim about the speaker or his statements.
Where a learner can check the general claims
The recording leans throughout on concepts taught earlier in the series rather than redefining them, so the transferable material is the planning process itself. The U.S. Commodity Futures Trading Commission publishes customer advisories aimed at retail participants in these markets, including material on the risks of leveraged trading, which is an appropriate independent starting point for a reader evaluating any method built around a fixed weekly target.[2] Nothing there addresses Model 9 specifically; it is cited as a starting point, not as a verdict on the recording. YouTube’s own help documentation likewise explains the embedding control that determines whether the player above is playable on an external site.[5]
Source, method and limits
This article is grounded in the full timestamped transcript of the mapped upload. The transcript was produced by local automatic speech recognition of the complete original audio and is not human-reviewed captions; the recording’s charts and on-screen annotations were not examined by this review. The December 2020 EUR/USD sequence is reported exactly as the speaker describes it: the recording itself says exact entry prices were deliberately withheld and that viewers should watch the separate YouTube execution for the fills. No account size, balance, fill, position size or net result is asserted anywhere on this page, and the “70%” Tuesday claim is reported as the speaker’s own unsupported teaching claim.
Sources
- [1] BestProps: News trading rules
- [2] U.S. Commodity Futures Trading Commission: Customer advisories and articles
- [3] Board of Governors of the Federal Reserve System: Meeting calendars and information
- [4] Investor.gov (U.S. Securities and Exchange Commission): Day Trading
- [5] YouTube Help: Embed videos & playlists
- Primary source: ICT Charter Price Action Model 9 — One Shot One Kill Trade Plan & Algorithmic Theory (The Inner Circle Trader)
Any ICT, SMC or third-party indicator, script, transcript, note set, spreadsheet or social summary circulating outside the publishing channel’s own upload page is unofficial and untested here. Kill zone, optimal trade entry, PD array, liquidity pool, buy-side and sell-side liquidity, equilibrium and measured move are the speaker’s own framework and terminology. No win rate, drawdown figure, fill, position size or account result is claimed anywhere in this article.
Leveraged foreign-exchange and futures trading carries substantial risk. A weekly pip objective, a stop reduced by 25% at half the objective, a stop moved to breakeven at 75% of the objective and a risk percentage halved after a full loss all change the distribution of outcomes, and none of them removes slippage or the possibility of loss. This article is educational commentary, does not provide individualised financial advice, and reports no outcome from any session or account.
