
Key takeaways
ICT Price Action Model 11 is a five-stage day-trading framework seeking a 30-pip intraday objective through preparation, opportunity discovery, trade planning, execution and management, but ICT provides no verified strike rate or profitability and recommends backtesting and demo execution rather than live trading.
Read the full summary
ICT Price Action Model 11 is a five-stage day-trading framework seeking a 30-pip intraday objective through preparation, opportunity discovery, trade planning, execution and management, but ICT provides no verified strike rate or profitability and recommends backtesting and demo execution rather than live trading. Preparation uses medium- and high-impact calendar events, weekly directional bias and a range defined by the highest high and lowest low of the previous 20 trading days excluding Sundays, with an old high or low as the draw on liquidity and a corresponding PD array. Opportunity discovery uses a 60-minute chart to identify potential expansion above 30 pips, with bullish institutional order flow targeting buy-side liquidity and bearish flow targeting sell-side liquidity. Bearish plans seek an event-driven move higher followed by a short from the premium portion of the 60-minute range, while bullish plans seek a move lower followed by a long from discount. Execution refines the 60-minute setup on 15- or 5-minute charts during London Open or New York Open kill zones, using a limit order near the 62% Fibonacci retracement adjusted five pips below the level for shorts or above it for longs. The formal single-position plan uses a 30-pip target and 20-pip initial stop, reduces the stop by five pips after 15 pips of favorable movement and moves it to break-even after 20 pips, while later examples add discretionary partial profits near prior highs and extensions. Position sizing uses account equity multiplied by risk percentage and divided by stop distance, illustrated with $10,000 equity, 1% risk and a 20-pip stop, with size rounded down and pip value adjusted for the instrument, quote currency and account setup. After one full-risk demo loss, risk is halved, after another loss at the reduced level it is reduced again, and the prior level is restored only after recovering half the previous loss; risk is also halved after five consecutive wins. A June 1, 2022 Australian dollar illustration shows a 15-minute sell-side sweep, London rally, fair value gap and move above the previous day’s high, but ICT says he did not take the trade and the transcript verifies no entry, fill, spread, slippage or realized result.
How we researched this article
BestProps used document-based research from primary firm sources, checked September 24, 2026. The complete source list, scope, limitations, and commercial-state record appear near the end of this article.
ICT Price Action Model 11 is presented as a day-trading framework designed to seek a relatively modest 30-pip objective. In the primary video, ICT calls Models 11 and 12 “bread and butter” setups because he believes they appear frequently and carries a higher strike rate. However, he also cautions that Model 11 requires familiarity with his broader concepts and should not automatically become a beginner’s first model.
This lesson is best understood as an explanation of ICT’s market framework, not evidence that the setup has a verified strike rate or profitability. ICT repeatedly discourages overleveraging and instructs students to begin with backtesting and demo execution.
ICT Model 11 Five-Stage Trade Plan
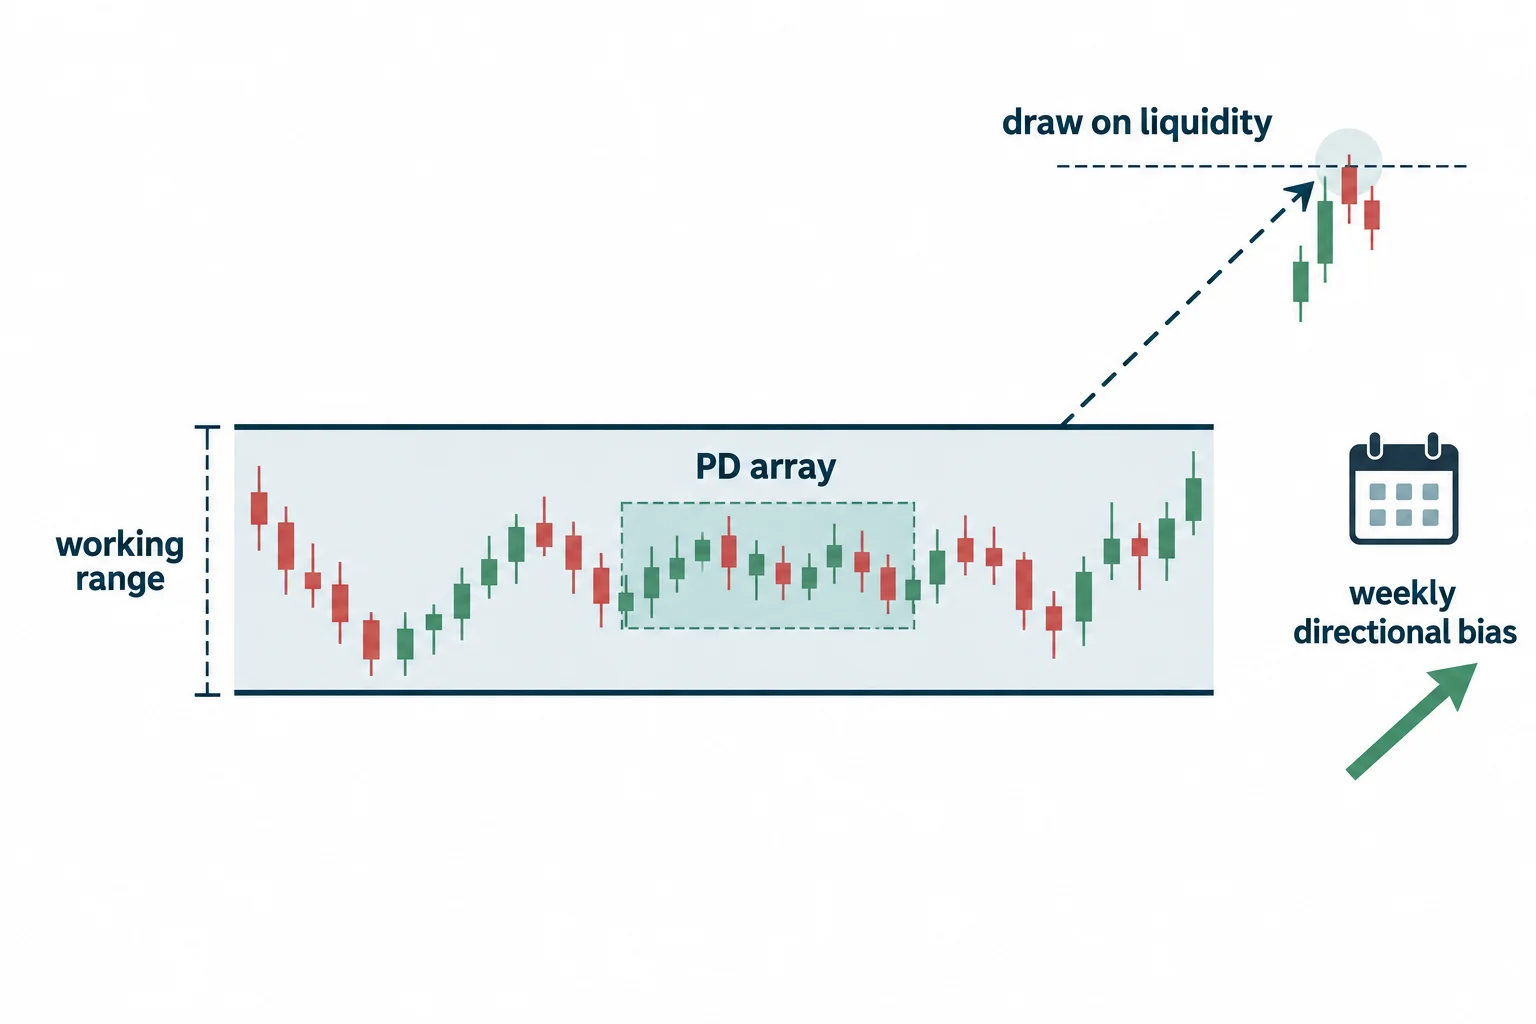
At 1:45, ICT organizes the model into five stages: preparation, opportunity discovery, trade planning, trade execution and trade management.
ICT Model Preparation
The preparation process begins with noting medium- and high-impact calendar events for the markets under study. ICT suggests considering whether those scheduled events support a possible weekly range profile.
For this model, he defines the working range using the highest high and lowest low from the previous 20 trading days, excluding Sundays (2:22). Within that range, the trader identifies a prospective “draw on liquidity” (in ICT terminology, an old high or low toward which price may move) and looks for a PD array aligned with the weekly directional bias. The model is intended to target liquidity outside the current range.
These labels are specific to ICT’s methodology. They describe how he interprets price delivery; they do not establish that price is mechanically compelled to reach a given level.
ICT Trade Opportunity Discovery
At 3:25, ICT shifts to the opportunity criteria. The trader looks on a 60-minute chart for conditions that could support an expansion of more than 30 pips. Under his framework, bullish institutional order flow points toward buy-side liquidity, while bearish order flow points toward sell-side liquidity.
ICT Trade Planning
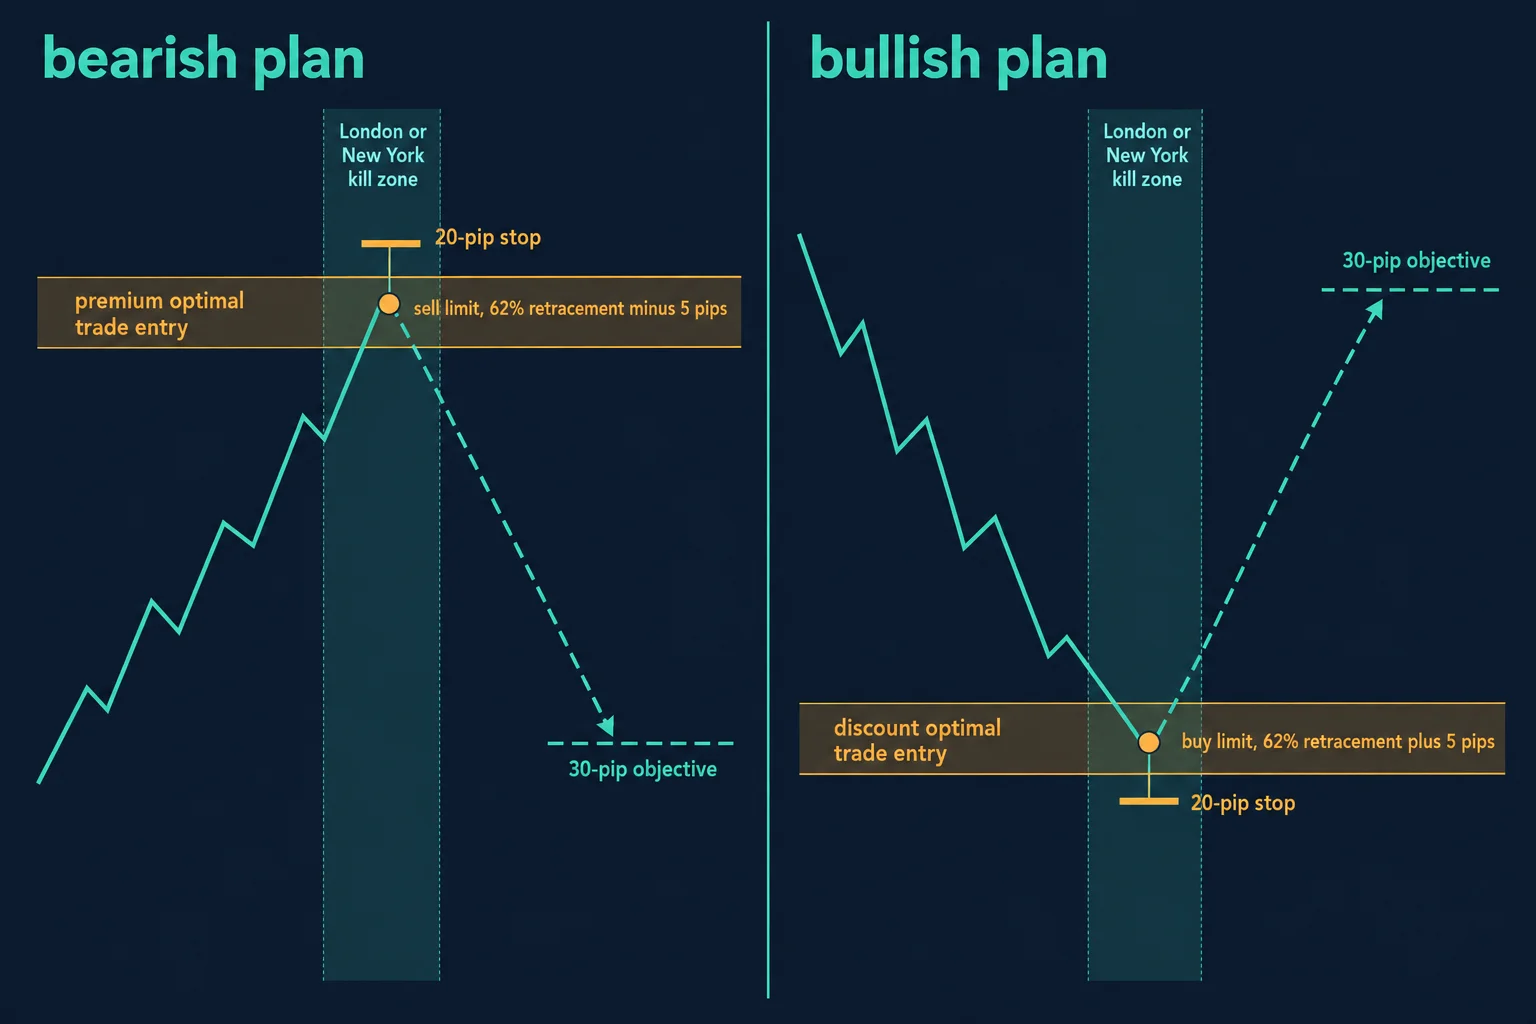
For a bearish plan, ICT looks for an upward move opposite the intended direction around a scheduled volatility event, followed by a short setup in the premium portion of a 60-minute range. For a bullish plan, he reverses the logic: a downward move into a discount area may provide the context for a long setup.
The terms “premium,” “discount,” “manipulation” and “optimal trade entry” are part of ICT’s interpretive vocabulary. Applying them consistently requires definitions from the surrounding course material.
ICT Trade Execution
The execution discussion begins near 4:35. Although the 60-minute swing supplies the broader structure, ICT proposes refining a setup on a 15- or 5-minute chart during the London Open or New York Open periods he calls “kill zones.”
- For a bearish scenario, look for a lower-time-frame premium entry during a 60-minute retracement higher.
- For a bullish scenario, look for a lower-time-frame discount entry during a 60-minute retracement lower.
- ICT specifies demo execution rather than presenting the lesson as a live trade recommendation.
At 5:32, he describes limit-order entries around a 62% Fibonacci retracement, adjusted by five pips: below the calculated level for a short and above it for a long. The transcript alone does not show the chart anchors used to draw that retracement.
ICT Trade and Stop Management
At 6:05, ICT sets a 30-pip objective for a single position. He proposes an initial 20-pip stop at 6:46, reducing the stop by five pips after 15 pips of favorable movement and moving it to break-even after 20 pips.
The later chart discussion also mentions taking partial profits around prior highs and incremental extensions. That is more discretionary than the earlier single-position plan, so viewers should distinguish the formal checklist from the subsequent illustration.
ICT Trade Plan Position Sizing and Streak Risk
ICT introduces position sizing at 7:09. His simplified relationship is account equity multiplied by the selected risk percentage, divided by stop distance in pips. He illustrates it with hypothetical $10,000 equity, 1% risk and a 20-pip stop, then converts the risk budget into micro- or mini-lot examples.
Actual pip value depends on the instrument, quote currency and account configuration, so the numerical example should not be treated as a universal sizing formula without those details. ICT also advocates rounding position size down.
His risk-control rules are deliberately conservative: after a full-risk demo loss, cut the risk percentage in half; reduce it again following another loss at the reduced level; and restore the previous level only after recovering half the prior loss. He also proposes halving risk after five consecutive winning trades, arguing that this may moderate the effect of an eventual loss. These are ICT’s prescribed rules, not validated guarantees of a smooth equity curve.
ICT Price Action Chart Lessons
The second half of the lesson uses an Australian dollar example identified in the narration as Wednesday, June 1, 2022. The upload is dated 12 February 2024, so the walkthrough is a look back at a past session rather than a live broadcast. ICT explains that a trader does not need to predict the final weekly close or require a distant higher-time-frame target to be reached. Instead, a nearby previous-day or intraweek high can provide a more limited objective within the anticipated directional move.
Beginning around 14:49, he describes a 15-minute sequence involving a sell-side sweep, a London-session rally, a fair value gap and movement above the previous day’s high. His central point is that the larger projected target was not reached, yet the intraday movement still illustrated the type of smaller expansion Model 11 seeks. The transcript does not independently verify an entry, fill, spread, slippage or realized result, and ICT explicitly says at 13:33 that he did not take the illustrated forex trade.
The narrated illustration also takes partial profits at the previous day’s high, then ten pips above it, then twenty pips above it (17:15), and repeats the same read on a five-minute chart running into the New York Open (22:04). He notes that a run of that shape can also set up the New York Open market-reversal profiles, and he adds that he does not trade cryptocurrency and does not know how often this model forms there.
ICT Model 11 Trade Plan Takeaways
Model 11 combines a higher-time-frame directional filter with a deliberately smaller intraday objective. ICT advises beginners to select one direction, study repeated samples and avoid forcing counter-bias trades. At 19:58, he characterizes the model as systematic and potentially recurring, but those frequency claims remain his interpretation rather than independently tested evidence.
The most responsible next step follows ICT’s own instruction at 9:53: collect multiple historical sample sets, review unclear concepts and use simulated execution before drawing conclusions. This summary is educational commentary, not investment advice or a promise of trading performance.
Watch the original recording
This embedded player was opened and clicked from a BestProps page on 14 September 2026 and began playing at the recording’s own duration, so the lecture can be watched in place. The timestamp links above point to the passages being described.
Primary source and further reading
- The original Inner Circle Trader recording — the timestamp links above are the passages being described; the lecture runs about 23 minutes.[1]
- CFTC — customer advisories and articles — the U.S. derivatives regulator’s risk material for futures and retail forex customers, included because the narrated stages are a plan rather than a demonstrated result.[2]
- Investor.gov (U.S. Securities and Exchange Commission) — Day Trading — the SEC’s risk framing for short-horizon trading, including the caution that frequent trading magnifies costs; directly relevant to a model that aims at 30 pips per trade rather than the daily range.[3]
- 17 CFR 4.41 — disclosures concerning hypothetical performance — the rule governing hypothetical performance claims, cited because the lecture’s risk and sizing figures are worked through as arithmetic examples rather than as audited results.[4]
None of the reading above is an ICT publication, none of it endorses or tests Model 11, and none of it is offered as evidence for the plan’s reasoning or for any outcome. The regulatory links are included because the lecture sets out position-sizing rules, not because they validate them.

