
Key takeaways
The Inner Circle Trader’s no-bias Nasdaq futures approach waits until ten thirty Eastern, marks the highest high and lowest low formed since the nine thirty open, divides that first-hour range into gradient levels, and studies only the half supported by developing price action, with the upper half emphasized for a bullish read.
Read the full summary
The Inner Circle Trader’s no-bias Nasdaq futures approach waits until ten thirty Eastern, marks the highest high and lowest low formed since the nine thirty open, divides that first-hour range into gradient levels, and studies only the half supported by developing price action, with the upper half emphasized for a bullish read. The six-step process is mark daily and hourly buy-side and sell-side liquidity, define the first-hour window, freeze and subdivide the range, wait for a liquidity sweep and absorption of nine forty-five or ten o’clock news, require displacement or a change in the state of delivery, and skip incomplete setups. The reviewed March contract example aligned a gradient level with a swing low, nearby gap and buy-side imbalance with sell-side inefficiency known as BISI, then tracked price around consequent encroachment, an inversion fair value gap and a bearish order block before the buy side above relative equal highs was taken. ICT reported one entry with slippage, three additions, a fill at consequent encroachment and a later long using the market maker buy model, but all executions were on a demo account and the transcript cannot verify prices, fills, stops or results. The roughly 15 minutes 22 seconds YouTube recording provides no sample size, win rate, forward test or demonstrated edge, so the framework is a session-analysis structure rather than a proven predictor.
How we researched this article
BestProps used document-based research from primary firm sources, checked September 24, 2026. The complete source list, scope, limitations, and commercial-state record appear near the end of this article.
What can a trader do when there is no firm directional read at the opening bell? In How Do I Engage Markets When I Don’t Have An Initial Bias?, the Inner Circle Trader gives his own working answer: wait for the first hour of trade to complete, mark its highest high and lowest low, divide that range into what he calls gradient levels, and let the developing price action narrow which half of the range is worth studying.
The recording is a short technical review of the Nasdaq futures contract for March delivery, run across a continuous-contract chart and the front month. It is not a claim that uncertainty can be removed. The speaker says repeatedly that he waits for more information, that he did not know in advance how the session would trade, and that the executions he shows were taken on a demo account.
This page summarises the recording from its own audio transcript, with timestamp links so each statement can be checked against the source. The transcript supports what was said and shown on the chart legend, and it cannot verify prices, fills, order placement or results.
ICT Market Context Without an Initial Bias
He begins on the daily chart, marking what he calls buy-side and sell-side liquidity and toggling a display setting until the most exaggerated volume imbalances are visible, which he says is the version he normally works from (00:52–:29). He then points to a higher-timeframe area that both the automated transcript and YouTube’s own captions render as a “suspension block”, and notes that price had driven into it that day. He warns that a continuous futures chart is skewed relative to the March contract because it recalculates as contracts roll (02:09–:40).
His read of that area is deliberately conditional rather than directional. He says he watched price meander for weeks and that the only thing he committed to publicly was that relative equal highs on the daily chart would be taken out. From there, he describes a draw towards the midpoint of the higher-timeframe area, an inversion fair value gap if price trades above that midpoint and outside the area, a challenge of the relative equal highs in that case, and continued rotation inside the range while price stays below the area’s consequent encroachment (02:00–:14). He also says plainly that he did not know how the session would trade, and that he needs the market to leave the range before larger risk becomes interesting to him (01:46, 03:24–:38).
That distinction is the point of the recording: a market narrative can suggest where price might be drawn without supplying a trade, and the levels above are framed as places to watch rather than instructions.
Build the ICT First Hour Range
He then drops to the hourly, 15-minute and one-minute charts and reviews how price traded into the new-week opening gap, through its high and low, and down into a discount area he labels a buy-side imbalance with sell-side inefficiency (03:38–:30). He notes that price ran straight through the new-week gap without returning to it, and that this was difficult to trade unless a trader already expected higher prices before the opening bell (04:30–:07).
He then rolls to the March contract and strips the chart back to a naked view, which is where the method he is teaching starts. When he is unsure which side of the market to focus on, he says he submits to the first half hour of the opening range, looks for the first presented fair value gap, and waits for the market to absorb the 9:45 or 10:00 news instead of guessing in front of it. If he is reluctant to act until the first hour is trading, he says that is usually because the market has ripped in one direction and left no reasonable entry (05:48–:46).
The mechanics he describes are simple. At 10:30 he goes back to the 9:30 open, marks the highest high and the lowest low of that hour, and grades the resulting range because, in his words, the key PD arrays tend to form in close proximity to one of these gradient levels (06:46–:03). He also refers to the eighth and quarter subdivisions he applies to the new-week gap earlier in the recording, which is the same idea of dividing a measured range (05:16–:25).
He says that when the read is bullish, the upper half of the first-hour range is the sensitive part, so he zooms in on that half and largely ignores the lower half (07:10–:52). That is the whole of the initial filter: no forecast is required, only a range and a half to watch.
Read Price Inside the First Hour Range
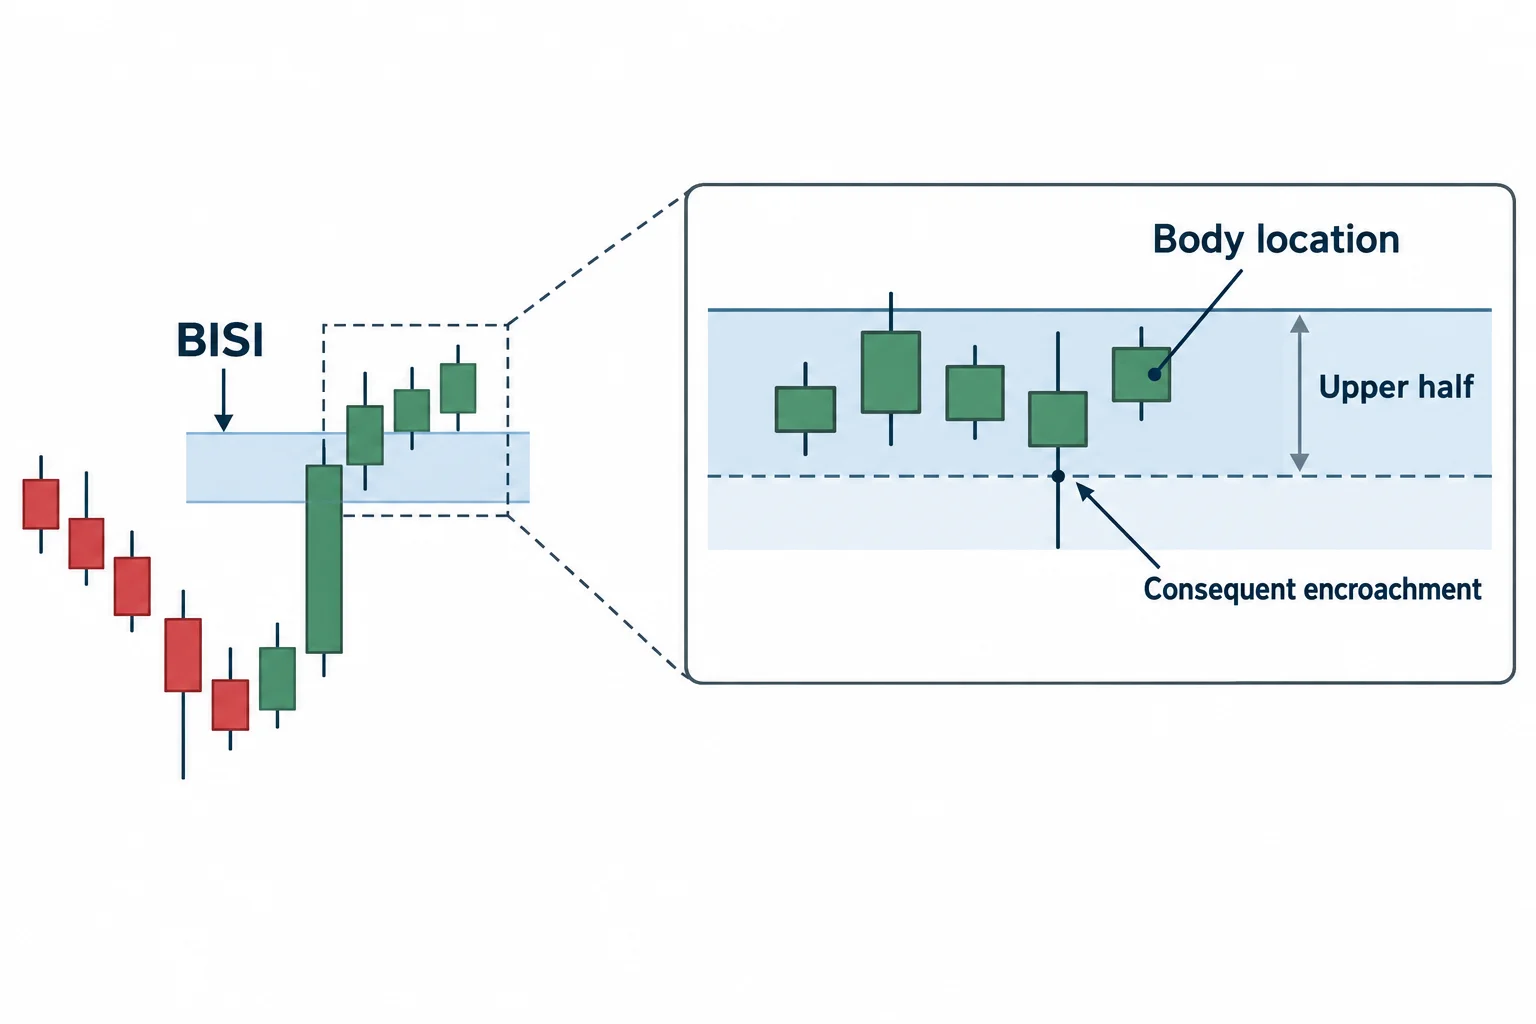
Inside the upper half he walks through the gradient levels one at a time until he finds alignment: a level, a small gap just above it, a swing low sitting on that level, and an inefficiency behind it. He calls that combination a candidate for a high-probability discount PD array in the form of a buy-side imbalance with sell-side inefficiency, and he uses the abbreviation BISI for it (08:07–:48).
From there he describes price trading down into the midpoint of that area (consequent encroachment, in his vocabulary), with candle bodies staying in the upper half, then rallying, retesting the gradient level, and eventually taking out the buy side above the relative equal highs (08:48–09:07). He immediately undercuts his own presentation: “hindsight, anybody can do that part” (09:07–09:18).
He then removes the annotation box and re-reads the same price action as a market maker buy model, naming original consolidation, first-stage distribution, second-stage distribution, a decline into the discount imbalance, accumulation and reaccumulation, and equilibrium inside the upper half before price attacked the buy side (09:18–:55). These are his labels for a chart he is interpreting after the fact.
Execute Trades From the ICT Range
He says he watched an inversion fair value gap to see whether price would use it, and that price went below it and changed the state of delivery through three up-closed candles, creating what he calls a bearish order block anchored to their opening price. He reports entering as price pulled away from that area, with some slippage, adding to the position three more times, and eventually being filled at the consequent encroachment level (10:16–:02). He is explicit that this was not market replay and that he did not record the session because his attention was divided that day (11:02–:18).
He also describes how close the exit was to failing, saying he could have been “snuffed” and stopped out before the level worked, and he then describes a long taken on the market maker buy model in which he had to absorb heat against the position, with the stop below a referenced low and a wider stop than traders are usually told to use because of how much back-and-forth volatility was sharing previous candle ranges (11:42–:37).
What makes this instructive is the qualification that follows. He states that the session was demo practice, that he was not committing real money that week, and that he would stay in simulation longer if the market did not show him something outside the range (13:04–:30). The transcript cannot confirm the displayed prices, the order sequence, the slippage, the stop placement or any outcome, and nothing in the recording establishes a tested edge.
Six Steps for the ICT First Hour Approach
Stripped of the chart annotations, the sequence he applies when he has no initial bias can be written down in six steps. The suggested wording is mine; the substance follows the recording.
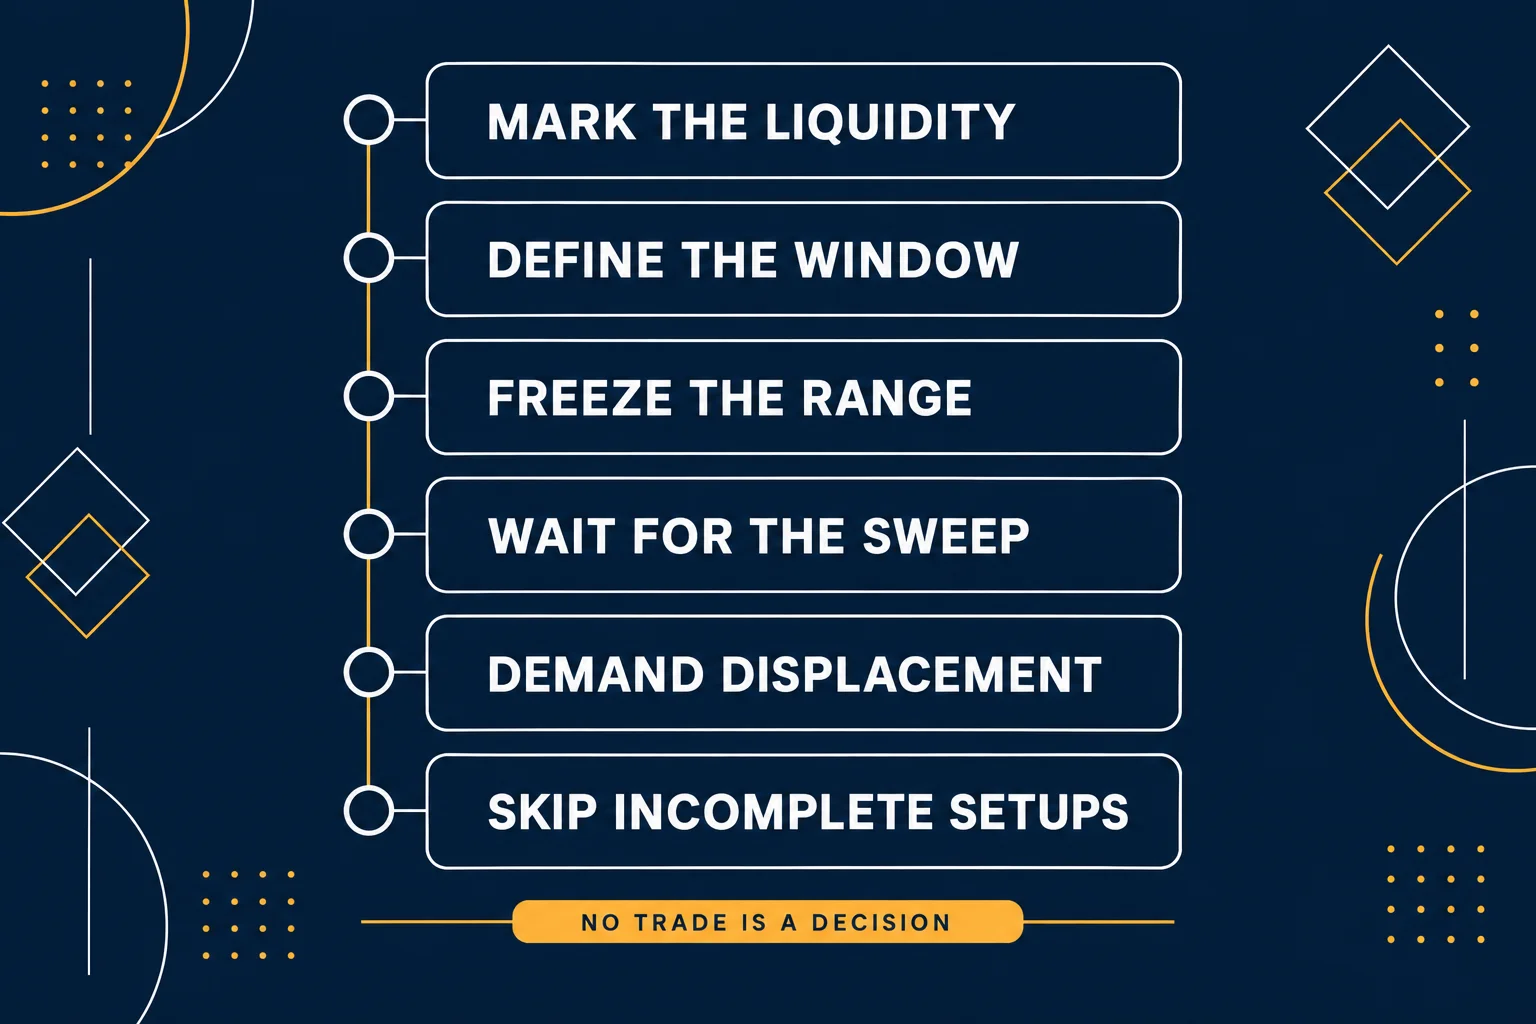
- Mark the liquidity. Buy-side and sell-side reference areas are identified before the session, on his daily and hourly charts, without deciding which one will be used.
- Define the window. When the direction is not trusted, the observation window becomes the first hour of trade after the 9:30 open.
- Freeze the range. At 10:30 the highest high and lowest low of that hour are marked and graded into subdivisions, separating the upper and lower halves.
- Wait for the sweep. Nothing is assumed from the range itself; he waits to see liquidity taken and for scheduled news to be absorbed.
- Demand displacement. A qualifying area needs a change in the state of delivery (in his example, up-closed candles forming an order block) before he treats it as a reference for entry and exit.
- Skip incomplete setups. If the alignment is not there, he says he simply waits for the first hour, and he stayed on a demo account rather than forcing size.
What the ICT Range Approach Cannot Do
He is careful to present the first-hour range as a way of organising a decision, not as a predictor. He notes that a stop-out would have been the outcome if the level had failed, that volatility at the time made very tight stops hard to use, and that the whole exercise was practice on a simulated account. The recording also contains no sample of results, no win rate and no forward test, so the range-and-half framework should be treated as a study structure rather than evidence that a no-bias session can be traded profitably.
For a trader researching it, the practical work is to apply the same procedure to recorded sessions and log what actually happened: where the first hour’s high and low sat, which gradient level price respected, whether displacement appeared, and how often the sequence failed. Cases where the range is abandoned or both halves are traded are as informative as the clean examples. Any execution decision remains subject to the account’s own rules on size, drawdown and permitted hours.
Watch the ICT First Hour Range Recording
The mapped source for this article is How Do I Engage Markets When I Don’t Have An Initial Bias?, published by the channel The Inner Circle Trader on 2 February 2026, with a runtime of about 15 minutes 22 seconds. It is a public, first-party upload and the only source used for the claims attributed above.
Watch the original recording on YouTube
This recording cannot be played inside another website. A fresh test from a BestProps page on 14 September 2026 loaded the embedded player and tried to start it; the player itself reported “Playback on other websites has been disabled by the video owner”, showed no play button and reported no duration or playback progress. No player is reserved here and no embed has been left blank as a result. The recording is available directly on YouTube.
Watch How Do I Engage Markets When I Don’t Have An Initial Bias? on YouTube ↗
ICT First Hour Range Sources
- The original Inner Circle Trader recording: the only source for the method described above; the timestamp links in this article point back into it.
- NYSE: Holidays & Trading Hours: the exchange operator’s own schedule, which places the core New York trading session at 9:30 a.m. to 4:00 p.m. Eastern Time and states that its times are Eastern. Useful because the recording’s window is anchored to the 9:30 open, while the page itself describes NYSE-listed equities rather than index futures.
- NIST: Daylight Saving Time Rules: the official U.S. timekeeper explains that in 2026 daylight saving time runs from 8 March to 1 November, which is what an offset between a local clock and the session times in the recording depends on.
BestProps is not affiliated with The Inner Circle Trader, the New York Stock Exchange or NIST, and none of them endorses this page. Initial bias, PD array, gradient levels, suspension block, buy-side imbalance, sell-side inefficiency, BISI, market maker buy model, consequent encroachment and inversion fair value gap are used here only as the recording uses them; several arrive through automatic transcription, and none is presented as standardised, tested or free of repainting. This article paraphrases a recording that was transcribed automatically, without visual verification of any chart, and reports the speaker’s own account of demo executions rather than verified results. It is educational commentary, not investment advice, and no approach can guarantee a profit or the completion of a prop-firm evaluation.
