
Key takeaways
The Inner Circle Trader’s February 3, 2026 YouTube review analyzes March 2026 Nasdaq futures NQ on daily and one-minute charts, using the midpoint or consequent encroachment of a transcribed suspension block as the directional fulcrum.
Read the full summary
The Inner Circle Trader’s February 3, 2026 YouTube review analyzes March 2026 Nasdaq futures NQ on daily and one-minute charts, using the midpoint or consequent encroachment of a transcribed suspension block as the directional fulcrum. A wick above the midpoint and prior Friday high did not constitute sustained acceptance, so ICT retained a bearish view as price moved toward clustered sell-side liquidity, a new-week opening gap, and midpoint, quadrant, and eighth gradient levels derived from a daily wick. At seven minutes thirteen seconds, divergence between NQ and March 2026 E-mini S&P 500 futures ESH2026 was labeled SMT divergence and treated only as a qualifier, not a standalone selection or timing signal. Around nine minutes twelve seconds, the regular-hours opening range traded to its midpoint, closed the opening gap, failed to recover, and broke below the gap low. ICT favors retracements into inefficiencies, premium arrays, or prior highs rather than chasing opening-range breakouts. He warns that volatile range-bound conditions can trigger overtrading and revenge trading, recommends patience or stepping aside, and at twelve minutes forty-two seconds demonstrates smaller size and micro contracts. The 824-second public video had 83,481 views when read September 13, 2026. CME specifications cited for NQ include a contract unit of $20 times the Nasdaq-100 Index, March, June, September, and December listings, and financial settlement. No exact prices, entries, fills, slippage, profit and loss, or independently validated trading rules are provided, making the review retrospective education rather than reconstructable performance or investment advice.
How we researched this article
BestProps used document-based research from primary firm sources, checked September 24, 2026. The complete source list, scope, limitations, and commercial-state record appear near the end of this article.
In this February 3, 2026 technical review, ICT examines the March 2026 Nasdaq futures contract (NQ) across daily and one-minute charts. His central interpretation is that NQ tested a key daily midpoint, failed to establish sustained trade above it, and subsequently moved toward several downside reference areas. The discussion also emphasizes how difficult range-bound, volatile conditions can be for inexperienced traders.
Primary source: ICT Technical Review \ NQ Futures March \ February 03, 2026, uploaded February 3, 2026 on the channel The Inner Circle Trader.
ICT March Futures Daily Chart Framework
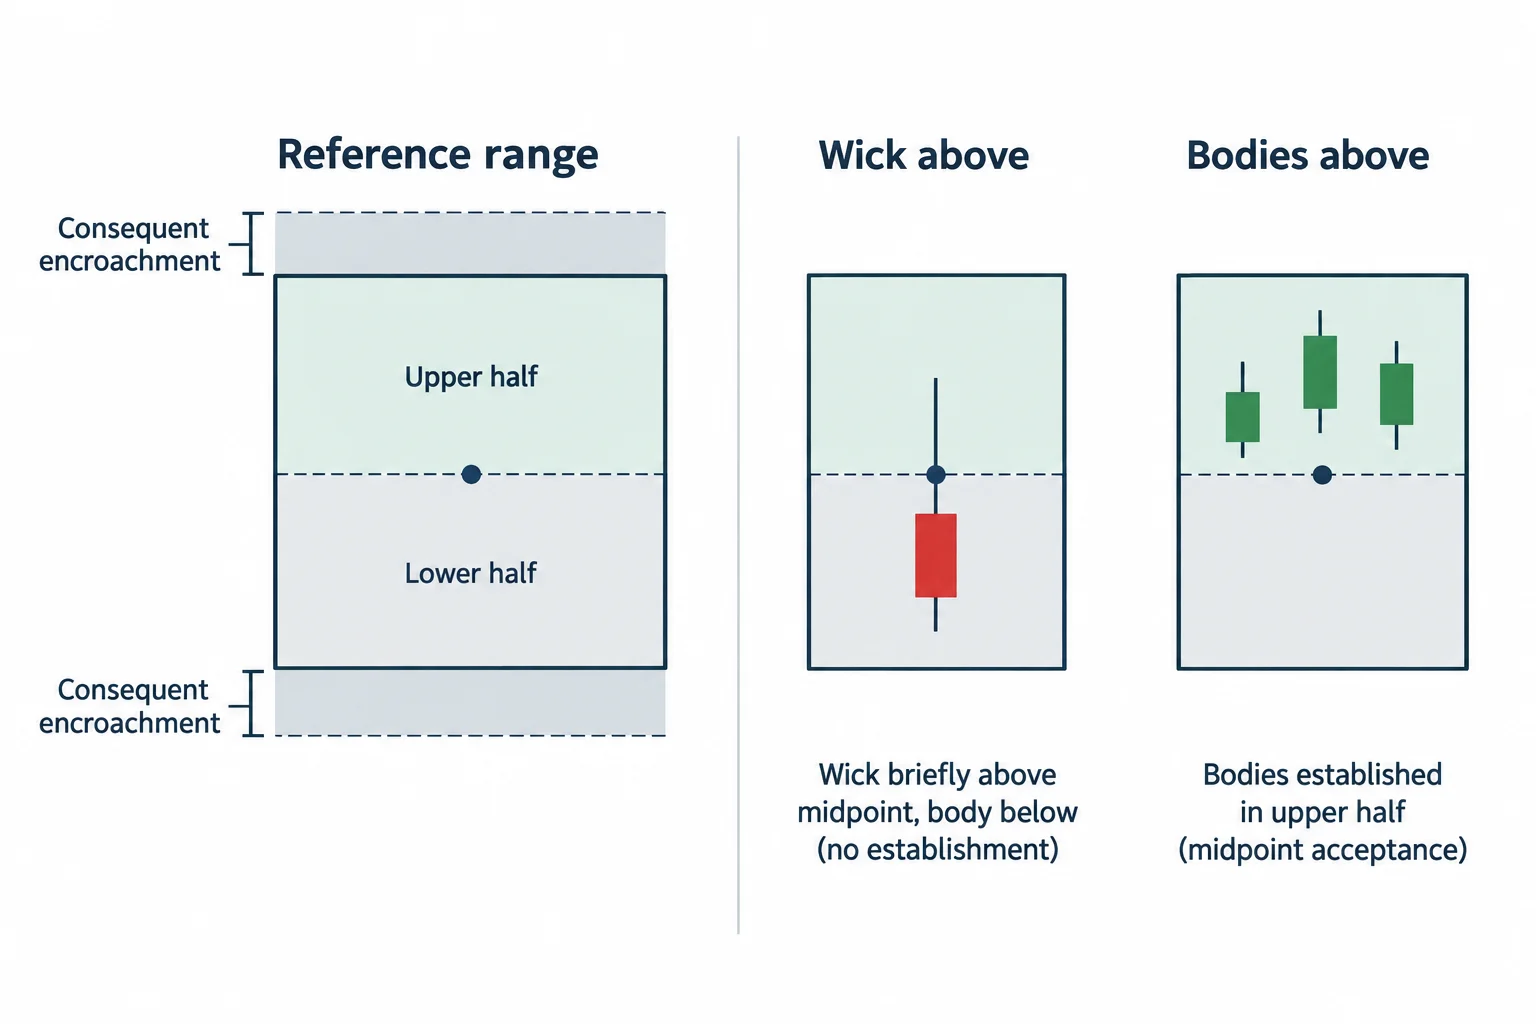
ICT begins with the March NQ daily chart. He identifies a structure that the automatic transcript renders as a “suspension block” and focuses on its midpoint, which he calls consequent encroachment. His stated framework is directional: remaining below that midpoint supports his bearish interpretation, while sustained price bodies in the upper half would favor a bullish scenario.
According to ICT, NQ traded above the prior Friday’s high and briefly entered the structure’s upper half, but only with a wick before falling back. He treats that rejection as evidence that price had not established acceptance above the midpoint. This is ICT’s interpretation of the chart rather than an independently tested trading rule.
ICT Wick Grading With Quadrants and Eighths
At 1:14, ICT addresses Fibonacci settings used to divide a range into quadrants and eighths. He describes these subdivisions as more precise “gradient levels” for analyzing wicks, which he regards as gaps or inefficiencies that can be graded.
The transcript does not provide the complete numeric settings, and the chart itself was not viewed for this article. The supported teaching point is therefore conceptual: ICT subdivides selected daily wicks and watches their midpoint, quadrant, and finer fractional levels as potential reference areas on lower time frames.
Why ICT Found March Futures Difficult
Before moving to the intraday chart, ICT notes that price was operating inside a broad range. At 2:47, he tells viewers that these conditions are especially difficult to read. He associates the conditions with geopolitical developments, metals-market activity, elevated volatility, and competing market influences, although the video does not present evidence sufficient to verify those causal claims.
His practical message is caution. He suggests that new traders consider stepping away rather than forcing trades inside a range they do not understand. He warns that frustration can lead to excessive trading, revenge trading, or account losses. Later, at 12:42, he says he is demonstrating smaller size and micro contracts because incorrect execution is always possible. These comments are risk-awareness guidance, not a promise that conditions will improve on a particular schedule.
ICT March Futures One-Minute Midpoint Rejection
ICT switches to the one-minute chart at 4:33. He explains that the premarket rally reached the consequent-encroachment area of the daily structure. Because price did not maintain trade above that level, he retained his bearish framework.
He then identifies downside reference points, including sell-side liquidity beneath clustered lows, a new-week opening gap, and gradient levels derived from a lower daily wick. His narration describes price moving away from the daily midpoint, reaching the new-week opening gap, and later progressing into the graded daily-wick area.
ICT SMT Divergence as a Trade Qualifier
At 7:13, ICT compares contemporaneous highs in NQ and the March 2026 E-mini S&P 500 contract (ES), which he identifies by its delivery month as ESH2026. He labels the mismatch an SMT divergence. Importantly, he explicitly says this divergence is a qualifier, not a standalone selection or timing tool.
Within his framework, the divergence added context while NQ was trading into inefficiencies near the previously identified daily reference. He discusses possible short locations in those inefficient or premium areas, followed by a decline through sell-side liquidity. The transcript documents his retrospective chart explanation; it does not establish actual entries, fills, slippage, or realized results.
ICT March Futures Regular-Hours Opening Range
ICT next reviews the range associated with the 9:30 regular-session opening. Beginning around 9:12, he says price traded to the range midpoint, closed the opening gap, failed to rebound, and then moved below the gap’s low.
He treats that lack of recovery as significant because it aligned with the larger bearish premise: NQ had already failed to establish itself above the daily midpoint. He distinguishes his approach from an opening-range breakout strategy. Rather than chasing a break, he says he looks for price to retrace against the anticipated direction into a specific inefficiency, premium array, or prior high.
ICT March Futures Trading Lessons
- Start with a higher-time-frame condition: ICT made the daily midpoint the fulcrum of his bullish-versus-bearish framework.
- Look for acceptance, not merely a touch: In his reading, a wick above the reference did not equal sustained acceptance above it.
- Map lower-time-frame objectives: He used clustered lows, a new-week opening gap, and subdivisions of a daily wick as reference areas.
- Do not use divergence alone: ICT expressly characterizes SMT divergence as supporting context rather than a timing signal.
- Adapt to difficult conditions: The closing section at 11:05 stresses patience, reduced exposure, and avoiding impulsive participation during high volatility.
This video is best understood as a retrospective demonstration of ICT’s own market framework. It can help viewers study how he links a daily reference to intraday liquidity and gap concepts, but it does not independently validate those concepts or provide enough information to reconstruct trades. Futures are leveraged and risky; this summary is educational and is not investment advice.
ICT March Futures February 2026 Transcript Notes
The mapped upload is titled “ICT Technical Review \ NQ Futures March \ February 03, 2026” and appears on the channel The Inner Circle Trader. Its watch page, read on 2026-09-13, lists a publish and upload time of 2026-02-03 at 11:14:42 in the UTC−:00 offset, a runtime of 824 seconds, 83,481 views, and a category of Education; the page was public and not unlisted. The recording therefore dates itself to the same calendar day the title carries.
ICT does not state an exact contract price, a fill or a profit-and-loss figure anywhere in the recording, so this article attributes none. The chart itself was not viewed for this article: no candle, level or marker is reproduced beyond ICT’s spoken description, and the chart illustrations on this page are AI-generated educational schematics, not captures of his platform.
Timestamps above come from automatic speech recognition of the recording’s complete audio (whisper-large-v3-turbo) rather than from uploader captions. Three passages were ambiguous in the recognition and are handled openly rather than silently corrected: the structure rendered “suspension block” is quoted as transcribed without correction; an opening phrase rendered as “positive balance a volume” was not relied on; and a mid-chart reference rendered “OlinX” near 8:20 is omitted. The phrase the recognition renders “consequent encouragement” at 1:21 is treated as consequent encroachment because the term is spoken clearly as “consequent encroachment” at 0:47.
An X post by ICT that an earlier version of this page relied on was not read for this article, so nothing from it is described here. The article is built from the recording itself.
Watch the original review on YouTube
This video cannot be played inside another website: the embedded player itself reports “Playback on other websites has been disabled by the video owner.” That response was read from the player on 2026-09-13 and again on 2026-09-14, so no player is reserved here and no embed is left blank. The recording is available directly on YouTube.
Watch ICT Technical Review \ NQ Futures March \ February 03, 2026 on YouTube ↗
ICT March Futures February 2026 Sources
Four references support this article: the mapped recording, the platform documentation that explains why it is offered as a watch card, the exchange’s own contract specifications for the product named in the title, and the federal rule that governs how simulated or hypothetical performance may be presented.
- [1] The mapped recording. ICT Technical Review \ NQ Futures March \ February 03, 2026, The Inner Circle Trader on YouTube. Watch-page metadata read 2026-09-13: public, not unlisted, publish and upload 2026-02-03, runtime 824 seconds, 83,481 views. Embedding is disabled by the video owner; re-tested from this site’s origin on 2026-09-14.
- [2] YouTube Help: Restrict embedding. The platform’s own documentation of per-video embedding controls, including blocking on all domains. It explains the owner-side setting behind the message quoted in the watch card above. Google controls that page and can change it.
- [3] CME Group: E-mini Nasdaq-100 Futures Contract Specs. The exchange’s own specification, read on 2026-09-13: contract unit of $20 times the Nasdaq-100 Index, product code NQ on CME Globex, quarterly contracts listed for March, June, September and December, and financially settled delivery. A re-check from this machine on 2026-09-14 was refused at the network level, so the quoted rows come from the earlier read and the exchange remains the authority on its current specifications.
- [4] CFTC Letter No. 01-60. A CFTC Division of Trading and Markets letter stating that, under Rule 4.41(b), presenting the performance of a simulated or hypothetical commodity interest account must prominently display the prescribed cautionary statement. That is the class of statement the upload’s own description carries, and it is why no performance is inferred from this review.
BestProps is not affiliated with The Inner Circle Trader, YouTube, Google, CME Group or the Commodity Futures Trading Commission, and no source listed here endorses this article, this site or any setup. ICT terms used on this page – suspension block, consequent encroachment, gradient levels, new-week opening gap, sell-side liquidity, SMT divergence and opening-range gap – are quoted as the presenter’s descriptive language for third-party educational concepts and are not official definitions. Nothing here is investment advice or a statement about present market conditions.

