
Key takeaways
ICT’s June 8, 2026 NQ lesson presents a discretionary long built on a small bullish fair value gap nested with a bullish inversion fair value gap, prior lows as sell-side liquidity, a nearby high as the intermediate target, and an intact daily volume imbalance as the larger upside draw.
Read the full summary
ICT’s June 8, 2026 NQ lesson presents a discretionary long built on a small bullish fair value gap nested with a bullish inversion fair value gap, prior lows as sell-side liquidity, a nearby high as the intermediate target, and an intact daily volume imbalance as the larger upside draw. He increases exposure to 20 contracts, later sells 15 and retains five, then makes further reductions as price fails to expand quickly. The daily imbalance midpoint is read near 29,560, with roughly 29,555 mentioned as a potential area to peel off remaining size, although the unseen chart, fills, prices, and results cannot be verified from the automated transcript. Risk management centers on moving the stop to consequent encroachment at a prior wick midpoint once lower inefficiencies are exhausted, while a candle body closing below that wick low invalidates the bullish interpretation. ICT says the footage is live rather than market replay three times, but the recording cannot prove this, and the title terms Reaper FVG and Terminus Daily V.I. are neither spoken nor defined. CME specifications value NQ at $20 per Nasdaq-100 index point and MNQ at $2 per point, both with a 0.25-point minimum tick, making NQ ten times the size of MNQ. The lesson is independent BestProps educational commentary linked to the original video on YouTube, not a verified trading system, signal, performance record, or investment advice.
How we researched this article
BestProps used document-based research from primary firm sources, checked September 24, 2026. The complete source list, scope, limitations, and commercial-state record appear near the end of this article.
This video documents ICT narrating an NQ long setup built around sell-side liquidity, a bullish fair value gap, an inversion fair value gap and a higher-time-frame daily volume imbalance. The lesson is less about a single entry price than about how ICT links several chart areas into a directional scenario, monitors whether price behaves as expected and reduces exposure as the move develops.
Primary source: ICT Reaper FVG – Long NQ Terminus Daily V.I. June 08, 2026. The transcript is generated by automated speech recognition, and the recording’s unseen chart cannot be independently verified from the text alone.
ICT Long Daily Time Frame Objective
At 0:13, ICT identifies a daily volume imbalance as the area into which he expects price to trade. After moving to the daily chart, he describes the imbalance as remaining intact following Friday’s sell-off. His working expectation is for price to retrace into the lower portion of that area before any meaningful short setup would be considered.
This establishes the session’s directional framework: nearby lows may provide liquidity for a dip, while the daily imbalance above serves as the proposed draw on price. ICT does not say that reaching the area automatically creates a short. Instead, at 7:09, he clarifies that price first needs to reach the orange-shaded area and that he may not short that day at all.
ICT Long Setup With Nested Bullish FVGs
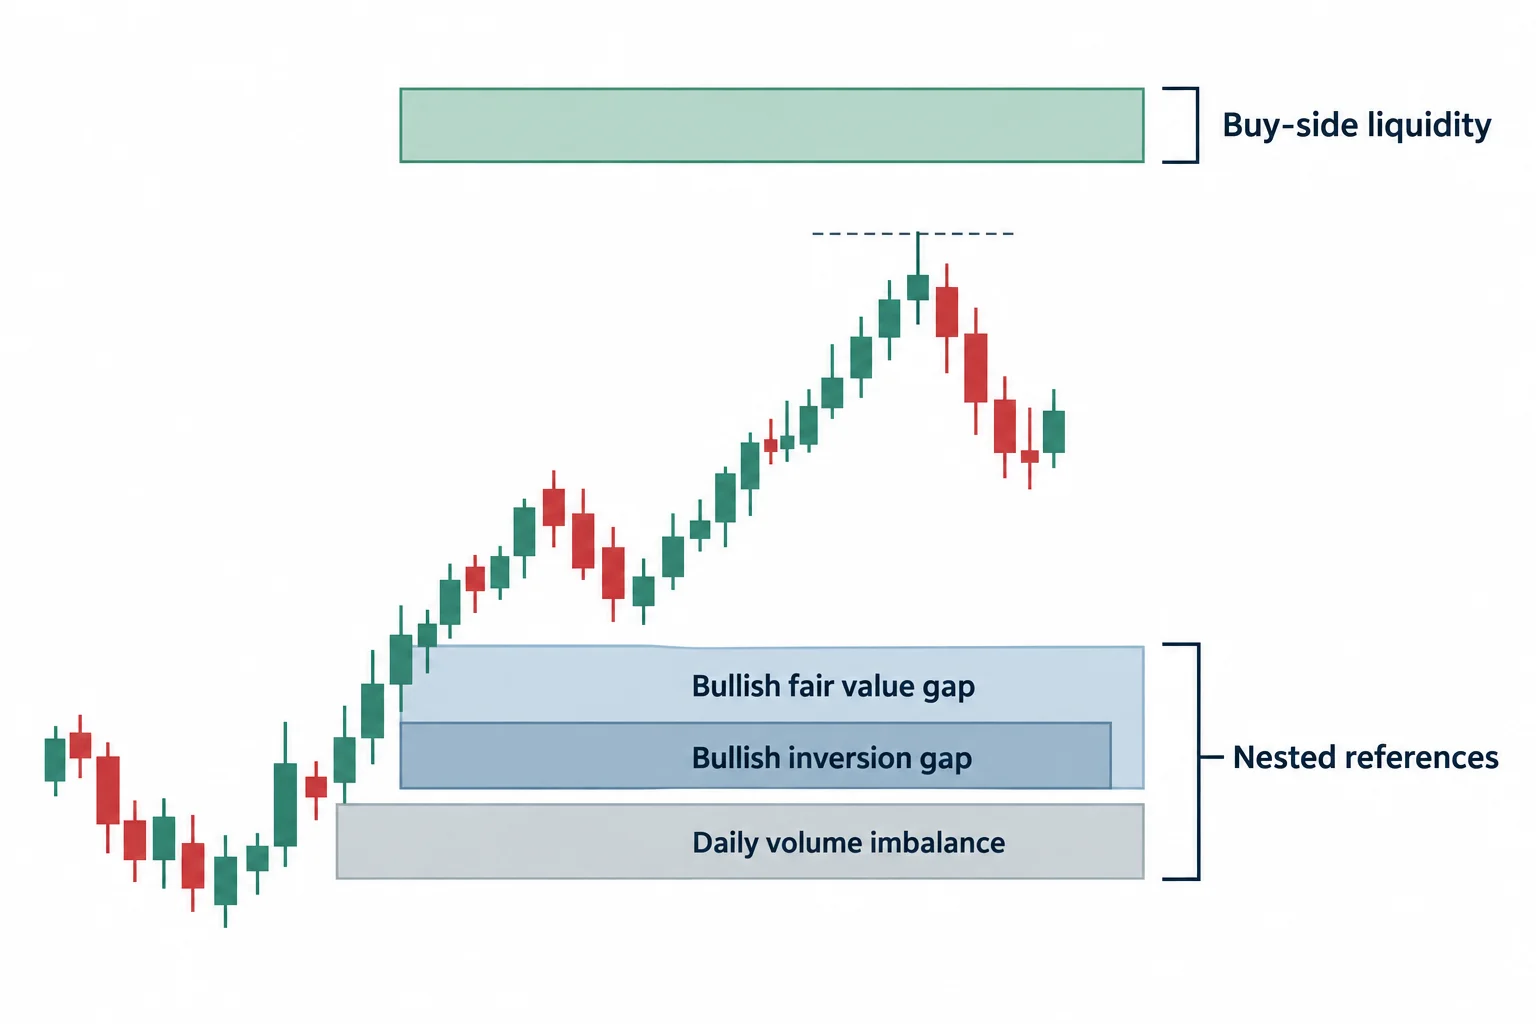
ICT turns to the lower-time-frame structure near 2:49. He identifies two overlapping or “nested” bullish references:
- A small bullish fair value gap.
- A bullish inversion fair value gap.
- Buy-side liquidity associated with a nearby high.
- The daily volume imbalance as the larger upside objective.
In ICT’s terminology, an inversion fair value gap is an imbalance that price has displaced through and then approaches from the opposite side. Here, he interprets the area as potential support. A conventional bullish fair value gap nearby adds a second reference for what he calls “discount sensitivity” (a favorable reaction from a lower portion of the immediate range).
He expects an energetic move through the nearby high, but his commentary also defines what would weaken that idea. Around 4:27, he focuses on candle bodies relative to a prior wick. A body closing below the wick low would be problematic in his interpretation, whereas respecting it would suggest that the bullish structure remains in control.
ICT FVG Wick Boundary for the Long
At 5:58, ICT discusses moving the stop toward the midpoint of a wick, a level he calls consequent encroachment. His reasoning is sequential: if price is not going to seek lower sell-side liquidity, and no lower inefficiency remains beneath the marked fair value gaps, the wick becomes the next relevant price-delivery reference.
This is an example of the session’s broader theme. ICT is not treating every marked area as equally important. He arranges them into a hierarchy: lower liquidity and inefficiencies represent adverse possibilities, the nested bullish gaps form the reaction zone, the nearby high is an intermediate objective, and the daily imbalance is the larger draw.
Two framing points run through the session. First, he states three separate times that the footage is not market replay (1:04, 4:21, 13:45), which is his counter to the hindsight objection rather than something the recording can prove. Second, he argues that everything he needs is represented by open, high, low and close, and at 6:39 he calls the approach “very simple”, “very visual” and “flawless”. That assessment is his own description of his method, not a verifiable claim about it.
The one numeric level he reads out is the consequent-encroachment measurement of the daily volume imbalance: at 8:23 he lands on a figure around 29,560, and he later describes 555– as the vicinity he would use to peel off remaining size (14:49). Those numbers come from automatic speech recognition of a spoken read-out, the chart itself is not visible to this review, and no order record is supplied, so treat them as his in-the-moment commentary rather than as verified chart coordinates.
ICT Long Position Management
ICT says he increases the position to 20 contracts near 3:50. Later, he narrates selling 15 and retaining five, then describes staggered reductions and stop adjustments. These statements are part of the audio commentary; the transcript by itself cannot confirm executions, fills, account results or exact chart prices.
His management becomes more defensive as time passes. Around 10:45, he acknowledges that targeting the midpoint of the daily imbalance may have been too ambitious. At 12:46, he notes that price has spent too many candles without continuing higher. That loss of immediacy matters because the original thesis called for a sharp, animated expansion.
He subsequently raises the stop after the nearby high is taken, removes additional exposure when the price action does not accelerate as desired and leaves a final portion subject to the existing stop. This demonstrates a practical distinction between being directionally correct and receiving the exact delivery expected. In ICT’s framework, sluggish movement can justify reducing risk even when the broader objective remains possible.
ICT Reaper Long Lesson Takeaways
At 15:14, ICT summarizes the setup as nested areas of discount sensitivity: downward displacement, a recovery above the displaced area creating an inversion fair value gap, and an additional imbalance supporting the bullish interpretation. He then returns to the daily volume imbalance as the higher-time-frame destination.
The general educational takeaway is to define a scenario before concentrating on execution: identify the proposed liquidity draw, map the price areas that should support the idea, specify the candle behavior that would undermine it and reassess if the anticipated expansion fails to appear promptly. These concepts are ICT’s market interpretations, not proof of a repeatable trading edge. The video should be studied as an example of discretionary chart reading rather than as investment advice or a performance promise.
Log the ICT Long as a Daily Study
The recording states its own conditions, so a study log can cite them directly: which higher-time-frame area was the proposed draw, which lower-time-frame gaps made up the reaction zone, which wick midpoint was used as the boundary, and which candle behaviour was said to break the idea. The checklist below is a generic process reminder for that kind of logging.
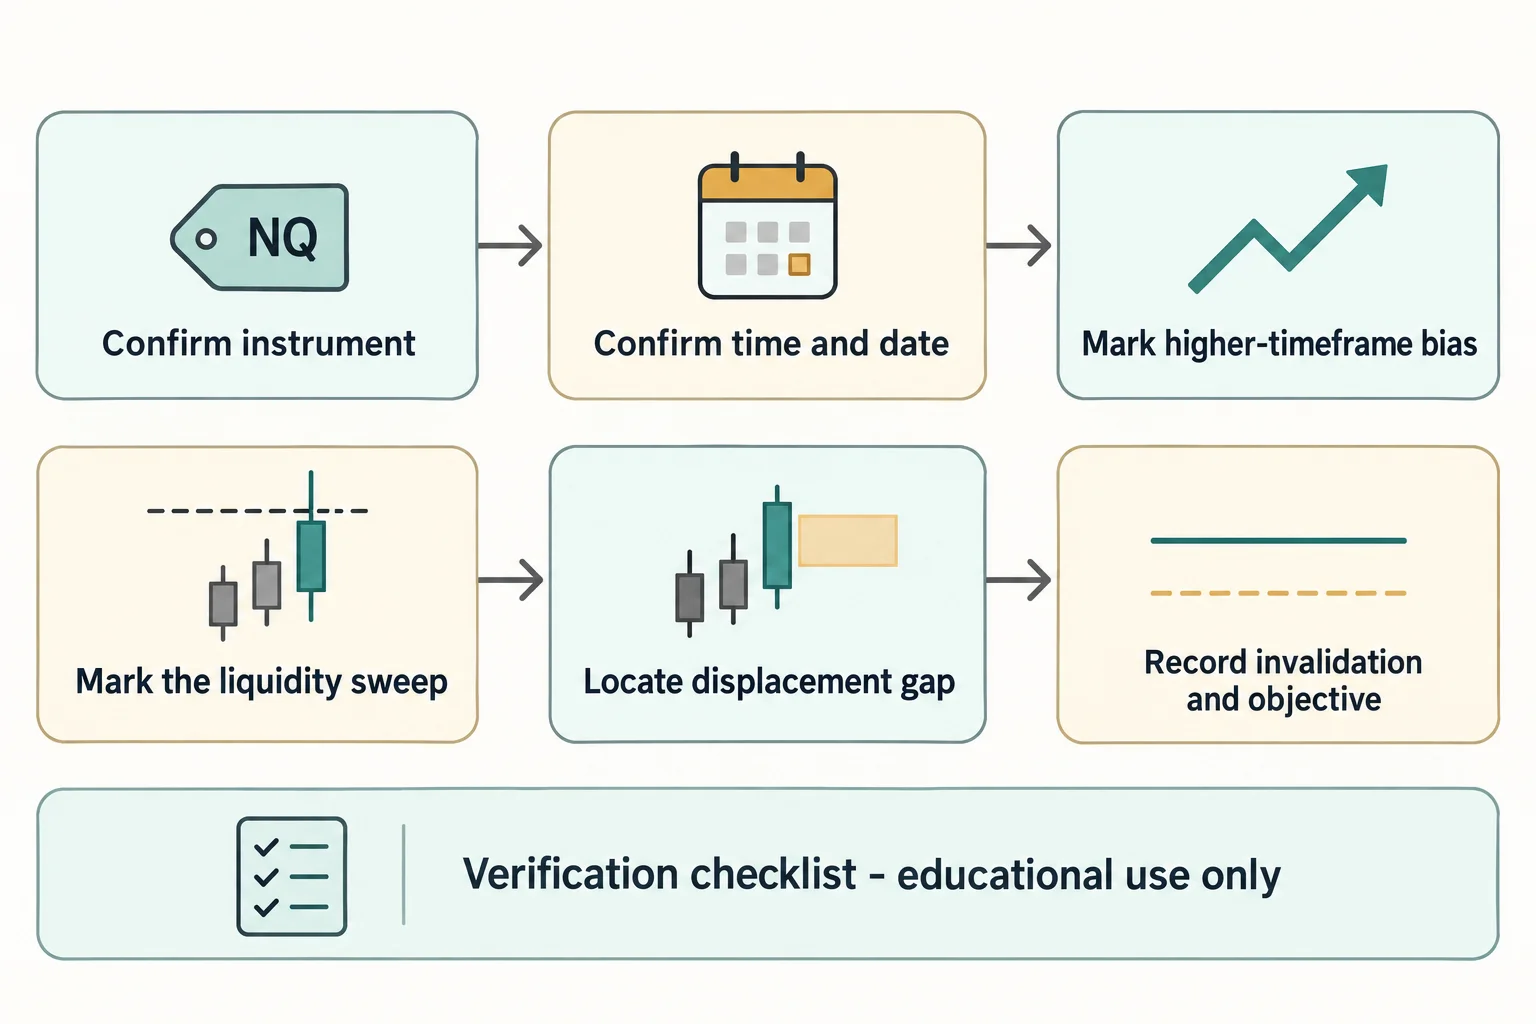
It is BestProps study material. It is not the recording’s chart, not ICT’s own notes, and not a signal.
Related ICT Reaper FVG Long NQ Daily Video
The mapped lesson is ICT Reaper FVG – Long NQ Terminus Daily V.I. \ June 08, 2026 on the channel The Inner Circle Trader, uploaded 2026-06-08. Its title uses two terms the recording never speaks or defines: “Reaper FVG” and “Terminus Daily V.I.”, where V.I. plausibly stands for the volume imbalance he describes repeatedly. The video description contains only a standard CFTC hypothetical-performance risk disclaimer. For this review the original audio was downloaded and transcribed locally with automatic speech recognition, and the timestamps cited above come from that transcript; BestProps has no affiliation with the creator and this is independent educational commentary, not a verbatim transcript.
Watch the original lesson on YouTube
When the lesson was checked in an isolated browser, the player reported: “Playback on other websites has been disabled by the video owner.” The lesson is therefore linked here instead of being embedded, and the full video can be watched on YouTube.
Watch ICT Reaper FVG – Long NQ Terminus Daily V.I. on YouTube ↗
ICT Long NQ Contract and Risk References
These references are official exchange and regulator documentation plus this site’s own rules tracker. They support the contract facts and the risk context below; they do not confirm any setup, timing or outcome described in the lesson.
What the NQ Long Means
CME Group’s published specifications state that the E-mini Nasdaq-100 futures contract is “$20 x the Nasdaq-100 index and has a minimum tick of 0.25 index points”.[1] The Micro E-mini Nasdaq-100 (MNQ) is documented as “$2 x the Nasdaq-100 Index” with the same minimum tick of 0.25 index points.[2] A phrase such as “long NQ” therefore refers to a specific leveraged contract, and the point value differs by a factor of ten between the two sizes, so confirm which one your chart and your firm actually use.
Regulator Guidance on ICT Trading Commentary
The CFTC advises the public that “Speculative short-term trading is always risky, but mixing it with unfamiliar products and markets, leverage, and advice from anonymous individuals is a recipe for disaster”, and it notes that “research has shown that after commissions the majority of individual speculators lose money”.[3] That is the standard this article applies when it treats a narrated session as a teaching example rather than as a validated edge.
ICT Funded Account Conditions
BestProps’ rules reference describes prop firm rules as the account conditions a trader must follow to pass an evaluation, keep a funded account and request payouts, and lists daily loss limits, maximum drawdown, consistency requirements, news trading, weekend holds and position limits among the conditions that most often catch traders out.[4] A position size such as the 20-lot described in the recording is a funded-account question, not just a chart question.
ICT Reaper Terminology Note
ICT-style terms such as fair value gap, inversion fair value gap, consequent encroachment and volume imbalance are not standardised across publishers, and tutorials, indicators and scripts marketed under these names are independent third-party products, not official material from the video’s creator and not endorsed by him. BestProps has not performance-tested any of them. A marked zone is a chart annotation, not a signal or a forecast.
ICT Long NQ Sources
- [1] CME Group: E-mini Nasdaq-100 Futures Contract Specs (read 2026-09-13)
- [2] CME Group: Micro E-mini Nasdaq-100 Index Futures Contract Specs (read 2026-09-13)
- [3] CFTC Customer Advisory: Understand Risks and Markets before Reacting to Internet Hype (read 2026-09-13)
- [4] BestProps: Prop Firm Rules (account conditions, daily loss limits, drawdown and consistency requirements; read 2026-09-13)

