
Key takeaways
In this Part 2 lecture, published on Saturday 1 August 2026, ICT walks through how he grades the regular-trading-hours opening range gap between the 9:30 a.m.
Read the full summary
In this Part 2 lecture, published on Saturday 1 August 2026, ICT walks through how he grades the regular-trading-hours opening range gap between the 9:30 a.m. Eastern opening price and the prior session’s 4:14 p.m. Eastern settlement print, then subdivides it into a midpoint, quadrants and octants. In his worked example the two anchors are 28,576.75 and 28,324.75, a 252-point gap whose midpoint is 28,450.75, the level he calls consequent encroachment and says is traded to by 10 a.m. 70% of the time. He blends that graded range with 7–9 a.m. PD arrays, the 9:30–10:30 first-hour dealing range, a breakaway gap, first-utilisation delivery and an inversion fair value gap, then demonstrates a scaled short with partial exits and negative extensions. He leaves one illustrated order as possibly unfilled and says he does not trade a prop account, so the recording is a chart-reading demonstration rather than a verified trade record; the on-screen chart was not available for visual verification here, and the plotted targets, any fills and the 70% figure remain his claims rather than measured results.
How we researched this article
BestProps used document-based research from primary firm sources, checked September 18, 2026. The complete source list, scope, limitations, and commercial-state record appear near the end of this article.
What ICT covers in this intraday lesson
The original lecture is Part 2 High Precision Secrets To Intraday Price Action, credited to The Inner Circle Trader and dated 1 August 2026, a Saturday. ICT opens the lesson by saying it is Saturday (4:20) and refers back to the previous day’s Traders Roundup (7:49). The session he walks through is therefore the prior Friday’s: he marks the 9:30 a.m. Eastern opening “Friday morning” against a settlement at “4:14 p.m. Eastern time” the Thursday before (34:58). He does not name the calendar date of that session.
His stated premise is observational rather than signal-based. He says he wants to understand how the market forms session, daily and weekly highs and lows, and that students should log and journal those mechanisms themselves instead of copying a named setup (0:07–0:23). He later argues the detail is derived from the daily chart and that “daily ranges are defined by a daily chart” (7:03). This article is independent commentary on that recording: it summarises what the speaker says, with the timestamped source, and does not endorse or verify the framework.
Grading the opening range gap
The applied part of the lesson starts when he turns to “applying the opening range gap” (9:11). He anchors the gap with two prices:
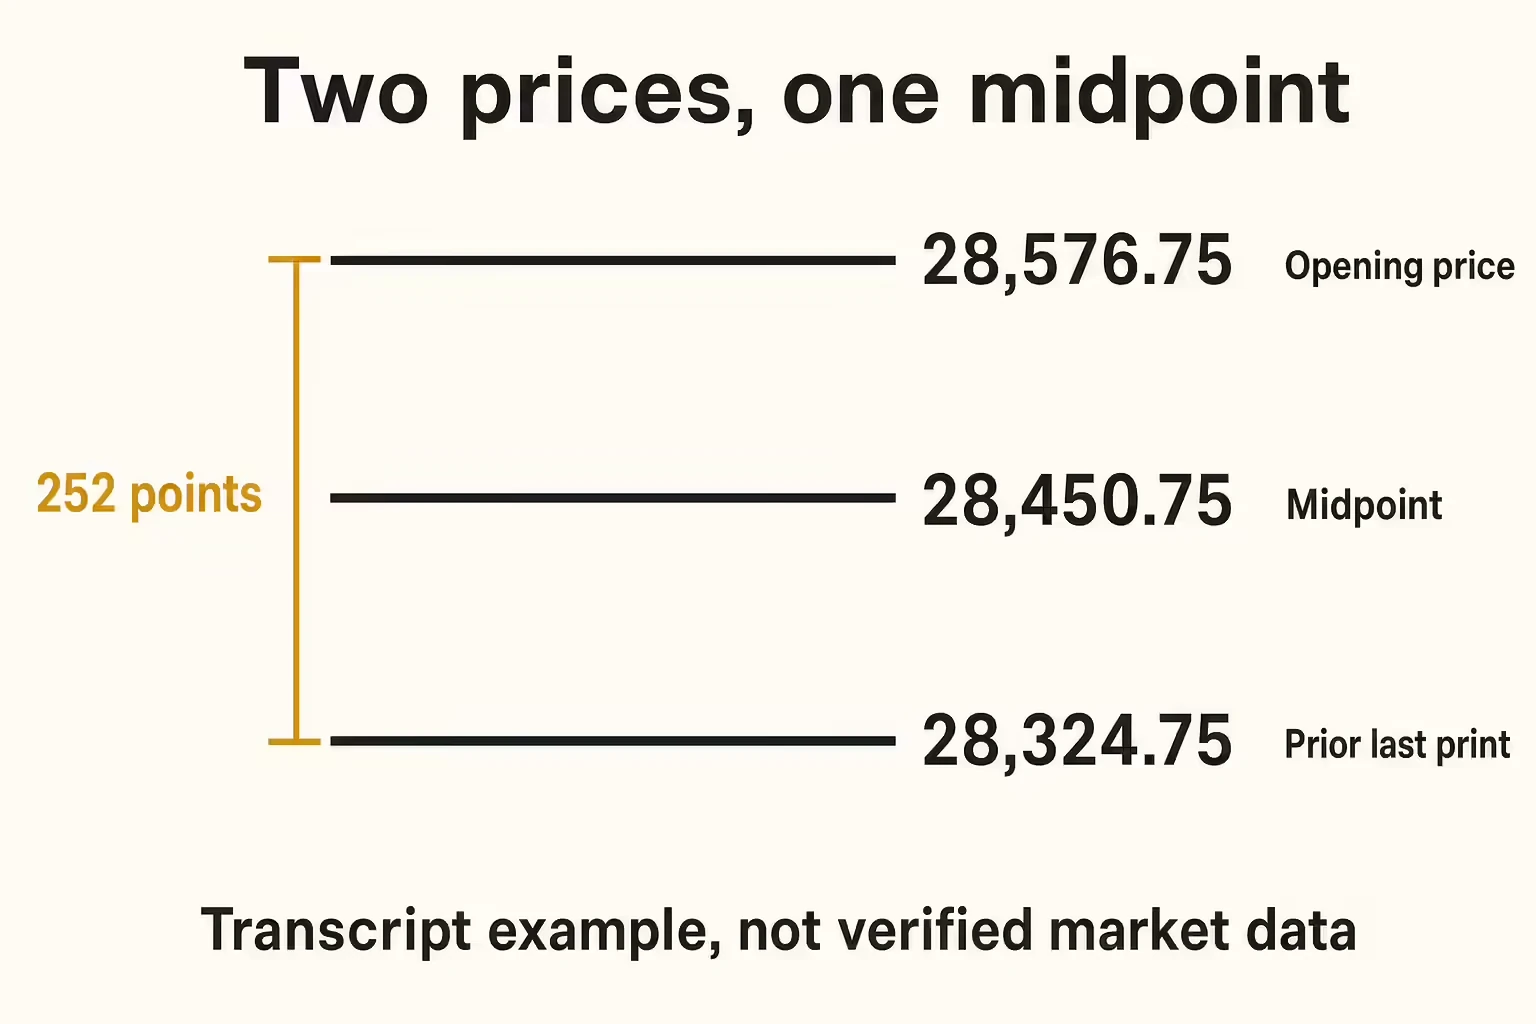
- the current session’s 9:30 a.m. Eastern opening price, which in his example is also the high of the gap (9:38); and
- the prior session’s last print, the 4:14 p.m. Eastern settlement, at 9:51 and 10:28.
He checks the marked levels and says, “everything is copacetic” (10:39). As transcribed, those two prices are 28,576.75 for the gap high and 28,324.75 for the gap low: a 252.00-point range with a midpoint of 28,450.75. Those figures come from the automatic transcript, not from a chart read here, with the low spoken at both 9:59 and 10:39–10:43 and the high at 10:36–10:39. They are attributed examples, not independently verified market data.
He then grades the range. Descending through the gap, he names the upper octant, upper quadrant, another octant, the midpoint (consequent encroachment), another octant, lower quadrant, a final octant and the gap low (19:15). He also describes a second convention for the gap’s lower anchor: when the market gaps higher and the 4:00 p.m. bell candle made a short-term high, he used that candle’s high as a quicker “gap fill” reference, a method he says he used trading the S&P in the 1990s before moving to the 4:14 p.m. final print (35:36–43:20). Because the two conventions sit at different prices, the lower objective in a divided range depends on which one is chosen.
These are price-point distances, not dollar profits. Translating a move into dollar exposure requires the actual contract’s point value and the position size. The transcript does not name the instrument on the chart, so the quoted prices alone cannot establish a dollar gain or loss. Check the exchange specifications for the contract you intend to study rather than assuming that every index future has the same tick size or point value.
The intraday gap midpoint and the 70% claim
ICT calls the midpoint of the gap consequent encroachment, and says it “gets traded to by 10 a.m.” in 70% of cases, noting that in the displayed example price reached it at 9:43 (11:08). No dataset, sample or test method for that percentage appears in the transcript, so it is a claim to be checked rather than a measured statistic. He treats the area above the midpoint as premium within the gap (16:54, 22:05).
Intraday time ranges and price arrays
The gap is not used on its own. He marks PD arrays inside the 7:00–9:00 a.m. window and blends them with the gap (11:23), notes a fair value gap sitting at the 9:30 opening price, a level he calls tethered (11:33), and adds the first-hour dealing range from 9:30 to 10:30 a.m. (11:53).
Most of the interpretation then turns on where candle bodies sit. Wicks can trade through a level while bodies close back on one side (16:04), and he labels a gap that forms at the upper quadrant after price consolidates between two arrays, followed by displacement lower, a breakaway gap (16:32–17:10).
ICT price arrays and inversion
One of the clearer definitions in the lesson is first utilisation. An array that was first traded into while the market was bullish and then sent price higher is, in his terms, buy-side delivery; when the same kind of area is later approached with the market bearish, he re-labels it an inversion fair value gap and looks for it to act as resistance instead (17:32–18:03, 23:04).
He corrects the marked range after saying there is no volume imbalance at one boundary: that boundary needs to be anchored to the wick low (23:40), and he points out a gap that existed before relative equal highs were taken out (22:18, 23:56). He also introduces what he calls an immediate rebalance, where the immediately following candle returns to the preceding candle’s low (24:26), and a bearish order block that price trades up into before selling off (20:32). He says his stated objective for the session was a move down to 28,400, which he had posted publicly (17:47); that social post was not read first-hand for this article and is not reproduced here.
ICT intraday workflow and the illustrated short
After the detailed markup, ICT offers a stripped-down version (34:44): mark the prior settlement and the 9:30 opening, measure the gap between them, treat the midpoint or the nearer reference as the easier objective, wait for price to trade back into the range and retest the opening price (37:58), and use a fair value gap as the entry area (38:20).
He then narrates how he would take it: one contract as price breaches the midpoint of the wick (39:19), a stop above consequent encroachment of that wick (42:04), and further adds if price returns into the lower part of the wick, pyramiding while the position is in drawdown (41:00). He is candid that one of the illustrated orders “may or may not have gotten filled,” and calls the sequence a presentation of his logic (40:45).
Two practical caveats come straight from the source. He says he does not trade a prop account and never has, which is why he does not carry those constraints, and he warns that a trader who cannot add to a losing position under a firm’s rules should not manage a trade that way (41:09). On a session as volatile as the one shown, he says the wide stop required is an argument for trading micros rather than full-size contracts (42:26). Firm-specific rules on adding to positions, maximum position size and daily loss limits are set by each provider and should be read from that provider’s current documents.
The recording also contains a material promotional disclosure: at 41:31–42:04, ICT thanks participating prop-firm partners and promotes the ICT discount code in connection with a St. Jude charity campaign. He says the associated money goes entirely to St. Jude rather than to him. That is his stated disclosure, not an independently verified accounting of donations or a current offer confirmed by BestProps.
Intraday exits and price projections
Exit management is presented as a ladder rather than a single target: a partial at the first objective, the bulk of the position, he says 75% to 80%, off when price reaches the standard consequent encroachment of the opening range gap (45:40), then a further partial at full gap closure with a small allowance for spread, which is where he mentions 28,367 versus 28,370 (46:12). Later, at 47:48–48:58, he describes taking some off at half gap and the bulk at full gap closure instead. The recording therefore presents more than one exit-allocation description, not a single fixed percentage rule. For a remaining runner he extends the same measured range below the gap low with −0.2, −0.5 and −1.0 levels, the last of which he calls one standard deviation (46:54–47:24), and he rolls the stop progressively as each objective is met (42:37, 43:07).
Separately, he demonstrates a projection built from a climax-reversal high: dragging a measurement from that high to the low and treating the range as a door whose hinge, or fulcrum, would swing the move equally into the opposite direction (27:01). He says the session “booked pretty much the low around those levels” (28:07), a reported outcome, not a verified trade record, and closes by warning that in this business you are never really right, which is why he frames the work as aiming at precision through process rather than certainty (50:53). He repeats that the skill takes extended study of old moves (6:50, 30:11).
Limits of this ICT intraday review
The chart in the recording was not available during this review, so every plotted level rests on the spoken transcript and on screen-read prices that the speaker states aloud. That transcript was produced by automatic speech recognition, which can mistranscribe both structure and specialised vocabulary: the same terms appear as “consequent encroachment,” “consequent encouragement” and “consequent corrosion,” and “octant” appears as “octane.” Nothing here should be read as a confirmation of plotted coordinates, candle shapes, order fills, or the order in which the illustrated targets were reached.
The 70% figure, the reported low “booked” at the projection levels, and the described reaction at each array are all claims made in the recording. They are not independently tested results, and the transcript contains no sample size, no cost assumptions and no out-of-sample check. Anyone testing the framework should write the rules down first, define the instrument, contract, data source and timezone, and record outcomes across many sessions, including the sessions where nothing happens. If session review is done in a replay tool, note that TradingView’s own documentation states that server-side alerts keep firing on real-time data, that new server-side alerts cannot be created in replay, and that trading orders are executed on real-time data while quotes displayed on the panel correspond to real-time data, so a replay chart is not a simulation of fills or spreads.

None of the above is a trading system. The lecture offers a way to organise observation around session times and measured price levels; it does not establish that any level will hold, that a gap will be filled, or that the described moves can be repeated. Position sizing, stop distance and firm rules all determine the consequence of being wrong, and a wide stop on a volatile session is an exposure decision as much as an analysis decision.
Watch the original ICT lesson
This article draws on the timestamped automatic transcript of Part 2 High Precision Secrets To Intraday Price Action. This is a transcript-based review, not a full-video visual review. A transcript records the speaker’s words; it is not independent proof of chart prices, fills or performance.
Watch the original lesson on YouTube
Open the original lecture on YouTube to follow the chart alongside ICT’s explanation. The timestamped links in this article point to the corresponding passages.
Watch Part 2 High Precision Secrets To Intraday Price Action on YouTube ↗
ICT price-action reading and platform documentation
- The original lecture (source video
BD7kqmgdBU8): the primary source for every timestamped statement in this article. Published 1 August 2026; public, not unlisted. - CME Group: E-mini Nasdaq-100 Overview: a product-specification starting point for readers studying that contract. It does not identify the unnamed instrument in ICT’s example.
- TradingView Help Center: How do I turn Bar Replay on?: platform documentation on what a replay chart does and does not reproduce.
- BestProps: Prop Firm Drawdown Rules: this site’s own comparison of drawdown calculation methods, which states that the page does not report first-hand account purchase, trading, support, identity-check or payout testing.
- ICT Archivist: Part 2 summary: an unofficial third-party summary of the same upload. It is not published, reviewed or endorsed by The Inner Circle Trader, it is not the recording’s transcript, and nothing in it is treated as a quotation from the lecture.
BestProps is not affiliated with The Inner Circle Trader, CME Group, TradingView or ICT Archivist, and no source listed here endorses this article, this site or any setup. Daily range, opening range gap, consequent encroachment, fair value gap, inversion fair value gap, volume imbalance, PD array, quadrant and octant are used on this page only as descriptive study terms attributed to the speaker. Nothing here demonstrates a tested, repeatable or profitable result, and no claim is made that any level, session or sequence predicts price or was verified on a live funded account. This is independent educational commentary, not financial advice.
