
How we researched this article
BestProps used document-based research from primary firm sources, checked September 14, 2026. The complete source list, scope, limitations, and commercial-state record appear near the end of this article.
Source note: this page is grounded in the timestamped transcript of the recording below — automated speech recognition of its full audio (local Whisper large-v3-turbo), not YouTube captions. The recording is a slide-based review of charts, and no chart imagery was available to the reviewer, so timestamp links point to what the speaker says, not to verified candle boundaries or levels. Entries, fills and account results are not verified anywhere on this page.
What the recording is
One Shot – One Kill Trade Setup Review was published by The Inner Circle Trader on 2026-07-07 with a runtime of 27:30 (the transcript matches at 1,650 seconds) and roughly 96,000 views when its watch page was read on 2026-09-13. It is not an entry tutorial: the narrator, publicly known as ICT, presents a slide deck reviewing a Nasdaq scenario he says he had already outlined, then draws lessons about selectivity from it.
He opens at 0:05 by explaining that he switched to slides to stay focused and avoid rabbit trails, and at 0:26 that he is recording earlier than planned. The published video description carries the standard CFTC Rule 4.41 hypothetical-performance disclaimer, which is the usual notice attached to trading content that discusses simulated or hypothetical outcomes; the substance of that rule is discussed under claim limits below.
The daily framework he reviews
He starts on the daily chart and narrows to one shaded area. At 0:42 he points to two reference points he says were not given the day before: a discount wick and an up-close candle. The boundaries he draws from them are the opening price of that last up-close candle — which he calls a change in state of delivery, and which he also labels his order block — and the low of the discount wick (1:54).
He then reads out a midpoint. At 2:23 he puts consequent encroachment of that daily candle at 29,221.75 — the only specific price he states in the recording. Automated speech recognition can mishear digits, so treat that figure as the number he spoke rather than a verified chart value; no chart image is offered as proof of it. He adds at 2:28 that price traded down into that level, breached the previous Thursday’s low, and that he did not count Friday because there was no trading he considered meaningful.
The rule he attaches to the two halves is conditional, and it is the part most easily tested. At 3:35 he says that while price is above the midpoint, the upper half remains relevant because it could simply turn bullish there; only a close below consequent encroachment justifies switching attention to the lower half (3:51). He also distinguishes his order-block definition from supply-and-demand teaching at 4:55, noting that a larger-bodied candle elsewhere on the chart would only become the reference if price ever traded below it.
From the daily chart to the 15-minute view
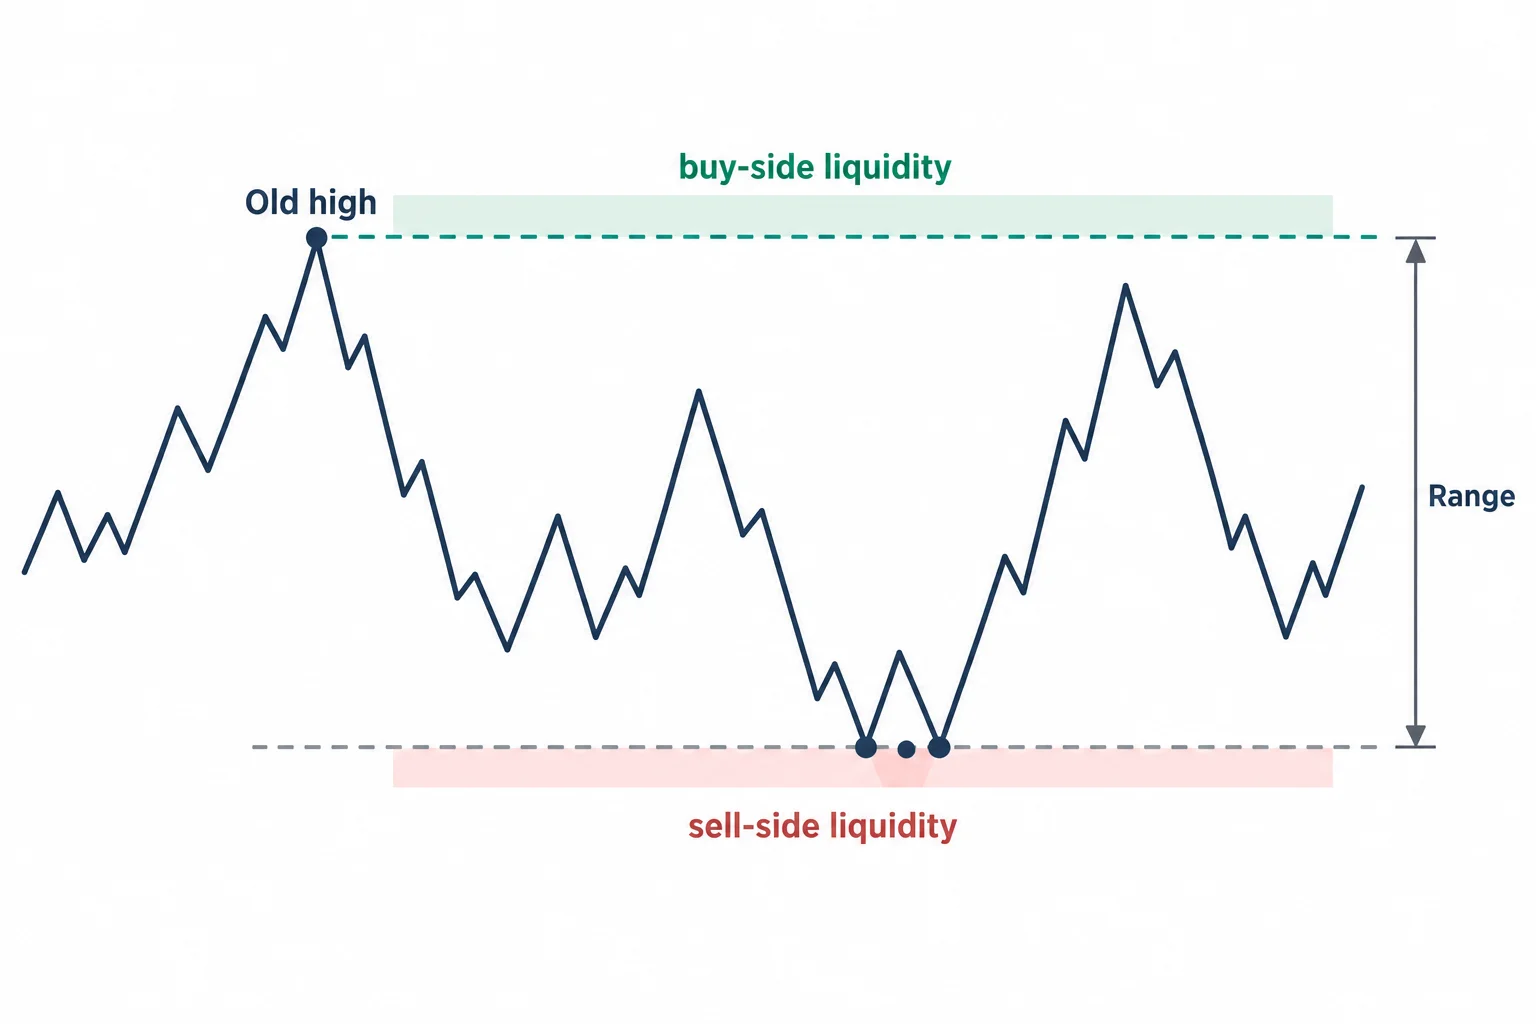
He calls the 15-minute chart a bellwether timeframe that can frame intraday and scalping work and keep a trader in sync with a move already under way on a higher timeframe (1:05). Carrying his two daily boundaries onto that chart, he marks an old high as resting buy-side liquidity and the lows beneath as sell-side liquidity (5:24).
He describes the sequence he says he had framed in advance: the Monday 9:30 a.m. Eastern open traded down, turned up, took the buy side above the old high and pushed into a gap; from there he wanted an attempt to roll over and go after the sell side below. He says this was published before the fact in a Monday morning post and a Monday lecture with his son (3:08) and that he restated it in a follow-up video the day before this recording (10:13). That is his account of the timing; this page cannot check the original post or lecture.
He is careful about objectives. At 8:05 he says he was not interested in a position as deep as the daily discount wick and preferred what he calls low-hanging-fruit objectives — the nearer lows — with a deeper target optional. That distinction between an ambitious framework destination and a nearer, more conservative objective is stated explicitly and is one of the more transferable parts of the review.
What he says the market did, and how he read the candles
He presents the later movement as confirmation: price traded down into the daily discount wick, swept the sell-side liquidity, and then returned sharply back inside the range (8:44). Along the way he points to a gap he calls an inversion fair value gap (8:20), a “SIBI” (8:29, 15:01) and the same structure he labels the first presented fair value gap of Monday’s opening range (14:32), plus a midday window he calls the lunch macro (11:58). He names the same structure “Model 2022,” his oldest model on the channel, and equates it with optimal trade entry (10:48). The transcript’s rendering of the exact lunch sub-window is internally inconsistent, so no precise time window is asserted here beyond his description of a midday session.
Two moments are worth more than the labels. First, at 16:17 he reads a gap by candle bodies and wicks: the bodies stayed inside the shaded gap while wicks kept returning into it, which he interprets as the market no longer offering progressively higher prices — explicitly rejecting that this is a measure of buying or selling pressure. Second, at 17:29 he corrects one of his own live annotations, explaining that a small difference between one candle’s close and the next candle’s open made the area a volume imbalance rather than the boundary he originally drew during that morning’s lecture. He separates that self-correction from result-fitting, but whatever the intent, the episode shows the reference lines in this framework being redrawn on closer inspection — a caution for anyone replaying the chart later.
He also dismisses tooling: at 18:56 he says the candle bodies already show where the volume sat and that volume profile, footprint charts and similar additions are unnecessary. That is his own position, not an established finding about those tools.
What “one shot, one kill” means in his own words
The title is a statement about frequency, and he defines it more concretely than most third-party summaries of the term. At 25:06 he describes short-term trading as looking for a two-to-five-day price run and being out by the end of the week. At 25:18 he says he will not hold anything over a weekend now because of gap risk, and at 25:31 he gives his working definitions: day trading is being flat before the 5 p.m. Eastern settlement, while anything that survives a session close — he uses the six o’clock restart — counts as two days of trading and therefore as short-term.
He repeats the selectivity argument after describing the consolidation that followed the move. At 21:31 he treats a retracement back into a range as a normal follow-through and a reason not to press for another trade; at 24:02 he says the worst mistake after a good result is to assume consistency means large wins every day; and at 6:38 he states plainly that his own trading is finished for the week, with the remaining sessions given to lectures. He also frames forced participation as the failure mode, saying at 9:04 that a trader who cannot frame an idea from the daily chart is better off sitting on their hands.
Claims in the recording that are not evidence
He states at 22:16 that the move was a six-figure day rolling from the previous session into this one based on analysis he had shared, and then at 22:29 poses a hypothetical about what someone with 20 contracts on a simulated prop account could have collected. No order tickets, fills, contract counts, statements or third-party audit appear in the recording or on the page reviewed, so none of that is verified here, and the 20-contract passage is explicitly hypothetical.
The relevant standard is public. Title 17 of the Code of Federal Regulations, section 4.41 requires that simulated or hypothetical results be presented with a specific disclaimer — it states that such results “do not represent actual trading” and are “subject to the fact that they are designed with the benefit of hindsight” — and it constrains testimonials unless they disclose that a testimonial “may not be representative of the experience of other clients” and is “no guarantee of future performance or success”.[2] The recording’s own description carries the Rule 4.41 disclaimer text, and that disclaimer is the reason a spoken result claim should be read as promotional framing rather than as audited performance.
He adds a risk warning of his own at 20:13, saying the first 45 seconds of that morning produced more than 100 handles on a single one-minute candle, and that large size without a stop or a plan can be wrecked quickly in those conditions. That volatility description is his, and it is the same environment in which the reviewed move took place.
What the recording does not establish
It cannot confirm the entry, the size, the fills or the exit of the trade discussed, and it does not show the account. It cannot verify that the analysis was published before the move; that rests on his statement about a Monday post and lecture. No chart imagery was inspected for this page, so the shaded gap, the wick boundaries, the 29,221.75 midpoint and the corrected volume imbalance cannot be checked against the drawings, and the transcript’s rendering of some spoken numbers and of one midday time window is inconsistent. Where a number was uncertain it has been either attributed with that caveat or left out.
Third-party descriptions of “one shot one kill” circulate widely and often attach requirements this recording does not make — a 20-week lookback, Monday-to-Wednesday trading, mandatory London or New York windows, or fixed pip targets. Nothing in the transcript supports those as the model’s rules; what it supports is the definition above, in the speaker’s own words.
If you want to test this kind of review on your own charts
The following is general practice, not a transcription of his method, and it does not depend on any level being valid:
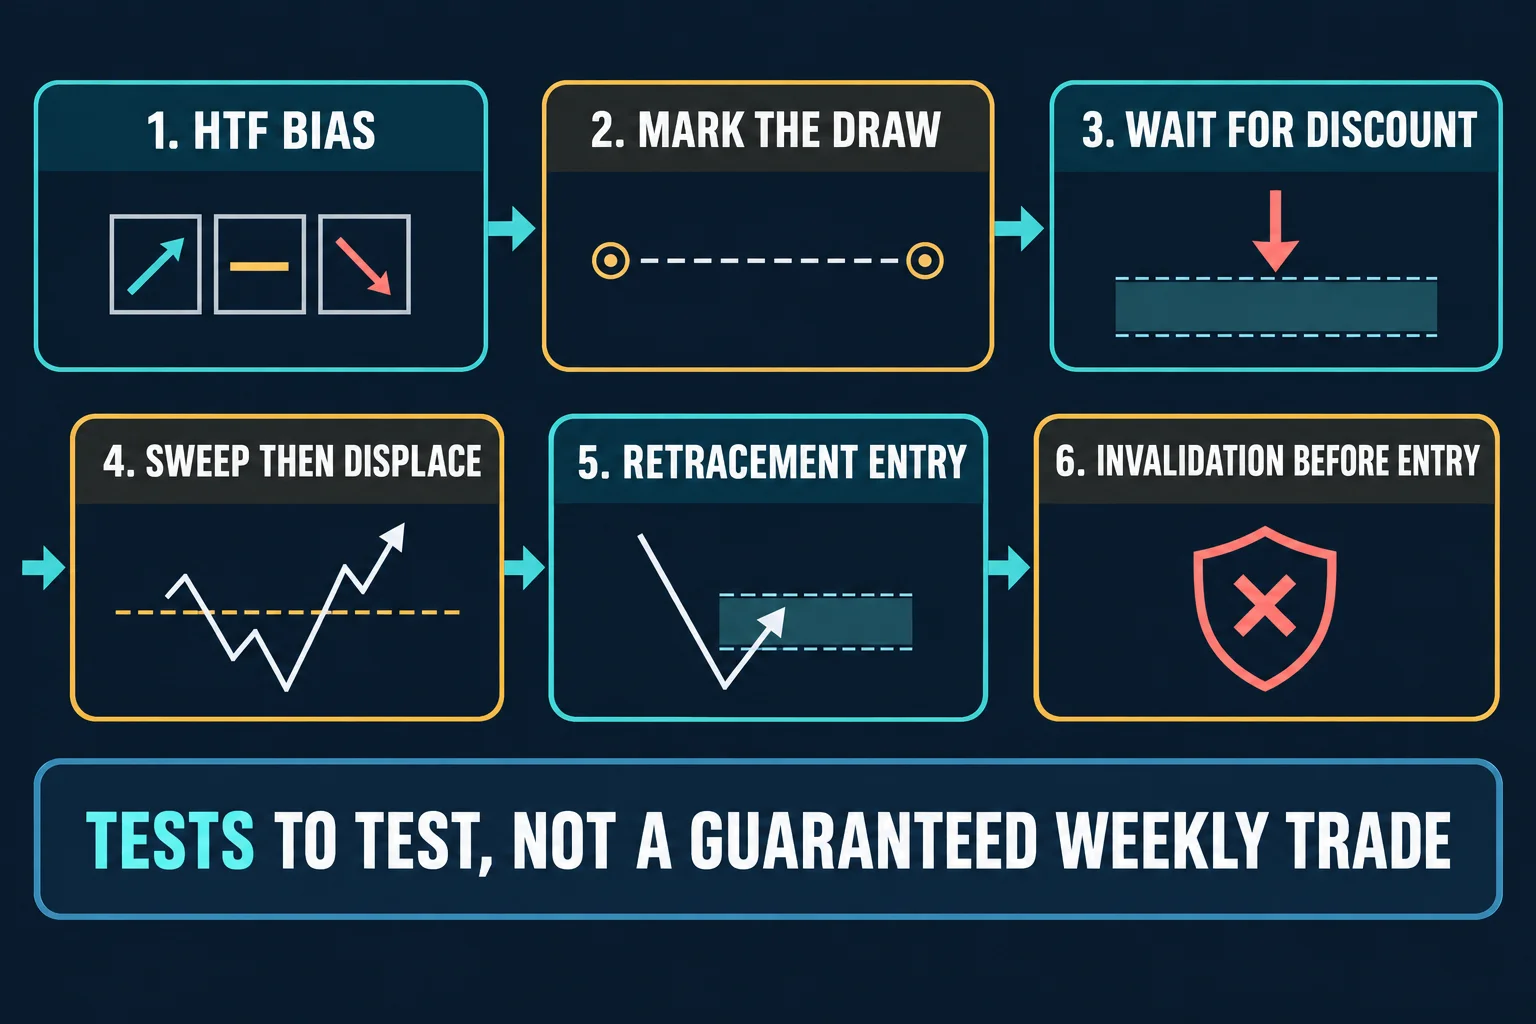
- Write the reference before the session. Fix the candle, the gap or the range you are using and the midpoint you will treat as decisive, so the test is not repainted later. This recording contains a live example of a reference line being redrawn on closer inspection.
- State what invalidates the idea. The close-below-the-midpoint condition here is a concrete example of a rule that can be written down, checked and counted.
- Separate the framework objective from the realised one. A distant target can anchor a direction while a nearer objective carries the actual risk, provided the rule is fixed in advance.
- Budget for volatility inside the risk. Oversized positions and wide candles are the same problem; position size should follow the distance to invalidation and the account limit, not the size of the expected win.
- Quote your own account limits. Drawdown method changes the arithmetic of every trade. This site’s reference states that “a static drawdown floor is fixed from the starting balance” while “a trailing drawdown floor moves up after profits and usually never moves back down”, and warns that its comparison “is not a universal ranking” because rules differ by firm, program, stage and account size.[3]
- Name the session you are testing. A midday window is a chart setting rather than an exchange-published definition: NinjaTrader’s documentation states that “Trading Hours Templates dictate the session start and end times for an instrument displayed on a Chart” and that a chart can be set to show “Regular Trading Hours (RTH) instead of Extended Trading Hours (ETH)”.[4] Two traders can therefore be reviewing the same instrument with different session boundaries.
- Record outcomes in risk multiples. Points or handles do not compare across instruments, and a day’s result measured in currency is not a model statistic.
Related recording on YouTube
Watch the original recording on YouTube
This recording cannot be played inside another website. An embedded player test run on 2026-09-13 from a BestProps page origin returned, from the player itself, “Playback on other websites has been disabled by the video owner”, while a control video in the same test played normally, so the test itself was working and no player area is reserved here.
Sources for the recording, performance-claim standards and account limits
Four references were read directly on 2026-09-14 for this revision: the recording’s own watch page and description, the federal rule governing simulated-performance advertising, this site’s drawdown reference, and the chart-platform documentation that defines trading sessions. None of them reports an outcome for the reviewed setup, and none endorses this page.
- [1] The Inner Circle Trader: One Shot – One Kill Trade Setup Review (published 2026-07-07, runtime 27:30; transcribed locally from its own audio for this page)
- [2] eCFR: 17 CFR 4.41 — Advertising by commodity pool operators, commodity trading advisors, and the principals thereof (simulated or hypothetical performance disclosure and testimonial limits; read 2026-09-14)
- [3] BestProps: Prop Firm Drawdown Rules by Calculation Method (static versus trailing floors; read 2026-09-14, page states its sources were checked August 1, 2026)
- [4] NinjaTrader Knowledge Base: Trading Hours Templates — Desktop (session templates and RTH versus ETH chart settings; article updated 8/14/2026, re-read in a rendered browser 2026-09-14)
BestProps is not affiliated with The Inner Circle Trader or with NinjaTrader, and no source listed here endorses this article, this site or any setup. Terms such as order block, change in state of delivery, fair value gap, inversion, SIBI, consequent encroachment and lunch macro are used on this page only as descriptive labels taken from the recording; no claim is made that any of them repaints less, predicts price or was verified on a live account. The recording was transcribed from its own audio and reviewed against that transcript; nothing here demonstrates a tested, repeatable or profitable result. This article is educational commentary and is not investment advice.
