
Key takeaways
Inner Circle Trader’s NQ Futures Weekly Range Market Wizardry recording reviews one NQ futures week from daily to one-minute charts, using a premium new week opening gap as the initial upside draw and daily relative equal lows at a stated but unverified 28,512 as the eventual discount target.
Read the full summary
Inner Circle Trader’s NQ Futures Weekly Range Market Wizardry recording reviews one NQ futures week from daily to one-minute charts, using a premium new week opening gap as the initial upside draw and daily relative equal lows at a stated but unverified 28,512 as the eventual discount target. Wednesday’s rejection of the opening gap and failure to reclaim the wick midpoint, called consequent encroachment, supported a bearish Thursday and Friday low resistance liquidity run into the lows after CPI and PPI volatility passed. The optional TGIF rule measures Wednesday’s weekly high to Friday’s low and looks for a 20% to 30% retracement, where ICT says the week closed. Friday timing centers on the seven a.m. Eastern premarket and nine thirty a.m. open, followed by a break below the target lows, short-covering rally and return toward Friday’s midnight open before the five p.m. close. ICT recommends archiving weekly charts, comparing gaps from the four fourteen p.m. settlement to the next nine thirty a.m. open, and tracking overnight Globex highs, lows and equal levels from the six p.m. restart. One reported trade took partial profit at consequent encroachment before its final single contract was stopped, but no fills, account statement or full risk parameters are shown. The framework is educational rather than a self-contained or tested system, its predictive value is asserted from one selected week, and ICT warns that paid Telegram mentorship, mirroring or copy-trading offers using his name are scams because his material is free.
How we researched this article
BestProps used document-based research from primary firm sources, checked September 24, 2026. The complete source list, scope, limitations, and commercial-state record appear near the end of this article.
The mapped source for this page is NQ Futures Weekly Range Market Wizardry, an Inner Circle Trader recording in which ICT reviews one full trading week on NQ futures from the daily chart down to the one-minute chart. His central claim is that the week’s directional framework was set out during Monday’s lecture with his son and then confirmed day by day as each session supplied more information (3:46, 14:02).
The lesson is not a self-contained system. It leans on ICT terminology (suspension blocks, imbalances, consequent encroachment, draws on liquidity, the new week opening gap and TGIF) and it repeatedly refers viewers back to lectures published earlier in the same week. This page is written from the recording's own automatically transcribed audio, so it can document what he says and what he reports doing, but it cannot verify his chart markings, his fills, or the contents of those earlier recordings. This is independent educational commentary, not official ICT material and not investment advice.
ICT Weekly Range Framework for Monday
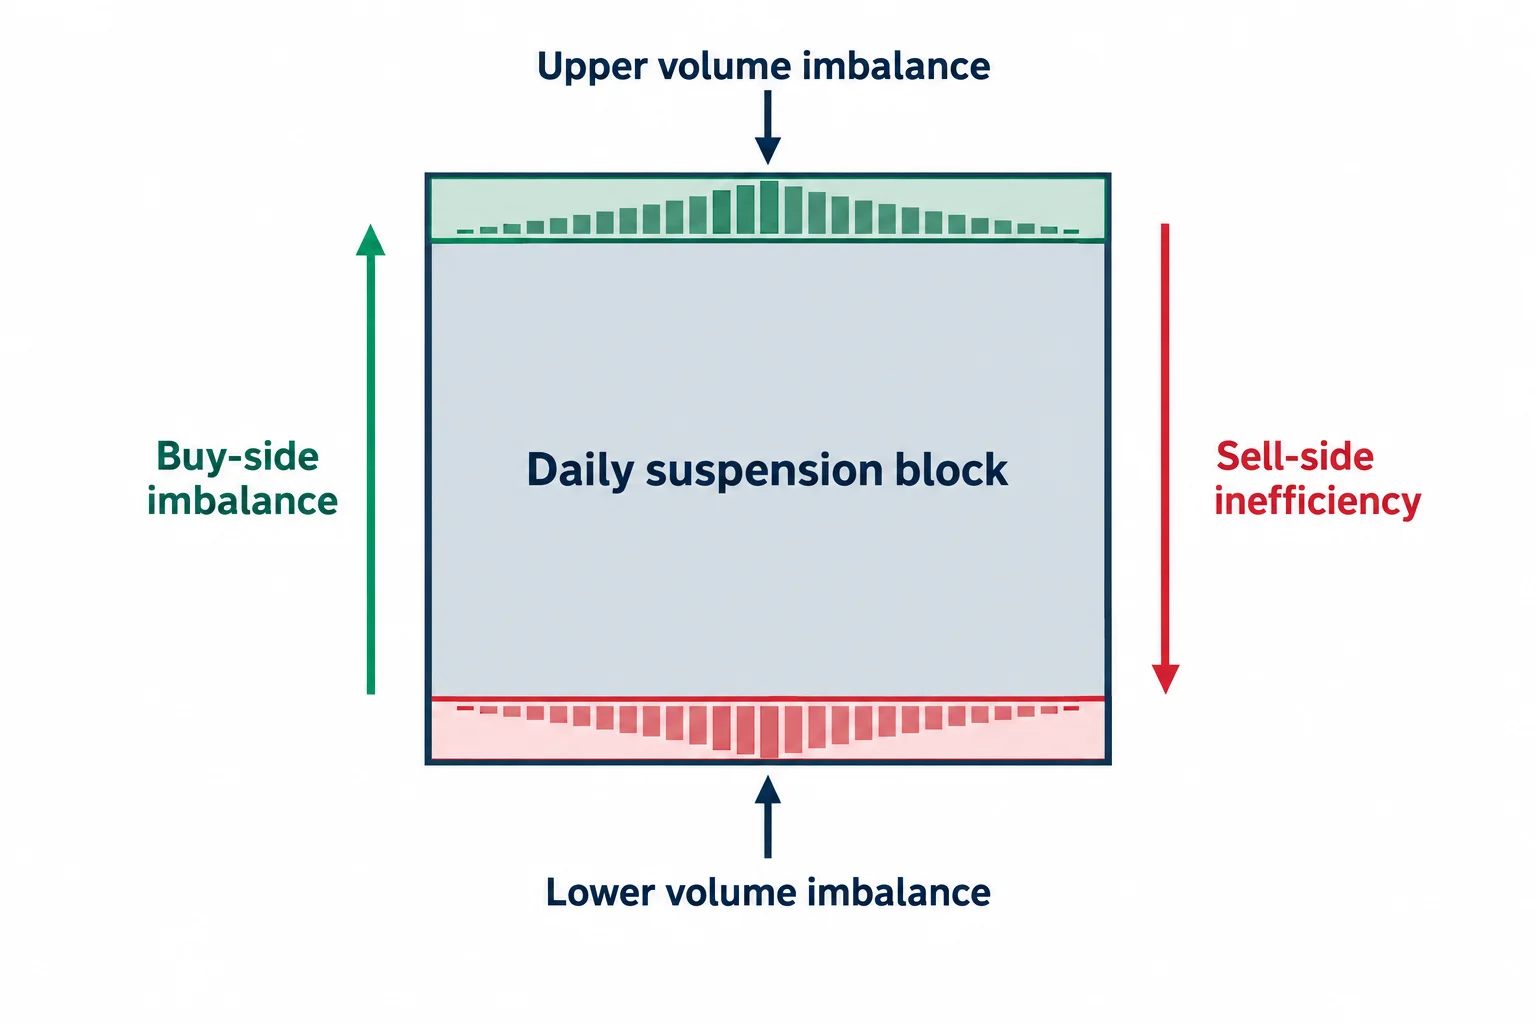
ICT opens the chart discussion by highlighting what he calls a daily suspension block: a buy-side imbalance with sell-side inefficiency that carries a volume imbalance at both its high and its low (3:46, 4:35). He describes the week as opening inside the middle of that inefficiency, with the new week opening gap sitting in its premium portion, and he treats the gap as the week's upside draw, the place price was expected to travel to before turning lower (7:06, 5:46).
He pairs that with a downside objective: the daily relative equal lows, which he calls the week’s discount draw on liquidity (16:09, 16:19). The two-way structure is the core of his argument: a premium gap above that should attract price one last time, and a discount pool below that should be the eventual destination.
Two things about this deserve separating. The idea of mapping a higher-time-frame premium and discount objective is genuinely useful as an organising exercise, and it is the part a reader can copy. The claim that the specific path was known beforehand is his characterisation, and confirming it would mean reviewing the earlier lectures he points to rather than taking this retrospective summary as proof.
How Wednesday Confirmed the ICT Weekly Range
He says Monday traded down into a lower volume imbalance and then returned up into the new week opening gap, which was what he had described in advance (10:00). Wednesday is the pivot in his narrative: price reached the opening gap with a wick but could not overcome it, and the candle body closed lower than the gap’s opening level (10:14, 11:35).
From that candle he derives a reference he calls the consequent encroachment (the midpoint of the wick) and treats it as a level price is not allowed to reclaim. He notes that Thursday traded up toward it without touching it, and reads that failure as weak, bearish order flow on a day he had said would resolve lower (12:30, 12:51). That reading rule, bodies versus wicks around a midpoint, is the mechanism he repeats for the rest of the review.
When the ICT Weekly Market Gets Easier
ICT recalls telling his son that Monday through Wednesday would be the hardest stretch for a new student because the week carried CPI and PPI releases, and that trading should become straightforward after Wednesday’s afternoon session (10:42, 11:01). He labels the expansion that followed low resistance liquidity run conditions (clean, directional runs) and says the same character of delivery showed up on Thursday and Friday (11:06, 15:28). He presents Thursday and Friday as wide-range sessions that delivered straight into the daily relative equal lows (15:42, 16:03).
The named-event claim (that CPI and PPI explained the midweek difficulty) is his explanation and is not established by the recording. The part worth keeping is the conditional structure around it: expect the middle of a data week to behave differently from the end of it, and expect the character of delivery to change once the scheduled events have passed.
Friday Timing in the ICT Weekly Market
The sharpest practical point in the recording concerns time rather than price. Looking at a Friday morning where relative equal highs sat just above the market, he argues they did not have to be reached first, because the larger weekly downside objective was still unfinished and only Friday remained to complete it (31:18, 31:40). He expected the volatility needed for that run to come from the session opens, the 7:00 a.m. Eastern premarket start and the 9:30 a.m. opening bell (31:43, 32:10).
He then walks through the sequence he says played out: premarket began selling, a swing at the 9:30 open pulled back, price ran below the daily relative equal lows he had named, and a short covering rally followed before price worked back to Friday’s midnight opening price (32:10, 34:00, 34:10, 34:29). He closes the week at 5:00 p.m. Eastern and notes the next information arrives with Sunday’s 6:00 p.m. reopening, which he says he cannot forecast (35:43, 36:00).
The generalisable lesson is a question, not a rule: how much of the week is left, and which session open is still available to deliver a move to the objective. He frames the remaining time as the dominant constraint, and that framing does not depend on accepting his directional calls.
ICT Weekly Range TGIF Retracement of 20% to 30%
Around 18:30 he introduces the concept he calls TGIF, for Thank God It’s Friday. The measurement he describes is from the high of the week, which he says formed on Wednesday, down to Friday’s low, and then a retracement of 20% to 30% of that range once price pierced the low and worked back above it. He says the week closed inside that zone (18:34, 18:50, 19:05, 19:11). Later he restates the close as settling between 30% and 20% of the weekly range (37:09).
He is explicit that this is optional rather than required, and calls it the highest order of the tool (19:17, 19:20). As a study note, a retracement percentage is only meaningful if the same high, the same low and the same session boundaries are used every time, which is why the recording spends time on how the week’s extremes are defined.
ICT NQ Futures Level and Trade Example
He cites the daily relative equal lows repeatedly and gives a figure for them: he starts to say 29,512 and immediately corrects himself to 28,512, and 28,512 is the number he uses from then on (23:08, 30:10). The correction is worth flagging because audio alone cannot confirm which figure matches the chart; treat the level as his stated objective rather than a verified printed price.
He also refers to a trade viewers had watched him execute on the one-hour chart, entered from a buy-side imbalance with sell-side inefficiency, where he says he took partial profits at the consequent encroachment and was stopped on the final single contract (22:48, 22:26). He names the pattern it produced (a market maker sell model, or smart money reversal, with successive stages of distribution running to the weekly target (23:24, 23:41)). That is a reported execution, not a verified one: the recording contains no fills, no account statement, and no risk parameters beyond a single stopped contract.
ICT Futures Market Hours and Session Clues
The last third of the recording is a study method. ICT recommends saving a chart image every week and comparing the gaps that appear between one session’s 4:14 p.m. Eastern settlement and the next 9:30 a.m. Eastern opening, then examining how price printed inside those gaps (24:04, 24:10, 24:30).
His analogy is a jigsaw puzzle with pieces missing: the regular-session chart shows the visible pieces, and the overnight Globex session, running from the 6:00 p.m. Eastern restart through to the following 9:30 a.m., supplies the pieces that were left out (24:40, 25:43). He adds a stronger claim, that regular hours tend to overlap and re-deliver the overnight range, which is why he teaches looking for overnight highs, lows and relative equal levels during the 7:00 a.m. to 9:00 a.m. premarket window (26:12, 26:28).
He then pushes further, describing price as pre-determined and dismissing the idea that buying and selling pressure drives it (36:15, 36:26). Nothing in the recording substantiates that. What can be tested is the archival habit: keep the two session templates side by side, mark the overnight extremes, and record what happened after 7:00 a.m. and after 9:30 a.m. That turns a claim into something a reader can check.
Limits of the ICT Weekly Market Recording
The review is framed as proof that the week was called in advance, and it is delivered in dismissive terms toward anyone who found the shorter morning lecture insufficient. Critics are described as not having followed the week, and the tone throughout is combative (1:07, 30:10). That framing is worth noticing rather than adopting. A single week in which a described framework matched the outcome is one observation, not a demonstration of reliability, and the recording does not show how often the same read would fail.
One caution from the recording is directly useful, however. ICT says he does not reply to messages on Telegram and warns that anyone offering mentorship, trade copying or mirroring in his name is running a scam, and that the material he provides is free (35:14, 35:21, 35:26, 21:37). Anyone who finds a paid “ICT mentorship” or copy-trading service should treat it as unaffiliated with this recording.
How to Test the ICT Weekly Range
Stripped of the forecast claims, the process the recording describes is repeatable work on a chart, and it is the sequence drawn below.
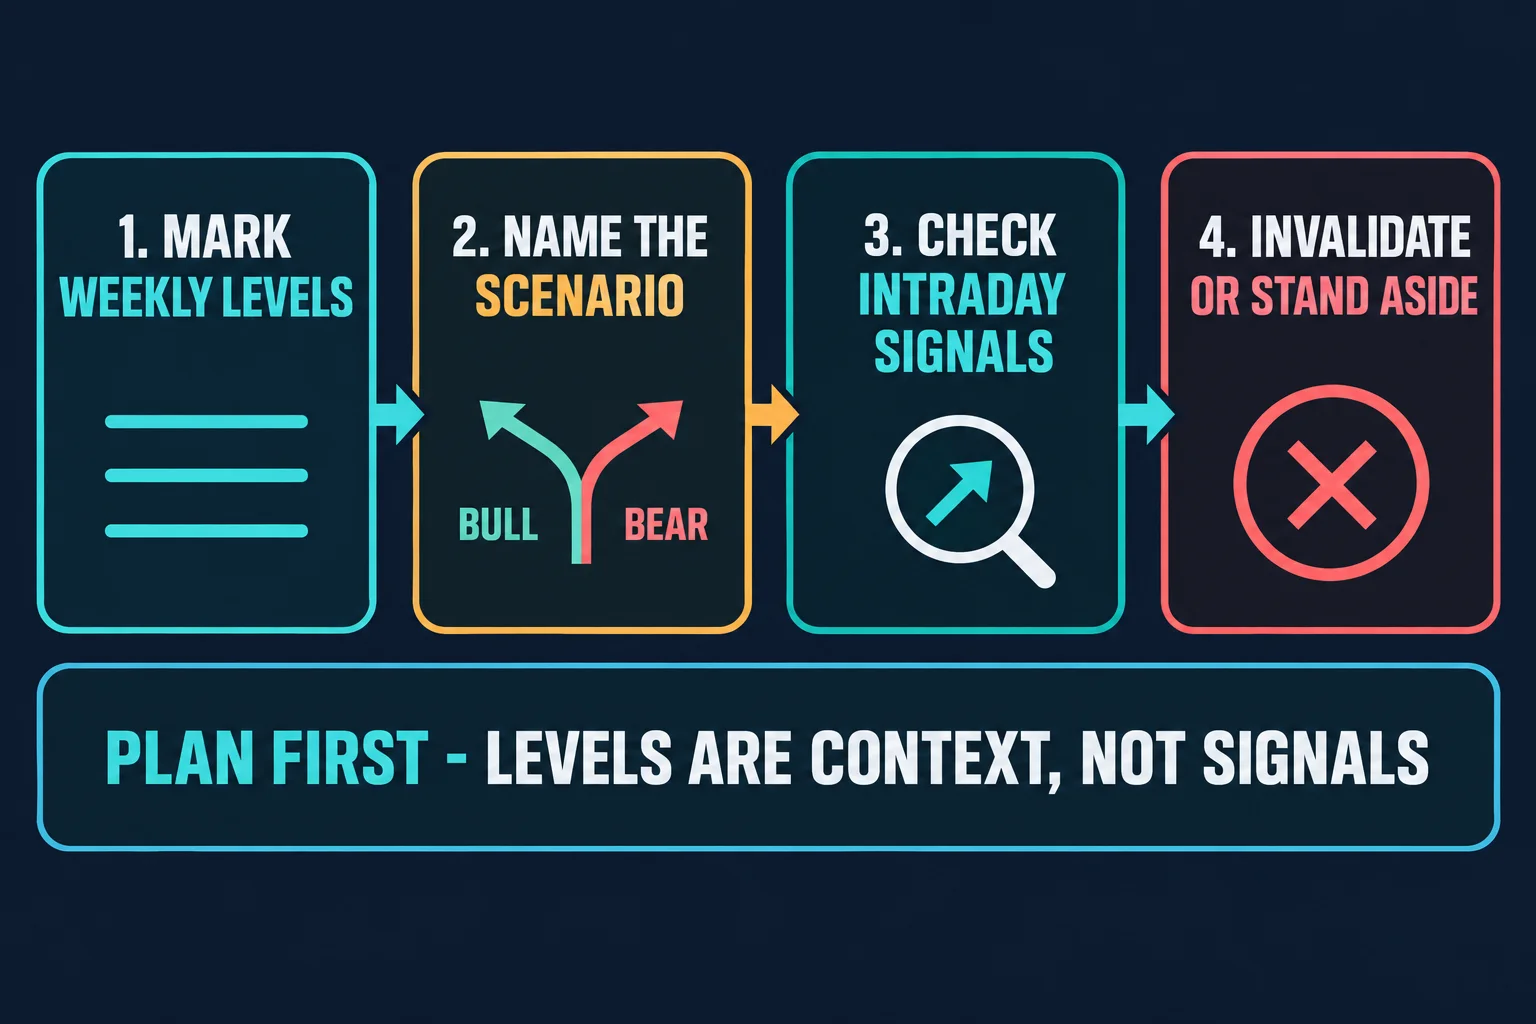
- Mark the weekly levels before the week starts. ICT’s references come from the higher-time-frame structure: the new week opening gap, the imbalance it sits inside, and the daily relative equal highs and lows (3:46, 16:09).
- Name the scenario in both directions. He holds a premium draw above and a discount draw below and says which one price would have to fail first to favour the other (6:48, 16:19).
- Check the intraday signals against it. The signals he uses are candle bodies accepting or rejecting a level, and whether a session open is available to deliver the move (11:35, 31:18).
- Invalidate or stand aside. He states that the week’s business was complete for him once the objective was reached and the retracement followed, and that Sunday’s reopening is unknowable in advance (38:34, 36:00).
The honest summary is that this is a well-structured way to organise a week’s analysis, taught through one selected example whose predictive value is asserted rather than measured.
Watch the ICT Futures Weekly Range Lesson
This article draws on the automatically transcribed audio of NQ Futures Weekly Range Market Wizardry. The transcript is a source for the speaker’s words only; it cannot verify the chart annotations, the reported execution or the level named above, and the annotated charts in the recording are the relevant reference when following the timestamps.
Watch the original lesson on YouTube
The video cannot be played inside another website: when its embedded player was opened and clicked from a BestProps page origin on 14 September 2026, the player itself reported “Playback on other websites has been disabled by the video owner.” and settled on a “Watch on YouTube” prompt with no duration and no playback progress. That is why no embed is reserved or left blank here; the recording is available directly on YouTube.
ICT Futures Market Sources and Further Reading
- The mapped Inner Circle Trader recording: the primary source for every timestamp link in this article. Use those links to compare each point with its origin.
- TradingView (NQ1!) E-mini Nasdaq-100 futures: the chart page for the instrument discussed in the recording. Official vendor page, not an ICT source; useful for checking the instrument and the contract referenced in the lesson.
- TradingView (how to turn Bar Replay on): platform documentation for stepping a chart back through past sessions. Relevant to the archival study method described above, which depends on reviewing sessions after the fact rather than trading them live.
- TradingView (Time intervals: a quick introduction and tips): how each candlestick is constructed and what a chart interval defines. Relevant because any weekly range, gap or retracement percentage depends on those definitions.
This is independent educational commentary on one vendor’s publicly available lecture. It is not official ICT material, not a tested trading system, and not a claim that the week reviewed here can be reproduced. Leveraged futures trading can produce substantial losses, and any framework described should be independently evaluated before use.
