
Key takeaways
The Inner Circle Trader’s 8 minutes 30 seconds NQ futures review from June 2, 2026 presents a self-reported Nasdaq short executed by smartphone using London-session relative equal highs, a buy-side sweep followed by a sell-side raid, and an inversion fair value gap confirmed only when a candle body closes through the imbalance rather than merely…
Read the full summary
The Inner Circle Trader’s 8 minutes 30 seconds NQ futures review from June 2, 2026 presents a self-reported Nasdaq short executed by smartphone using London-session relative equal highs, a buy-side sweep followed by a sell-side raid, and an inversion fair value gap confirmed only when a candle body closes through the imbalance rather than merely wicking beyond it. ICT treats 5 to 6 a.m. as dead time, begins the higher-probability window at 6 a.m., labels 7 to 9 a.m. pre-session, and highlights a 5 50 a.m. macro window, though the chart time zone is unspecified. He says he began with 2 contracts, added within the highlighted inversion area, took partials below successive minor sell-side levels, re-added 2 contracts at consequent encroachment, and ultimately targeted relative equal lows through an accumulation, reversal, distribution, and redistribution sequence. The main study lesson is to mark the session and range, record the order of liquidity sweeps, require displacement and a body close for inversion confirmation, and document invalidation from failure to close, displace, or follow through. ICT also identifies a breaker as a high, low, and higher high, distinguishes inversion gaps from order blocks that do not require a close, warns against picking tops, and flags relative equal highs as a probable liquidity draw after an old all-time high was swept. All executions, fills, and results are unverified claims based on automatically transcribed audio without visual chart validation, account records, exact risk, slippage, commissions, or performance statistics.
How we researched this article
BestProps used document-based research from primary firm sources, checked September 24, 2026. The complete source list, scope, limitations, and commercial-state record appear near the end of this article.
The recording is short and personal: he says he was lying around, decided to trade, and is reviewing on a large screen what he had done earlier on a phone (0:03). It is written up here from the automatically transcribed audio of the full recording, not from a visual review, so chart detail is described only as he narrates it and no figure is reconstructed from the image.
ICT NQ Futures Annotation and Comparison
His first instruction is a study method rather than a setup: pause the video and mark what you think matters before he shows his own annotations, then compare and contrast your marks with his (0:39). He says everything he highlights was the backbone and framework for the execution, so the comparison is the point of the exercise. It is also the reason this review is more useful as a chart-reading drill than as a call to copy a trade.
ICT NQ Futures Session Timing
He begins with relative equal highs formed during the London session (1:09). At 5 a.m. he says the market rolls into what he calls dead time between 5 and 6 a.m., where price runs can still occur but are not the ones he trusts. From 6 a.m. onward he treats runs as worth acting on, and he describes 7 to 9 a.m. as pre-session time (1:24).
He says he watches that window closely, especially during non-farm payroll weeks, and that he titled the session “early bird” for that reason (2:01). The clock references are his; the transcript does not state the chart time zone, so they should be read against the platform settings visible in the video rather than assumed to be your own local time or an exchange clock.
ICT NQ Futures Two-Sided Liquidity
He then marks the liquidity on both sides of the market. The highest high defines the buy side and relative equal lows define the sell side; price ran above the highs, then broke down and traded into the low, clearing that area (2:20). His summary of the sequence is that buy side was taken first and sell side second (2:41).
In his framework a sweep like that is context, not a complete setup: it becomes useful only when the timing and displacement conditions he describes line up with it. That qualification is his own, and the recording does not quantify how often the combination works.
ICT NQ Futures Macro Window and Inversion Gap
He notes a slightly higher high and then a macro time at 5:50 a.m., and says he uses that window to ask what should be expected after buy-side liquidity has already been taken (3:04). He then walks through the structure he used: an equity pool, relative equal lows, and an inversion fair value gap formed between one candle’s high and another candle’s low, with a gap down creating a volume imbalance, a retracement up to consequent encroachment, and a sell-off during the macro (3:15).
He also marks a breaker, which he describes as a high, a low and a higher high, and says the body was dragged through that area before price traded up into it and then started lower (3:33).
Valid Inversion Gaps in ICT NQ Futures
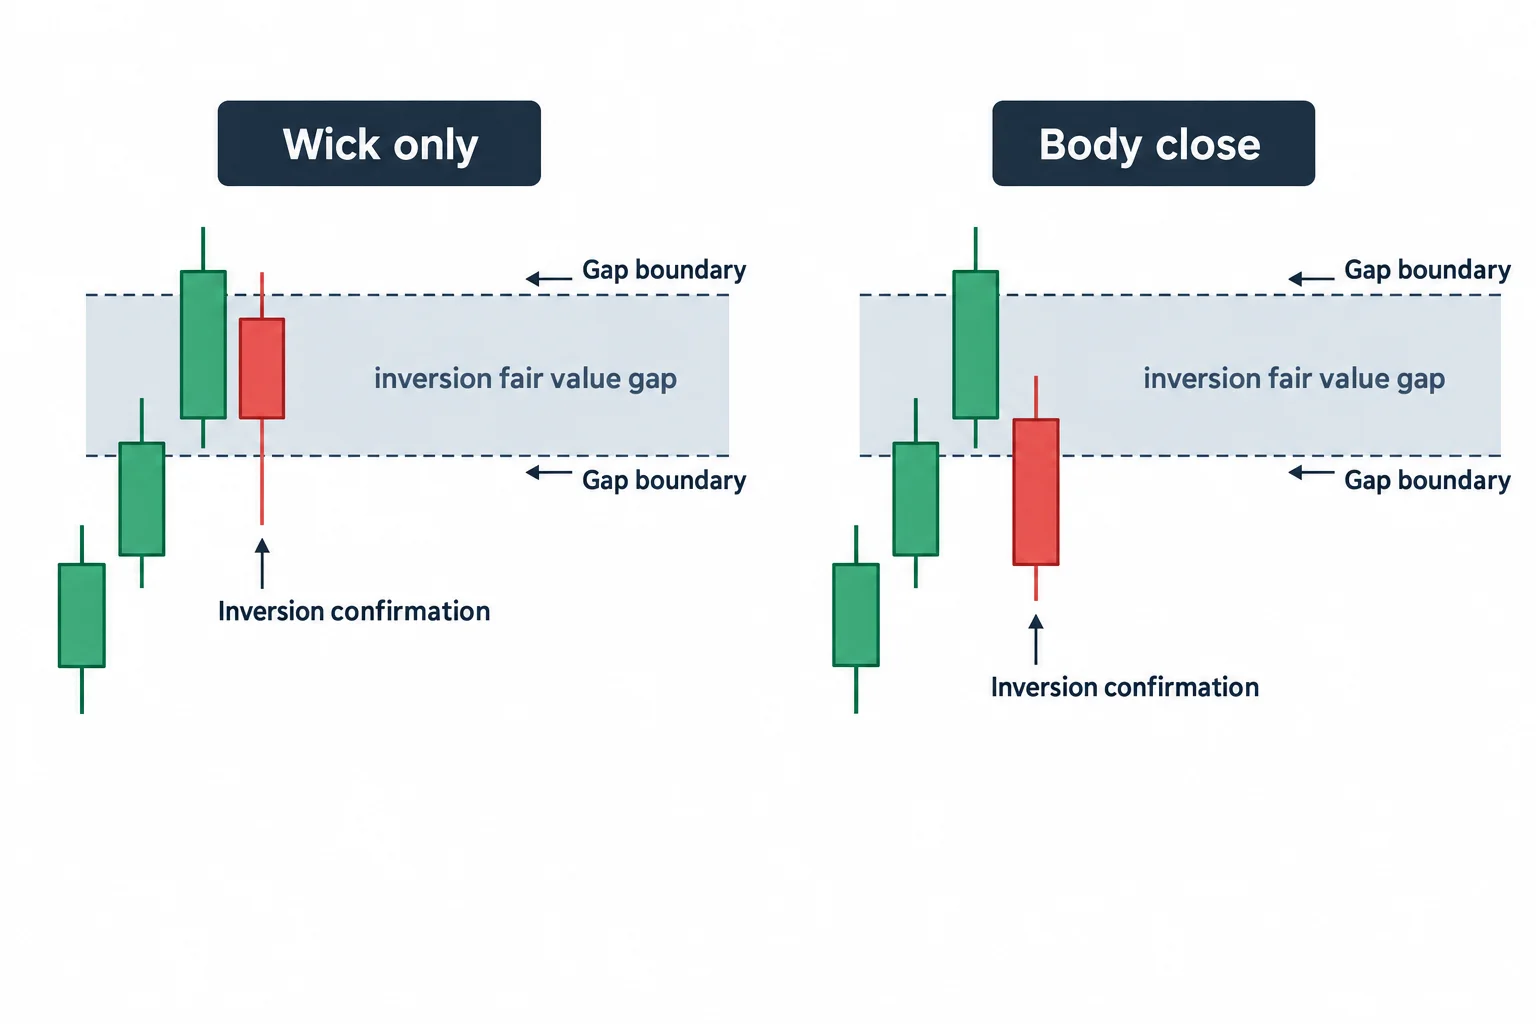
The clearest teaching point in the recording is about confirmation. He says a candle closing outside the buy-side imbalance / buy-side inefficiency is what validates that area becoming an inversion fair value gap, and that simply wicking down through it does not (3:45). He contrasts it with an order block, which he says does not require a close, and stresses that inversion fair value gaps do.
Stated as a checklist, his distinction is:
- Identify the original imbalance and the candle bodies that created it.
- Wait for price to trade through the area rather than anticipating it.
- Require a candle body to close beyond the relevant boundary before treating the area as inverted.
- Then judge whether a retracement into that area aligns with the direction and the liquidity objective you are working toward.
That is a description of his classification system. The recording offers no statistics on how often the condition succeeds, and this page makes no such claim.
ICT NQ Futures Short Trade Management
From here the review becomes a trade diary. He says he saw the gap, wanted to be part of the move, and started with a small position of two contracts while anticipating a retracement back up into the low of the inversion fair value gap (4:35). He says he added to the position when price traded into an area he highlights with two lines, that he took a partial after price broke a minor sell-side level, that he added two contracts again on a retracement into consequent encroachment, took them off below, and then put them back on (5:02).
He then describes attacking successive minor sell-side levels as price breached them, taking an exit each time, and finally reaching the relative equal lows (5:21). He frames the whole decline as consolidation and first-stage accumulation, then reversal, distribution, second-stage redistribution and a larger move that cleared the relative equal lows, toward what he calls a terminus objective (5:44).
What the ICT NQ Futures Execution Shows
The execution recap starts at 6:19. He points to a first entry with two contracts, retraces into the small inversion fair value gap he was anticipating, describes adding more positions inside the distribution of the earlier run-up, and then a partial below a broken low (6:27). He then says price rallied back into the fair value gap, that he read it as bearish, and that it sold off sharply through the low, and he points to where the fill sits on the chart (7:06). He adds that it was all done on a smartphone and that his exit candle coincided with a reversal.
One spoken fill price around 6:53 is ambiguous in the automated transcript, so it is not quoted as an exact number here. More importantly, none of this is independently established: the transcript cannot confirm entry or exit prices, order sequence, slippage, commissions, position risk or any account result. The screen he describes is evidence that he narrated a set of executions, not that they occurred at the prices shown or that the approach is profitable.
Reviewing an ICT NQ Futures Execution
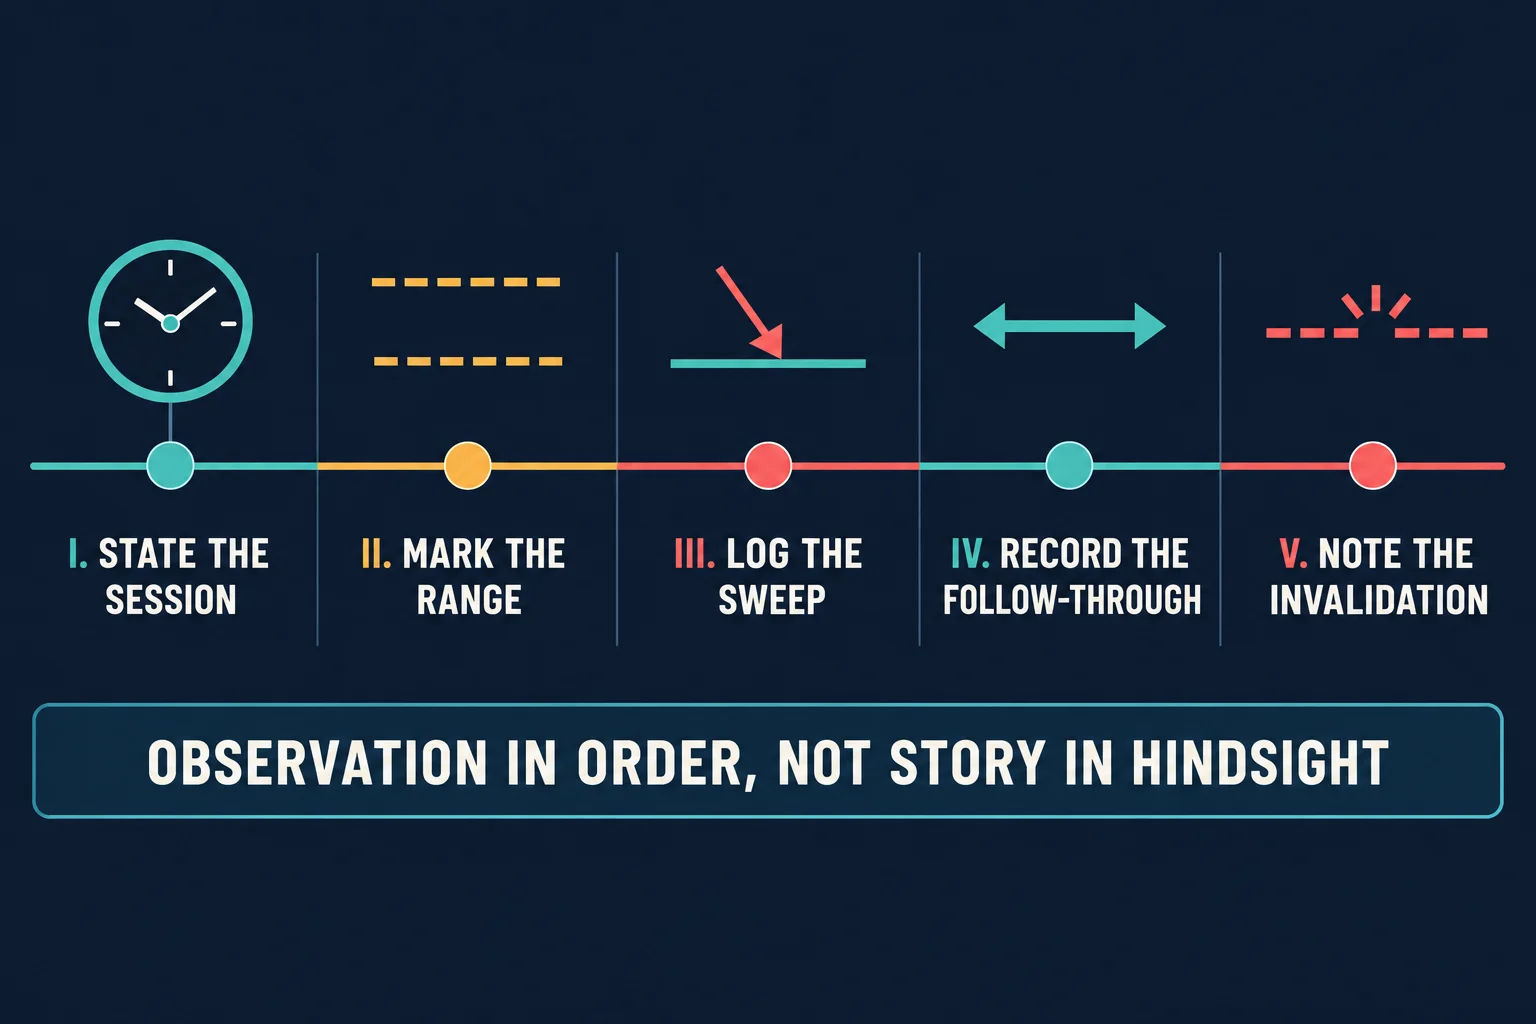
Applied to this recording, the sequence is straightforward, and it is also the honest way to read his diary back:
- State the session. Asia, London and New York behave differently; his clock references only mean something once the session and time zone are written down.
- Mark the range. In his narrative the dealable range began when the London highs and the low beneath them were both on the chart.
- Log the sweep. Buy-side liquidity was taken first and the sell-side low was raided second; recording the order matters more than recording the depth.
- Record the follow-through. The confirmation he waited for was a candle close through the imbalance, not the touch of it.
- Note the invalidation. Any of his conditions (a failure to close, a failure to displace, a sweep without follow-through) would have invalidated the sequence, and the review is only complete when that is written down as well.
ICT NQ Futures Highs and Recording Limits
Near the end he recounts a conversation in which he told another trader to prepare for new all-time highs, and says the market did subsequently trade up into the old all-time high, used it, and swept it later in the day; in Asia he says price was working around that old high (7:41). He then flags relative equal highs as a probable next draw on liquidity and tells viewers not to try to pick tops (8:17).
That closing sequence is his contemporaneous interpretation. The recording supplies no evidence of what happened after he recorded it, no account statement, and no indication that anyone else followed the idea. Three limits apply to the whole page: the transcript is automatic speech recognition of the audio with no visual chart verification; the trade numbers are self-reported; and the concepts he uses (inversion fair value gap, consequent encroachment, breaker, liquidity draw) are his framework rather than properties of the market that the recording demonstrates.
Related ICT NQ Futures Commentary for June 2026
The recording this article summarises is NQ Futures Review & Commentary \ June 02, 2026 from The Inner Circle Trader, uploaded 2 June 2026 (3 June in UTC) with a runtime of 8:30. Its title, channel, upload date and runtime were read from the watch page, and the player was tested: the page is public, and the player returns the message that playback on other websites has been disabled by the video owner, so it cannot be embedded here.
Watch the original recording on YouTube
Playback on other websites has been disabled by the video owner, so the player cannot be embedded in this article. The same message appears when the player is tested directly. Open the video on YouTube to review it yourself.
ICT NQ Futures Sources
- [1] YouTube: NQ Futures Review & Commentary \ June 02, 2026, The Inner Circle Trader (primary source recording; watch page read and player tested, embed disabled by the owner; audio transcribed for this summary)
- [2] Federal Reserve: FOMC meeting calendars (official schedule used to confirm whether a macro window in a past week carried a scheduled release)
- [3] Nasdaq Trader: U.S. market and holiday calendar (session and holiday reference for confirming which day the market was open)
- [4] BestProps RuleWatch: Prop Firm News Trading Rules (documented news windows, source status and source gaps across firms)
On indicators and third-party tools: no indicator, script or signal service is named, linked, tested or recommended on this page, and no claim is made that any of them detects these areas, repaints less or would have timed anything better.
BestProps is not affiliated with The Inner Circle Trader, YouTube, the Federal Reserve or Nasdaq, and no source listed here endorses this article, this site or any setup. Nothing on this page claims that any level predicts price, that any execution described in the recording occurred at the price shown, or that the approach produces a reliable result, and nothing here is individualised investment advice.

