
Key takeaways
In My Model On NQ NFP Friday, ICT narrates an NQ short through a nonfarm-payroll Friday, describing the location as the day’s opening-range-gap high converging with the 9:30 opening price and two daily imbalance areas, the objective as sell-side liquidity under the prior nonfarm-payroll low and a weekly-range retracement, and the structure as what he…
Read the full summary
In My Model On NQ NFP Friday, ICT narrates an NQ short through a nonfarm-payroll Friday, describing the location as the day’s opening-range-gap high converging with the 9:30 opening price and two daily imbalance areas, the objective as sell-side liquidity under the prior nonfarm-payroll low and a weekly-range retracement, and the structure as what he calls the second-stage redistribution of a market maker sell model. He reports closing the position manually and taking 6,470 from the trade. Those are his statements in the recording; the captions cannot verify fills, size, account balances or his net result.
How we researched this article
BestProps used document-based research from primary firm sources, checked September 13, 2026. The complete source list, scope, limitations, and commercial-state record appear near the end of this article.
This article is written from the recording’s own timestamped captions rather than from secondary summaries, and it attributes everything market-related to the speaker. The lesson is best read as one trader explaining and managing one sequence in real time, not as evidence that the model produces repeatable results. Nothing here is investment advice.
Two source limits are worth stating up front. The captions begin at 3:54, so the recording’s first minutes are not represented in the text below. The speaker also remarks at 27:11 that the clip runs about 28 minutes and that he expects YouTube to process it, and he signs off without showing whether his stated target was later reached.
The thesis, and the location that produced it
The recording opens with the speaker discovering his microphone had been off during an earlier stretch of talking (4:57). Resuming, he states his expectation that price would move down through the regular-trading-hours opening-range-gap low and pursue the low created by the nonfarm-payroll price run, which he places inside the prior day’s new day opening gap (5:06).
His reason for reading that area as a short location is a convergence. He says price had traded up into the high of the day’s opening-range gap, which is also the 9:30 opening price, and that the same level coincided with the upper portion of a daily imbalance he calls a sell-side inefficiency and with part of a daily volume imbalance he had shaded on his chart (5:42). He notes he had been referring to that shaded imbalance for roughly three weeks (6:02). Overlapping references like this are what he means elsewhere when he describes levels as nesting PD arrays (8:49).
From that location he reasons about the other side of the book. Because liquidity sitting above the market was left untaken, he argues the more likely draw is toward the resting orders below, and he describes the longs’ stops he expects the market to work toward (6:15). His more ambitious extension, which he treats as a possibility rather than a plan, is an acceleration into the prior week’s Thursday first presented fair value gap (6:28).
How he reads the move as it develops
Two behaviours are treated as confirmation. First, he wants price to leave a volume-imbalance area open while breaking down, which he describes as weakness, or equivalently as strength for lower prices relative to a short position (7:52). Second, he does not want merely to touch intermediate levels; describing the state of the gap, he says he would rather see price cut through than bounce (11:15).
The reference set he manages against, all of it his own framework:
- Opening-range gap — its high as the short location, its low as the first level to take out.
- New week opening gap — its high as an upper reference and its midpoint, which he calls the consequent encroachment, as the area price was sitting in when he first commented on stop placement (12:42).
- New day opening gap — he connects the prior nonfarm-payroll low to this area and later points out that the level he is watching is anchored to it (22:23).
- Sell-side liquidity — he states that nonfarm-payroll liquidity sits just below 29,500 (11:23).
- Weekly-range retracement — he tracks 20% of the weekly range, notes a retracement of slightly more than 25%, and identifies 30% of the range as a further objective, later putting that figure at 29,471.25 (9:55, 15:57).
He names specific numbers as the session runs: he says he will lower his stop to 543 once the low he marks at 29,502 is taken out, and separately mentions wanting 29,490.50 (12:51, 10:24). These, like every level above, are caption-rendered figures from his narration. They are his chart readings and are not independently confirmed prices, and the captions cannot show whether the orders he describes were placed.
Risk management and the exit
The most substantive teaching in the recording is how he handles an open position rather than how he entered it. He describes lowering his stop as the move progresses, and explains a deliberate delay in doing so: he wanted to avoid being stopped by a temporary upward reaction before a further decline (12:51). He frames the same trade-off numerically, saying he was willing to be stopped out at a given dollar amount but not willing to surrender more than about 5,000 of unrealized gain (20:16, 20:32).
He then applies that rule against himself. When it looked as though price would run into his stop, he closed the position manually rather than let the stop decide (21:33). He reports that the exit captured 6,470, and he acknowledges that price could still reach the target he had described, which he had expected lower (21:41). Treat the figure as his statement of his own result. The captions cannot establish position size, entry, exit, commissions or account outcome, and this caption-based review does not independently verify an order record.
What he says he was trading
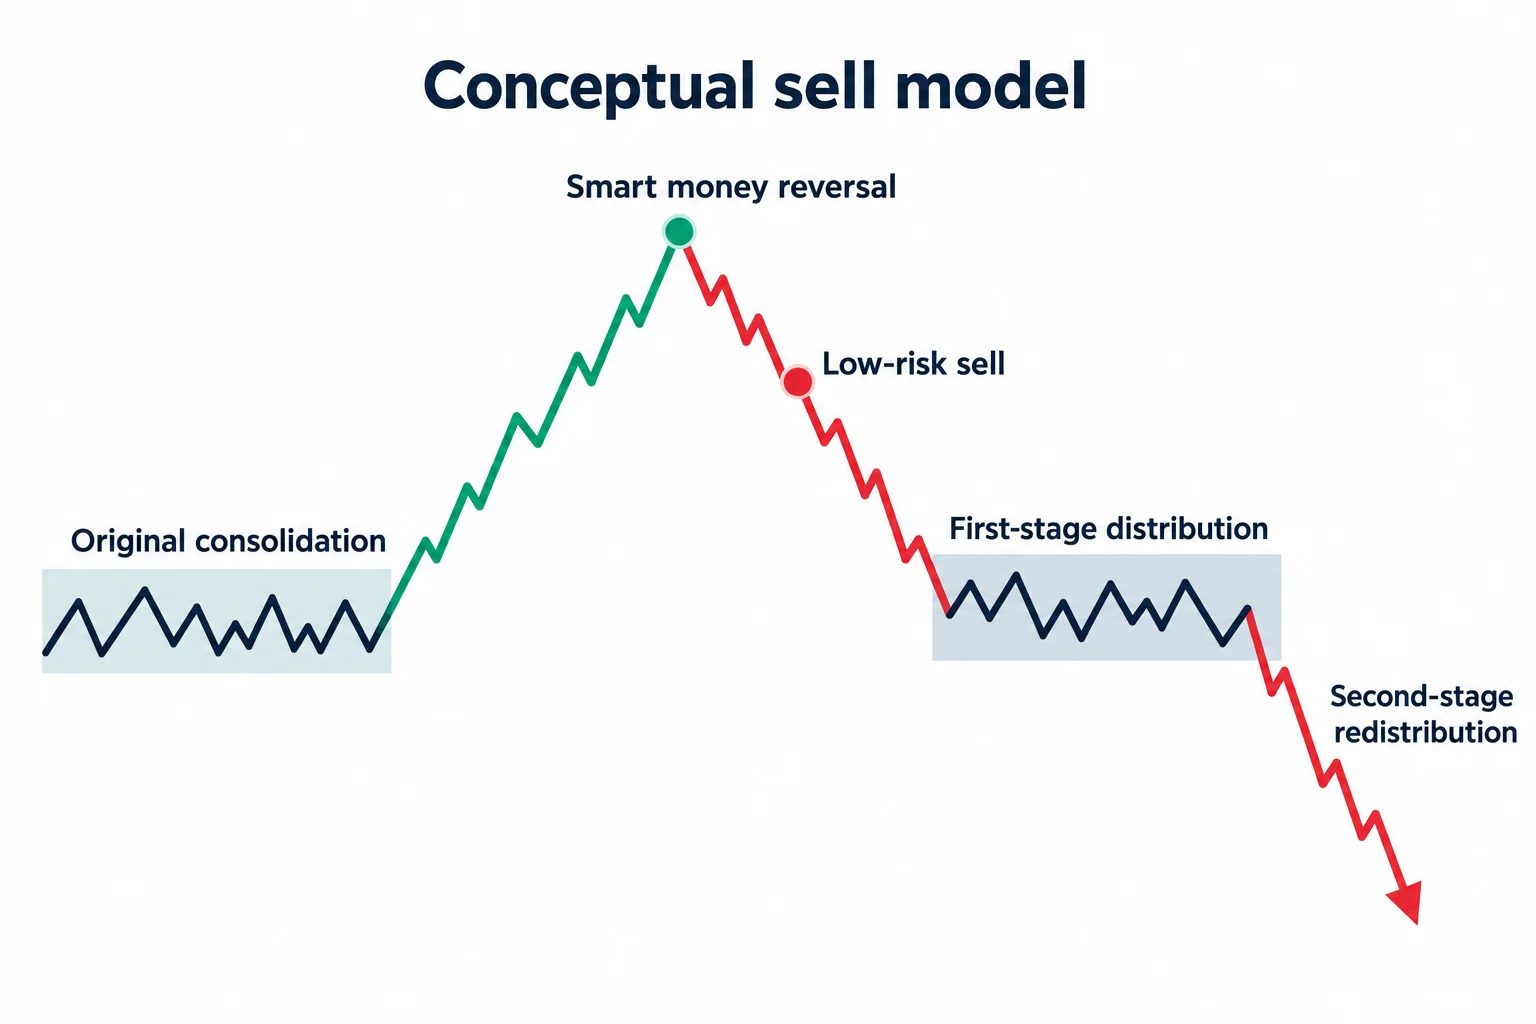
After the exit, he asks viewers whether they can identify the structure and then names it himself as a market maker sell model in its second-stage redistribution, listing the components as original consolidation, smart money reversal, a low-risk sell, first-stage distribution, second-stage redistribution and a run beneath the identified low (23:14).
He says his preferred bearish pattern is the second-stage distribution or redistribution of a market maker sell model, and that his preferred bullish counterpart is second-stage reaccumulation within a market maker buy model. He points to material on his own YouTube channel, describing it as instruction from his 2016 and 2017 mentorship playlists and his charter playlist, and calls what he trades there a near-universal model (23:47, 23:57). Those labels are his own vocabulary. Nothing in the recording demonstrates that a labelled market maker model predicts price, and the article takes no position on whether it does.
The trades he declined, and his filter on nonfarm-payroll weeks
A stated reason the position was not taken earlier is that he did not trust the untaken relatively equal highs sitting above the market, which he says made shorting there feel uncomfortable (24:58). He also says that on an employment-report Friday running into a long weekend he waits through the first hour of trading and requires more from the setup than he otherwise would (24:38).
He then states a general guideline in his own words: he tells students to avoid trading nonfarm-payroll weeks after 11:00 a.m. Eastern time on the Wednesday, and specifically warns about the Thursday and Friday of that week (25:36, 25:51). That is his personal risk guidance as spoken in the recording. It is reported here as his recommendation, not as a rule established by the release itself or by independent testing, and no release-time statistic is restated because the recording does not supply one.
His position on replay, and the tone of the session
One opinion is stated twice and plainly: he tells viewers never to teach with market replay, saying that anyone teaching from replay does not know how to trade and should not be charging for it (8:15, 13:51). That is his view of teaching practice, presented as such.
A caution for anyone reading a transcript of the session: a large share of the recording is delivered as jokes at the expense of chart-decoration and coaching products. He refers to his own busy chart as the “Crayola” or “Rainbow Bright” model while listing heat maps, book maps and liquidity maps as competitors (6:34), and the “technique” he describes later for pulling price to a target is delivered as a running gag about a mouse and a candlestick (17:07). Read literally, those passages would misrepresent the lesson. They are sarcasm, and the substantive content of the session is the location, the reference levels, the stop management and the exit.
General educational takeaways
Independent of the proprietary vocabulary, the recording illustrates a few transferable practices:
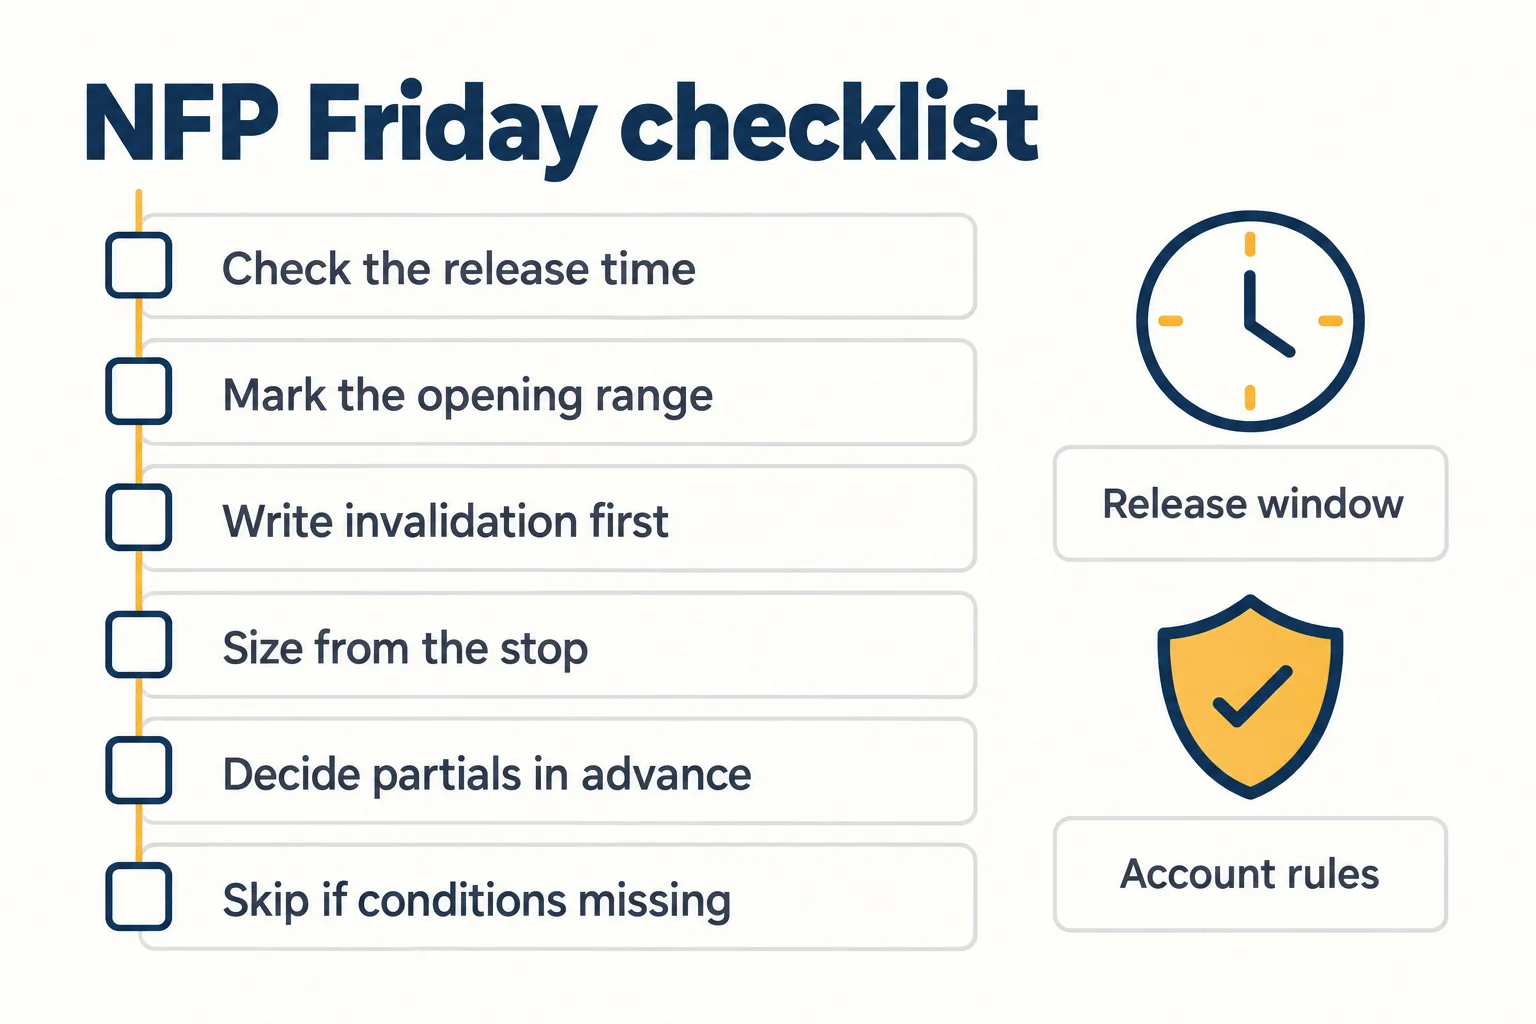
- State the intended location and the invalidation before the session, not after.
- Keep the objective deliberately below the maximum the analysis allows, and accept that price may continue without you.
- Decide in advance what a given level of open gain must not be allowed to become a loss.
- Separate the question “is this the pattern?” from the question “does this pattern have an edge?” The recording supports only the first.
- Say what a session does not cover. Here the speaker leaves the target outcome as a cliffhanger before signing off, so the recap does not establish whether that target was later reached.
Related ICT video: My Model On NQ NFP Friday
The mapped source lesson is My Model On NQ NFP Friday from The Inner Circle Trader. BestProps lists it with a date of September 4, 2026, and the recording’s own references to an employment-report Friday and to a Labor Day weekend are consistent with that. This article is independent educational commentary grounded in the captions; it is not an official ICT lesson, not a transcript, and not confirmation that anything described here happened as narrated.
Use the timestamp links throughout the article to compare the recap with the source lesson. If the embedded player does not load, open the recording on YouTube.
Primary source and further reading
The material above is deliberately conditional. These references let you check the release schedule at the agency that publishes it, rehearse the session, and write the idea down as a rule instead of a pattern name.
Check the release schedule at the agency that publishes it
The Employment Situation summary from the U.S. Bureau of Labor Statistics is the primary source for this release and its schedule.[1] Plan around the publishing agency’s own calendar rather than a secondary one. This article does not restate the report’s figures: they are not part of the recording and BestProps has not independently verified them, and a release number is released data, not a trade signal or an explanation of a chart move.
Rehearse the session, then discount what replay cannot show
TradingView’s Bar Replay guide describes opening the replay panel, selecting a starting point, and stepping the chart forward with the Forward button.[2] That is useful for rehearsing the location-first sequence described above, and it is also worth knowing that the speaker on this recording rejects replay as a teaching method outright. Replay is not a live release either: it cannot reproduce the spread, slippage or latency of an 8:30 a.m. print, so record those separately when you review execution.
Write the rule before you test it
TradingView’s Pine Script documentation states that strategies are scripts that simulate trades across historical and realtime bars, allowing backtesting and forward testing of a system.[3] That is the step between a narrated recap and a repeatable plan, because expressing entry, invalidation and exit logic as explicit conditions forces the definitions to be fixed before the outcome is known. Results produced this way are simulations that depend on fill assumptions, and they are not evidence of live profitability.
Sources and tool documentation
- [1] U.S. Bureau of Labor Statistics: Employment Situation Summary
- [2] TradingView: How do I turn Bar Replay on?
- [3] TradingView: Pine Script strategies
BestProps is not affiliated with the U.S. Bureau of Labor Statistics or TradingView, and no source listed here endorses this article, the ICT methodology or any setup. Nothing here demonstrates a profitable or repeatable result. Release dates, platform behaviour and contract specifications change, so verify them for the instrument and account you actually use.

