
Key takeaways
ICT’s From Vision To Execution at youtu.be/rXgEMIJ1fQg is a 55 minutes 11 seconds trading lesson on building a conditional market narrative, specializing in one market with only one to three concepts, and doing nothing when the draw on liquidity is unclear.
Read the full summary
ICT’s From Vision To Execution at youtu.be/rXgEMIJ1fQg is a 55 minutes 11 seconds trading lesson on building a conditional market narrative, specializing in one market with only one to three concepts, and doing nothing when the draw on liquidity is unclear. Using a one-minute Nasdaq chart from 23 December 2025, ICT identifies buy-side liquidity, sell-side liquidity, or inefficiency as possible destinations, then studies whether price and time support the route. The bearish example combines a turtle soup setup, the first presented fair value gap, relative equal overnight lows from midnight through 7 a.m. Eastern as the sell-side draw, and macro windows from 9 50 through 10 10 a.m. and 10 50 through 11 10 a.m., with time assessed before price and narrative prioritized over lower-timeframe market structure. Beginners are advised to avoid the 11 30 a.m. through 1 30 p.m. lunch period, while relative equal lows may serve as partial-exit candidates and an inversion fair value gap called Model 22 may support continuation. Daily-chart context is mandatory in the framework, including a suspension block defined as buy-side imbalance and sell-side inefficiency framed by two volume imbalances rather than a liquidity void. ICT recommends candle-by-candle backtesting, handwritten records, explicit triggers and invalidation, and stepping aside unless a setup matches a previously studied pattern. His reported $2,100 paper result lacks account, fill, size, stop, and independent verification, and he said live streaming was expected to resume on 10 February 2026.
How we researched this article
BestProps used document-based research from primary firm sources, checked September 24, 2026. The complete source list, scope, limitations, and commercial-state record appear near the end of this article.
In From Vision To Execution, published on 1 January 2026 at 18:31 Pacific time (02:31 UTC on 2 January 2026, which is the date carried in this site's video inventory) ICT presents trading as a process of forming a conditional market narrative and then waiting for price and time to support it. In the recording he says the session itself is being given on 1 January 2026, and the worked example is a one-minute Nasdaq chart dated 23 December 2025.
The central message is restraint: specialize in one market, work with only a few concepts, and do nothing when the expected destination of price is unclear. The lecture becomes technically dense later, but the framework it argues for is simple. Decide where price appears to be drawing, identify what would support a move toward that destination, and avoid forcing a trade when those conditions are absent.
ICT Vision for Clear Trade Destinations
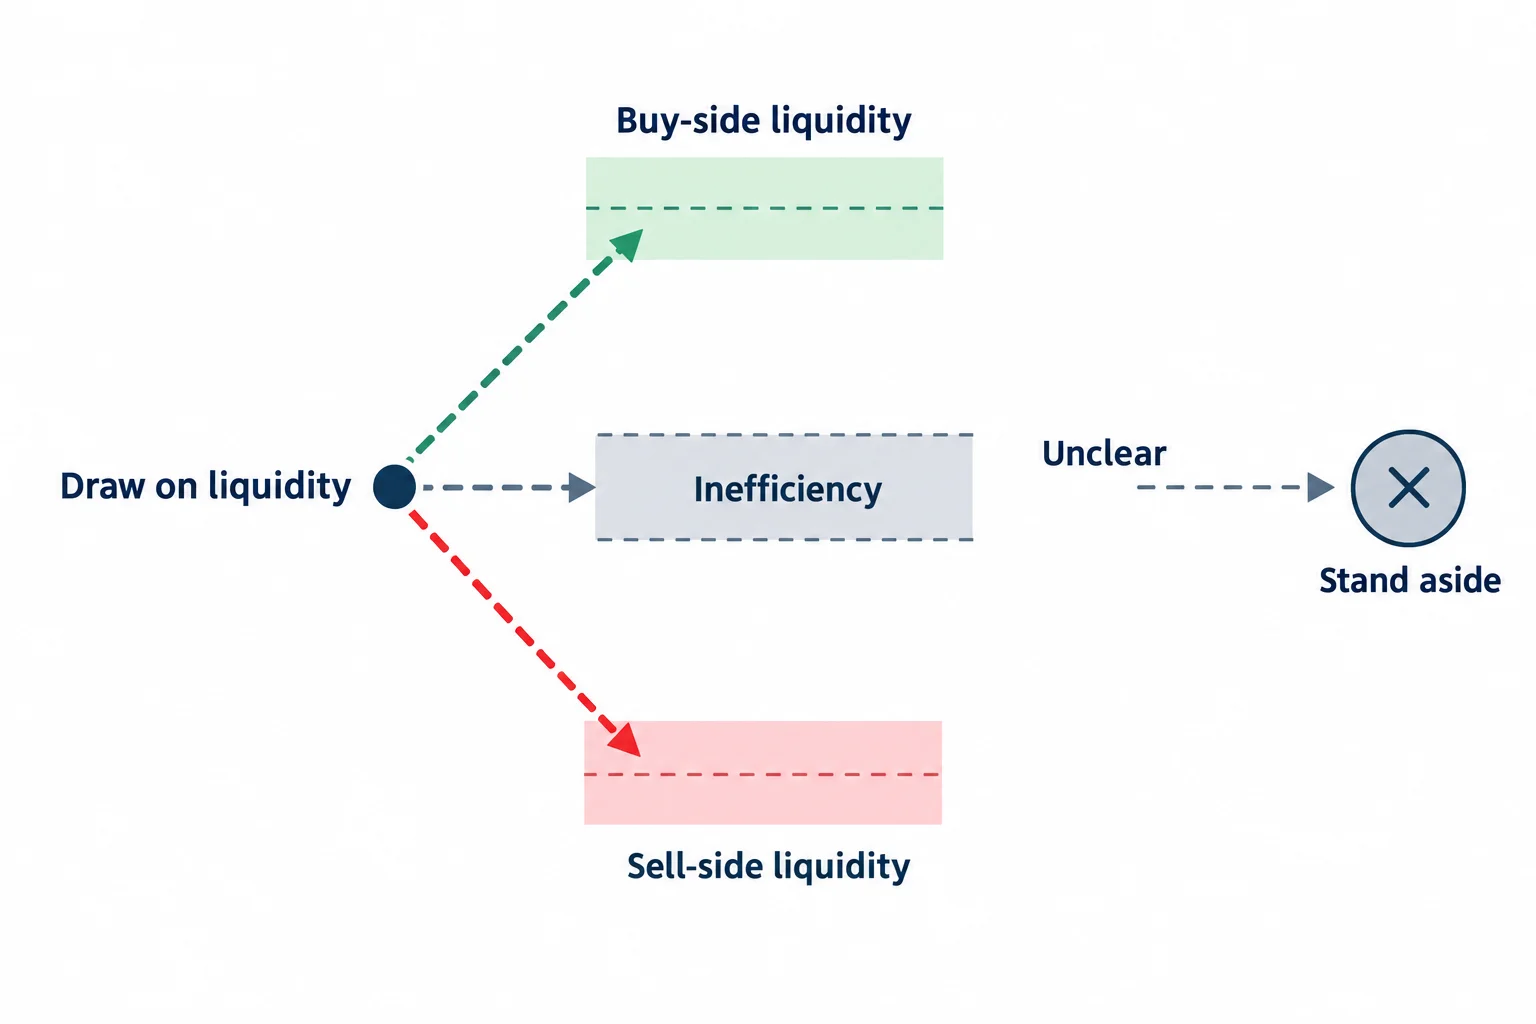
At 3:14, ICT describes speculation as an attempt to cast a view over what price may do next while accepting that the next candle, and the outcome, remain uncertain. The first task in his framework is identifying where price is likely to be “drawing” (the destination he calls the draw on liquidity). The candidates he names are buy-side liquidity, sell-side liquidity, or an area of inefficiency above or below price.
He describes this hypothesis as “casting forth a vision” over the chart. It is not certainty; it is a working view of:
- the level or liquidity pool price may seek;
- the route price could plausibly take to reach it;
- the price behavior that would support the idea; and
- the evidence that would make it no longer credible.
At 9:25 he states the rule that follows: “if that’s not clear, you do nothing.” Disengagement, in his framing, is a skill rather than a missed opportunity.
ICT Trade Simplification Through Specialization
Early in the lecture ICT warns against a “kitchen sink” approach that combines every available concept. At 2:15 he recommends reducing the process to one, two, or at most three moving parts and to no more than one market.
He links that specialization to record-keeping. A trader watching a single instrument can note the levels that stood out, keep them on the chart for a defined period, and study how price interacted with them later; at 14:46 he refers to the handwritten notes he keeps beside him. At 26:10 he points to “first presentation” (the first fair value gap formed in the direction of the intended draw) as an example of what a specialist learns to collect and reuse.
ICT Trade Execution With the Nasdaq Example
From 10:26, ICT works through a one-minute Nasdaq chart dated 23 December 2025. The source used for this article is the automatically transcribed audio of the full recording, so the chart’s exact prices and markings are not independently described here.
His reading begins with an early rally above a short-term high, a false break of that high, and a sharp move back down, a sequence he labels a “turtle soup” sell-side setup. The first fair value gap that forms behind that displacement (12:14) is what he calls “first presented”. His suggestion is to keep that zone on the chart, project it forward, and give it more weight than every other imbalance.
For the intraday narrative he marks relative equal overnight lows as the sell-side draw. At 17:54 he defines the overnight reference window as midnight to 7:00 a.m. Eastern time and takes the lowest low inside it; where the lows sit at similar levels, he treats that area as a liquidity pool a bearish scenario would seek. He frames this as a way of classifying a session rather than a rule that applies every day.
He then judges later candles by whether they preserve that bearish story. A retracement into the earlier fair value gap does not, on its own, invalidate the idea in his reading; instead he watches whether price can trade through the zone or is rejected and resumes moving toward the overnight lows. He also defines the working range from the premium array price sold off from down to the sell-side low it took, and uses a repeated inefficiency inside that range as a reference for the next leg.
ICT Trade Execution Through Price and Time
A recurring theme is that a pattern should not be read apart from the time it occurs in. Around 22:43 ICT introduces a 9:50–10:10 a.m. “macro” window. He reads a return into the earlier gap during that window, followed by renewed selling, as support for the bearish narrative. He points to a second window, 10:50–11:10 a.m. (34:12), and says the displacement toward the overnight lows took place in it.
His broader formulation, near 40:13, is “time, then price”: the timing window is assessed first and the price level second. At 39:26 he adds that “narrative trumps market structure”, arguing that what he calls time distortion can make the structure a trader is reading on a lower timeframe misleading. These are his interpretations of one session, not independently tested conclusions.
For less experienced traders he recommends staying out of the 11:30 a.m.–1:30 p.m. Eastern lunch period (40:46) and returning to the charts after 1:30 p.m. (41:02) to see how the afternoon sets up. In the example he marks relative equal lows beneath the morning range as candidates for partial exits (42:22) and describes an inversion fair value gap (referred to as “Model 22” earlier in the lecture and rendered as “Model 2022” at this point in the automatic transcript (42:44)) that he says preceded the continuation lower.
ICT Trade Framework for Daily Chart Planning
At 44:44 the discussion turns to why the intraday rally reversed. ICT argues that a trader has to at least confer with the daily chart (“if you aren't at least conferring with the daily chart in your trading you are trading blind”) and then introduces a daily “suspension block” (45:17), described as a form of buy-side imbalance and sell-side inefficiency framed by two volume imbalances rather than by the candle-to-candle gap alone. He is explicit that it is not a “liquidity void”, which he defines as an interval with no trading at all.
He then treats that daily reference as a premium array: in his account price failed to reach its upper quadrant, consolidated, retraced into it, and sold off (46:18). The educational point is that the intraday sequence is being read against a higher-timeframe level instead of in isolation.
ICT Trade Backtesting for Practical Review
ICT returns repeatedly to study method. At 30:54 he recommends reviewing historical candles one at a time and writing a coherent explanation of why price moved from one level to the next, collecting recurring examples rather than memorizing a pattern without its context. He describes the skill as transferable but slow, and says he does not think consistent profitability is possible without that kind of review.
A general, educational version of that routine would be:
- choose one market and one completed session;
- mark the overnight and regular-session reference levels before looking at the outcome;
- record the higher-timeframe context;
- state the expected draw in writing;
- note which price zones and time windows supported or contradicted the idea;
- define what would have invalidated the narrative; and
- repeat across many sessions, including the ones that failed.
ICT Trade Execution With a Reviewable Plan
ICT’s own framing of the line between analysis and gambling is blunt. At 50:43 he says that if a trader cannot build a narrative that makes sense of what price is doing, the setup is probably being forced. At 51:33 he adds that he wants a “plug-and-play” match to something he has seen before, and that when he cannot read a candle he steps aside.
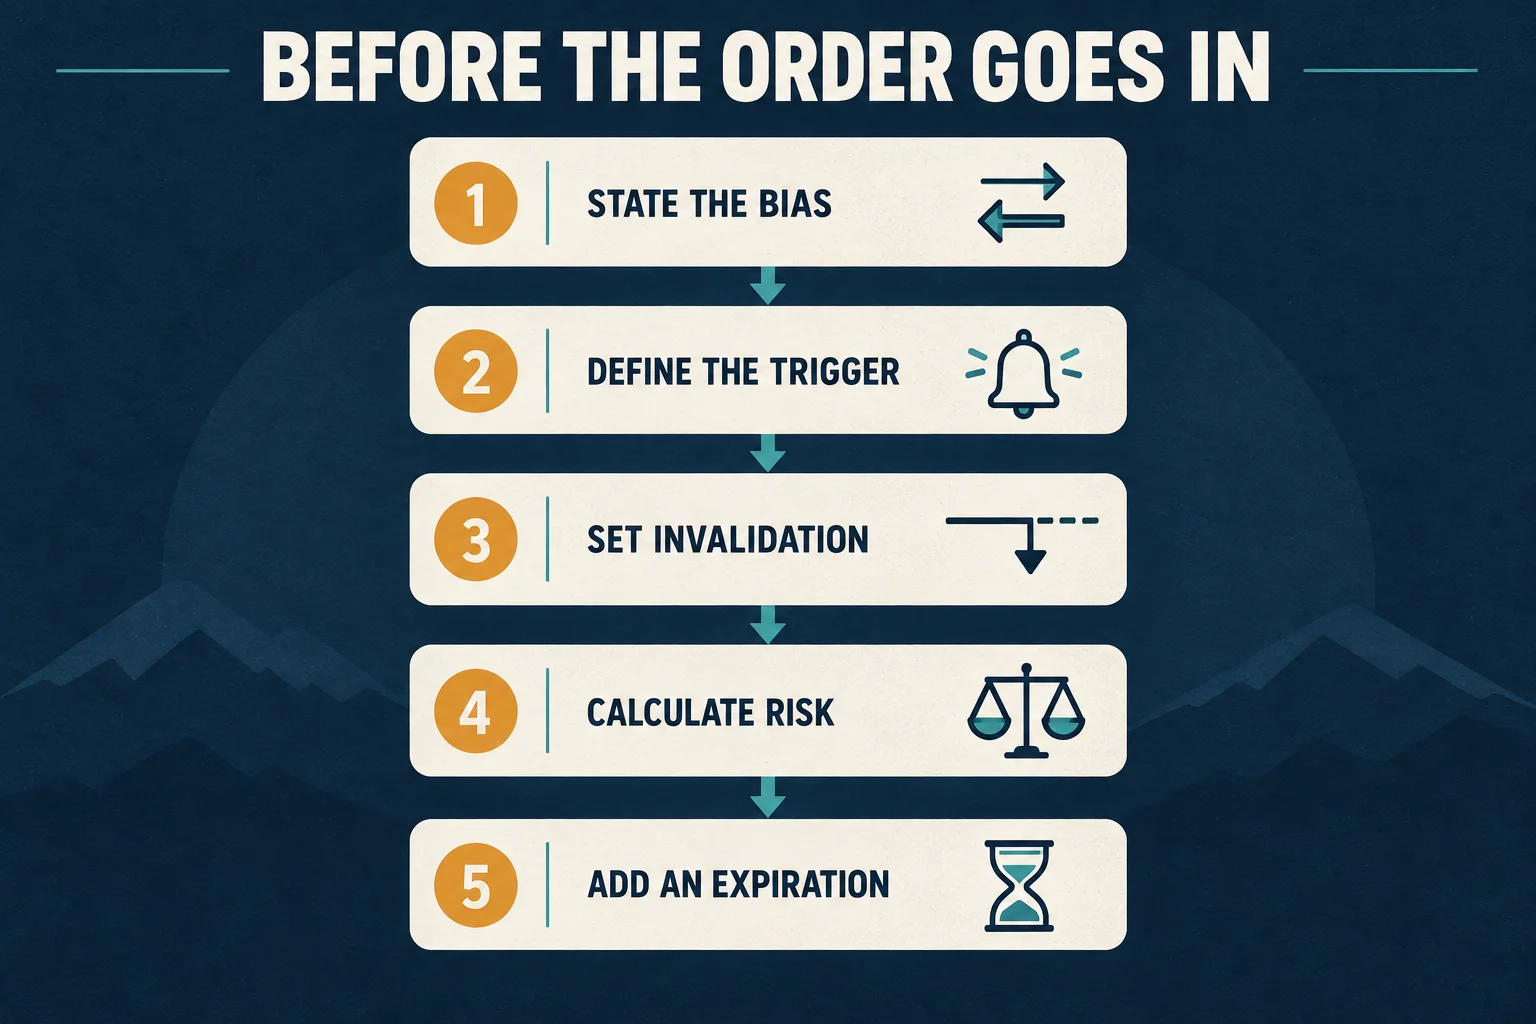
The five checks shown above are general pre-trade housekeeping rather than ICT concepts: state the conditional bias, define the trigger, set the invalidation, size the risk from the stop distance, and give the idea an expiration. A trade that cannot be described that way cannot be reviewed afterwards, which is the point of the written narrative ICT describes.
One reported figure in the lecture should be treated with care. Near 50:14, ICT says a small move in that session was “enough to make $2,100”, and notes in the next breath that it was “on paper, because it's holiday”. The recording supplies no account record, fill, position size, stop or independent verification, so this is an attributed illustrative figure as the speaker reports it, not verified performance, and not a reason to expect a similar result. He also says at 54:48 that he expects to return to live streaming on 10 February 2026.
Watch the ICT Vision and Execution Lesson
This article draws on the automatically transcribed English audio of From Vision To Execution (3,311 seconds, 55:11). The transcript is a source for the speaker’s words, not independent proof of the results he reports, and the chart work he walks through remains part of the lesson.
Watch the original lesson on YouTube
The video cannot be played inside another website: when its embedded player was opened and clicked on 14 September 2026, the player itself reported “Playback on other websites has been disabled by the video owner.” and settled on a “Watch on YouTube” prompt, with no duration and no playback progress reported. That message is the reason no embed is left blank here; the recording itself is available directly on YouTube.
ICT Trade Framework Sources and Further Reading
- From Vision To Execution: the primary source. The timestamp links in this article jump to the passages they summarize.
- The first-party post that links to the recording: attributed to @I_Am_The_ICT, “From Vision To Execution”, 2:31 a.m. · 2 Jan 2026, pointing to youtu.be/rXgEMIJ1fQg (the same video identifier as the upload mapped to this article).
- YouTube Help: restrict embedding: platform documentation relevant to why the recording cannot be played on this page.
- CFTC Letter No. 01-60: a US regulatory communication on presenting hypothetical or simulated performance. It is a reference for how such figures should be labeled, not a finding about this recording.
Method note: captions were not available for this upload, so this article was written from the automatically transcribed English audio of the full recording (local speech-to-text). Automatic transcription renders some terminology inconsistently (“SIBI”, “turtle soup”, “PD array”, “macro”, “suspension block”, “Model 22”), and those labels, along with the chart's own prices and markings, should be checked against the recording. The reviewer read the timestamped transcript; the recorded charts were not independently visible.
This is independent educational commentary on one lecture. It is not official ICT material, not a tested trading system, not investment advice, and not evidence that the approach described produces the results the speaker reports.

