
Key takeaways
In Analysis Delivering On NQ, ICT reviews how the previous session’s Nasdaq plan played out rather than presenting a new forecast.
Read the full summary
In Analysis Delivering On NQ, ICT reviews how the previous session’s Nasdaq plan played out rather than presenting a new forecast. He starts on the 15-minute chart for the September 2026 Nasdaq contract with levels carried over from the prior analysis, names a nearer “low-hanging fruit” objective and a more ambitious best-case extension, drops to a one-minute view for the open, and describes the sell-side liquidity pool and inefficiency he had marked as the draw. He also states one condition that would have cancelled his morning bearish interest altogether — a specific high being taken out. Price then reached the marked area, and ICT explains where a short would have been considered; he says plainly that he did not take executions that morning, so the entry discussion is hypothetical and no fill, price or result is verified here. Everything below comes from the recording’s automatically transcribed audio.
How we researched this article
BestProps used document-based research from primary firm sources, checked September 14, 2026. The complete source list, scope, limitations, and commercial-state record appear near the end of this article.
In “Analysis Delivering On NQ”, ICT reviews a Nasdaq September 2026 contract chart and follows the opening movement from a 15-minute framework down to a one-minute view. The lesson focuses on predefined liquidity objectives, reactions around an imbalance and the conditions that would support—or invalidate—a bearish intraday idea.
This is a review of ICT’s interpretation of the session, not independent proof that the concepts provide a repeatable trading edge. ICT also says that he did not execute a trade during the recording.
The initial 15-minute framework
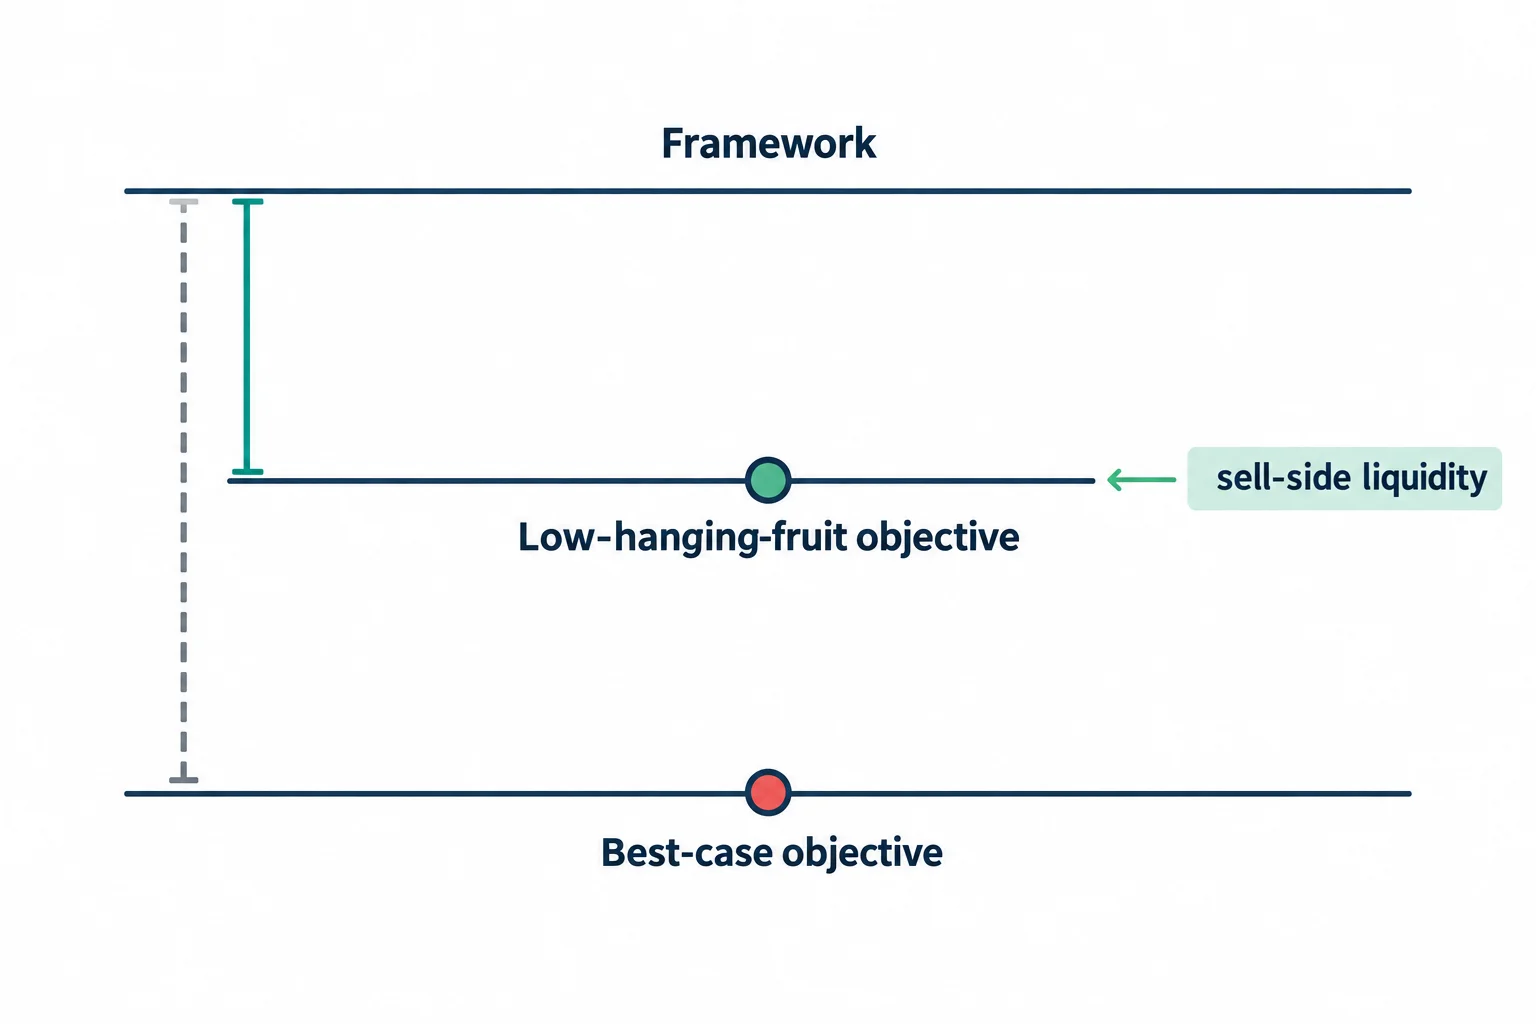
At 0:01, ICT identifies the chart as the 15-minute timeframe for the Nasdaq September 2026 delivery contract. Most of the markings were carried over from his prior analysis, with two additional lines added for the current review.
His principal bearish scenario was for price to move below a marked low and then treat an existing imbalance as an inversion. He refers to a nearby sell-side liquidity pool and an inefficiency previously shaded on the chart. Because the transcript cannot show the chart itself, the precise boundaries and prices of these areas cannot be reconstructed from the audio alone.
ICT also distinguishes between two types of objectives at 1:11:
- Low-hanging-fruit objective: the nearer and, in his view, more attainable destination.
- Best-case objective: a more ambitious extension that might be reached if downward momentum continued.
In general educational terms, this distinction illustrates scenario planning: a market thesis can contain a primary objective and a secondary extension rather than depending on one all-or-nothing forecast. ICT discusses taking most of a hypothetical short position off at the nearer objective and leaving a small remainder for the extended target. That is his trade-management commentary, not a recommendation or a documented execution.
Dropping to the one-minute chart
Around 2:47, ICT narrows the larger dealing range and prepares to watch the open on a one-minute timeframe. He identifies minor inefficiency and relative equal highs above the market. His stated concern is that price could rally into those highs before declining.
He establishes a clear invalidation condition at 3:50: if a particular high were taken, he would no longer be interested in looking for a morning short and might instead wait for the afternoon session. This is one of the most useful structural points in the recording. The analysis does not merely identify a destination; it also names an event that would cause ICT to abandon or defer the idea.
When the market opens, ICT describes a sharp upward reaction and substantial volatility. At 4:51, he characterizes the first 35 seconds as moving more than 100 handles. That figure is stated in the narration but cannot be independently checked against unseen chart data.
What ICT watched after the opening surge
Rather than treating the initial rally alone as a short signal, ICT watches whether candle bodies remain below a marked level. He later notes that price cleared a high without leaving candle bodies above it and that bodies remained within the gap carried over from the 15-minute analysis.
At 7:15, he argues that a move beneath the nearby low could build momentum toward the previously identified inefficiency. The educational sequence presented is:
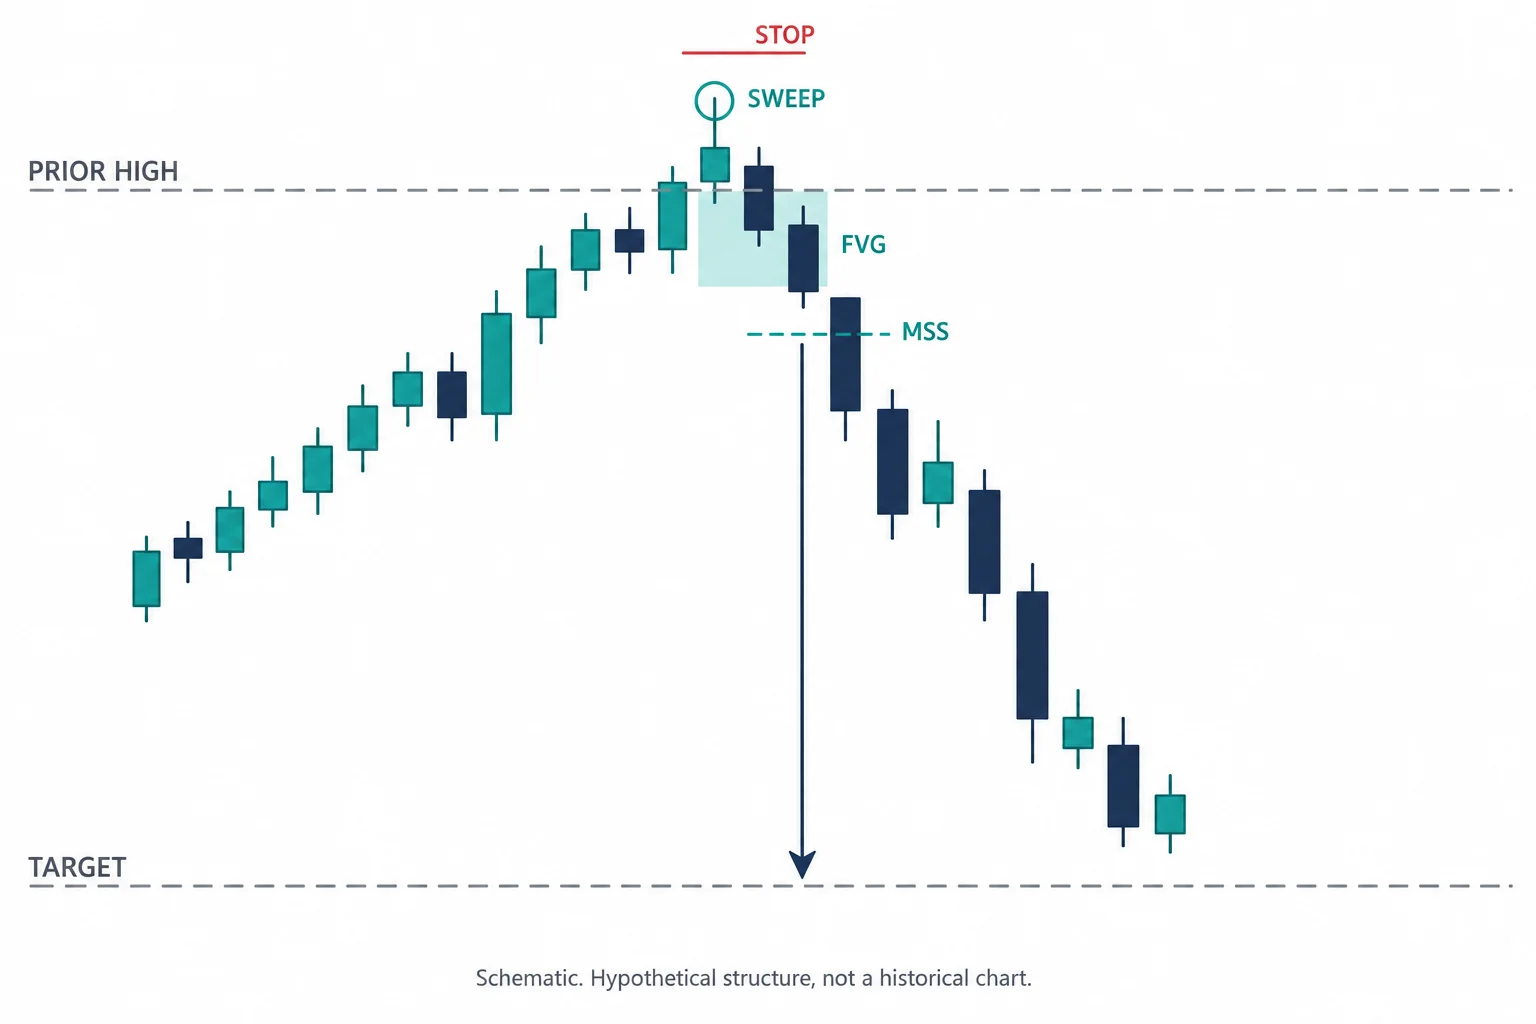
- Start with a higher-timeframe liquidity objective.
- Identify an imbalance or gap that may influence price.
- Move to a lower timeframe near the opening period.
- Observe whether price accepts above a key high or rejects it.
- Look for movement toward the predefined lower objective only while the bearish conditions remain intact.
ICT describes price reaching the edge of the targeted area near 8:08. He then says that a close below the area would support further movement lower.
The hypothetical short entry
At 8:30, ICT answers where he would have considered a short. He points to a sequence in which price moved above a referenced level, fell back below it and then retested the area. His explanation relies on the upper portion of a wick having already performed the liquidity-seeking movement, after which he would hypothetically work from the lower half.
This was retrospective explanation, not evidence of a fill. Earlier, at 2:19, ICT explicitly says he would not show or take executions that morning because he felt fatigued. Later remarks in the video also acknowledge that he did not short the move.
Reviewing the move on the 15-minute chart
After the lower area is reached, ICT returns to the 15-minute chart at 12:05. He states that price moved toward the sell-side liquidity pool and into the inefficiency discussed in the earlier analysis.
For any continuation lower, he wanted the relevant gap to behave as an inversion fair value gap. He describes the preferred candle behavior as allowing a wick into the area while keeping the body in its lower portion. In ICT’s framework, that behavior would add weight to the possibility of another move toward the lower marked low. He nevertheless says the movement already observed was sufficient for the original scenario.
Key educational takeaways
- ICT begins with a 15-minute narrative before using the one-minute chart for closer observation.
- He separates a nearer liquidity objective from a best-case extension.
- He defines a condition that would cancel his morning bearish interest.
- He emphasizes candle-body acceptance or rejection around a gap, rather than relying only on a wick through a level.
- The entry discussed after the move is hypothetical; the transcript documents no executed trade, fill price or financial result.
The recording is best understood as a worked example of ICT’s own liquidity-and-inefficiency framework. It does not establish future performance, and viewers cannot verify the exact chart levels from the transcript alone.
Related source video: Analysis Delivering On NQ
The recording mapped to this topic is Analysis Delivering On NQ on the channel The Inner Circle Trader. Its watch page was read on 2026-09-14 and returned that title, a runtime of 13:48 and a publication date of 2026-07-07, so the public recording behind this query does exist. The upload date is the date the video was published, not necessarily the calendar date of the session shown, and the transcript does not state such a date. The summary above was produced from that recording’s audio, transcribed locally on 2026-09-14 with automatic speech recognition rather than human-verified captions. The transcript is machine-generated: specialist terms and numbers can be misheard — for example, the phrase ICT uses for the midpoint of an imbalance arrives as “consequent encouragement” or “consequence encroachment” — and the timestamps are approximate. No chart, order ticket or account statement was inspected, so the levels, candle behaviour and the hypothetical entry are reported as ICT described them and not as verified executions.
Watch the original recording on YouTube
This recording cannot be played inside another website. An embedded player test run on 2026-09-14 from a BestProps page origin returned, from the player itself, “Playback on other websites has been disabled by the video owner”, and the player never advanced past zero seconds. No player area is therefore reserved here and no blank embed is left behind. The recording remains available directly on YouTube.
Sources for session hours, chart conventions and funded-account limits
Three references support this article alongside the source recording: the chart-platform documentation that separates regular from extended trading hours, the same vendor’s explanation of how futures sessions are scheduled, and this site’s documented drawdown comparison. None of them states an outcome for the session described above, and none reports an NQ price level.
Start with the recording, not a repost of it
The mapped upload Analysis Delivering On NQ was located for this article: its watch page was read on 2026-09-14 and its full audio was transcribed locally the same day.[1] That is why the terminology and the sequence above come from the recording itself rather than from search snippets or third-party recaps. The remaining caveat is the automatic nature of the transcript: a misheard term or number is possible, and nothing visual in the video was verified.
Regular and extended hours are chart settings, not opinions
The session framing this article depends on — opening behaviour on one chart versus a higher-timeframe range — is documented by the platform rather than by trading commentary. NinjaTrader’s knowledge base states that “Trading Hours Templates dictate the session start and end times for an instrument displayed on a Chart in the NinjaTrader Desktop app”, and that a chart can be set to show “Regular Trading Hours (RTH) instead of Extended Trading Hours (ETH)”. It adds that most default templates display “all available data for their respective instrument”, and that while many futures instruments trade 5 PM to 4 PM Central, Sunday through Friday, “some instrument categories have unique session start and end times determined by their respective exchanges”.[2] Two traders comparing the same instrument can therefore be comparing different sessions, which is why a study note should name the hours it used.
Know when the session actually starts and ends
The same vendor’s market-hours explainer states the overall calendar: “Most futures markets are open nearly 24 hours a day, six days a week—from Sunday at 6:00 pm ET to Friday at 5:00 pm ET—with a one-hour daily maintenance break”, and that “Trading hours are set by the exchange that lists the contract”.[3] A one-minute opening observation sits inside that longer session, which is why the label given to an opening period is a convention rather than something the exchange publishes as a rule.
Quote your own account limits rather than a generic figure
The risk framing above depends on limits that differ between providers and programmes. This site’s drawdown reference states the distinction plainly: “A static drawdown floor is fixed from the starting balance. A trailing drawdown floor moves up after profits and usually never moves back down.”[4] It also states that “The comparison is not a universal ranking” and that rules can change, so the figure that governs your account is the one in your own provider’s current documents and dashboard.
What could not be cited
The exchange that lists NQ is the authoritative source for contract specifications and product trading hours. Those exchange pages could not be read for this article — requests returned HTTP 403 — so no tick size, contract-month detail or exchange schedule is quoted here; confirm them from the exchange directly. No third-party indicator, community script or unaudited performance study is linked in this article.
Sources
- [1] YouTube: Analysis Delivering On NQ – The Inner Circle Trader (source recording; watch page read and full audio transcribed locally 2026-09-14)
- [2] NinjaTrader Knowledge Base: Trading Hours Templates – Desktop (RTH and ETH session templates; article updated 8/14/2026, read 2026-09-13)
- [3] NinjaTrader: Futures Trading Hours – Can You Trade Futures 24/7? (Sunday 6:00 pm ET to Friday 5:00 pm ET schedule; published May 15, 2025, read 2026-09-13)
- [4] BestProps: Prop Firm Drawdown Rules by Calculation Method (static versus trailing floors; read 2026-09-13)
Educational commentary only; this article does not provide individualized financial advice or promise trading results. BestProps is not affiliated with The Inner Circle Trader or with NinjaTrader, and no source listed here endorses this article, this site or any setup. The session above is ICT’s own analysis, reproduced from an automatic transcript; he states in the recording that he took no executions, the discussed entry is hypothetical, and no fill, price level, win rate or account result was verified. Nothing here demonstrates a tested, repeatable or profitable method. Liquidity, inefficiency, inversion fair value gap, market structure shift and consequent encroachment are used on this page only as descriptive study terms, and no claim is made that any level repaints less, predicts price or was tested on a live account. Futures and other leveraged products involve substantial risk, and prop-firm rules and account terms can change, so review your provider’s current official documentation before trading.