
Key takeaways
The Inner Circle Trader’s Trading All Time Market Highs, published September 16, 2025 and available on YouTube, presents a discretionary daily-chart framework for forex, futures, stocks and Nasdaq in which record highs favor further highs until price demonstrates a broader reversal, rather than encouraging traders to predict the exact top.
Read the full summary
The Inner Circle Trader’s Trading All Time Market Highs, published September 16, 2025 and available on YouTube, presents a discretionary daily-chart framework for forex, futures, stocks and Nasdaq in which record highs favor further highs until price demonstrates a broader reversal, rather than encouraging traders to predict the exact top. ICT marks prior daily closes, opening gaps, down-close rejection blocks, overshoots that may trap bears, and premium candle wicks divided into 75 percent, 50 percent consequent encroachment and other quadrant levels, while immediate rebalance describes a rapid gap closure and redelivery through a prior candle’s range. The Nasdaq walkthrough cites an unverified speech-to-text level of 24,403.50 and remains on the daily timeframe. ICT says no position should use enough leverage or gearing for one loss to threaten the account, advises either skipping the trade or relying on money and trade management, and explicitly warns viewers not to risk real money with the lesson the next day. The article recommends preparing with range, approach, nearby references, timing, and written continuation and failure scenarios, but the recording provides no fills, account results, backtest, stop-loss rule, position-size formula or mechanical reversal definition, while its charts and quoted figures were not independently verified and the source transcript may contain terminology errors.
How we researched this article
BestProps used document-based research from primary firm sources, checked September 24, 2026. The complete source list, scope, limitations, and commercial-state record appear near the end of this article.
In Trading All Time Market Highs, published September 16, 2025 by The Inner Circle Trader, ICT presents a framework for studying markets that are near or beyond a previous record high. The central lesson is not that prices must keep rising indefinitely. Rather, he argues that traders should resist trying to predict the exact top while the market continues to demonstrate bullish behaviour.
This article is grounded in an automated speech-to-text transcription of the full recording, not in human-verified captions, and the charts were not independently inspected. Where a figure appears below it is a transcription of the speaker’s words and is labelled as such.
Why ICT Traders Should Stop Picking Market Highs
ICT opens by describing his own earlier desire to identify the final high of a bull market, and he says that impulse cost him opportunities (2:10). At 2:29, he states that nobody can reliably tell you when a bull market is complete, and that the attempt is a guess rather than a science. His reason is that there is no established upper boundary to measure against: participants keep pressing the extreme further out (2:50).
His proposed starting assumption therefore runs the other way: a market making record highs is more likely to make additional highs until the price action itself supplies persuasive evidence of a reversal. That is his interpretation of how these markets behave, not a demonstrated rule or an assurance about what any market will do next.
What ICT Trading at All Time Highs Teaches
ICT frames the session as a topical study rather than a trading model. At 3:37, he says the material is written so that it applies to forex, futures and other markets, even though the walk-through uses a Nasdaq chart. He also says the study is not a one-off: at 3:14, he advises building a library of observations over time rather than expecting a single video to change anything.
Two practical warnings come early. He asks viewers not to go out the next day and risk real money with the material (0:49), and he says he will never message anyone privately on Telegram, because accounts impersonating him are offering fake investment and automated-trading schemes (1:34).
ICT Market High Reference Points
Beginning at 5:09ICT lists the concepts he watches when studying pullbacks with the market at an all-time high:
- The market’s own tendency: when a market is at all-time highs, it is more likely to keep posting higher all-time highs.
- Previous candle closes: he monitors whether price trades beneath the closing price of a prior daily candle after the open.
- Down-close candles and rejection blocks: in his terminology, the closing price of a down-close candle can act as a level from which price is rejected upward, and such levels tend to promote new runs higher.
- Opening gaps and prior-day closes: a return to the previous session’s close may rebalance an opening-range gap, but he says price can overshoot that close first.
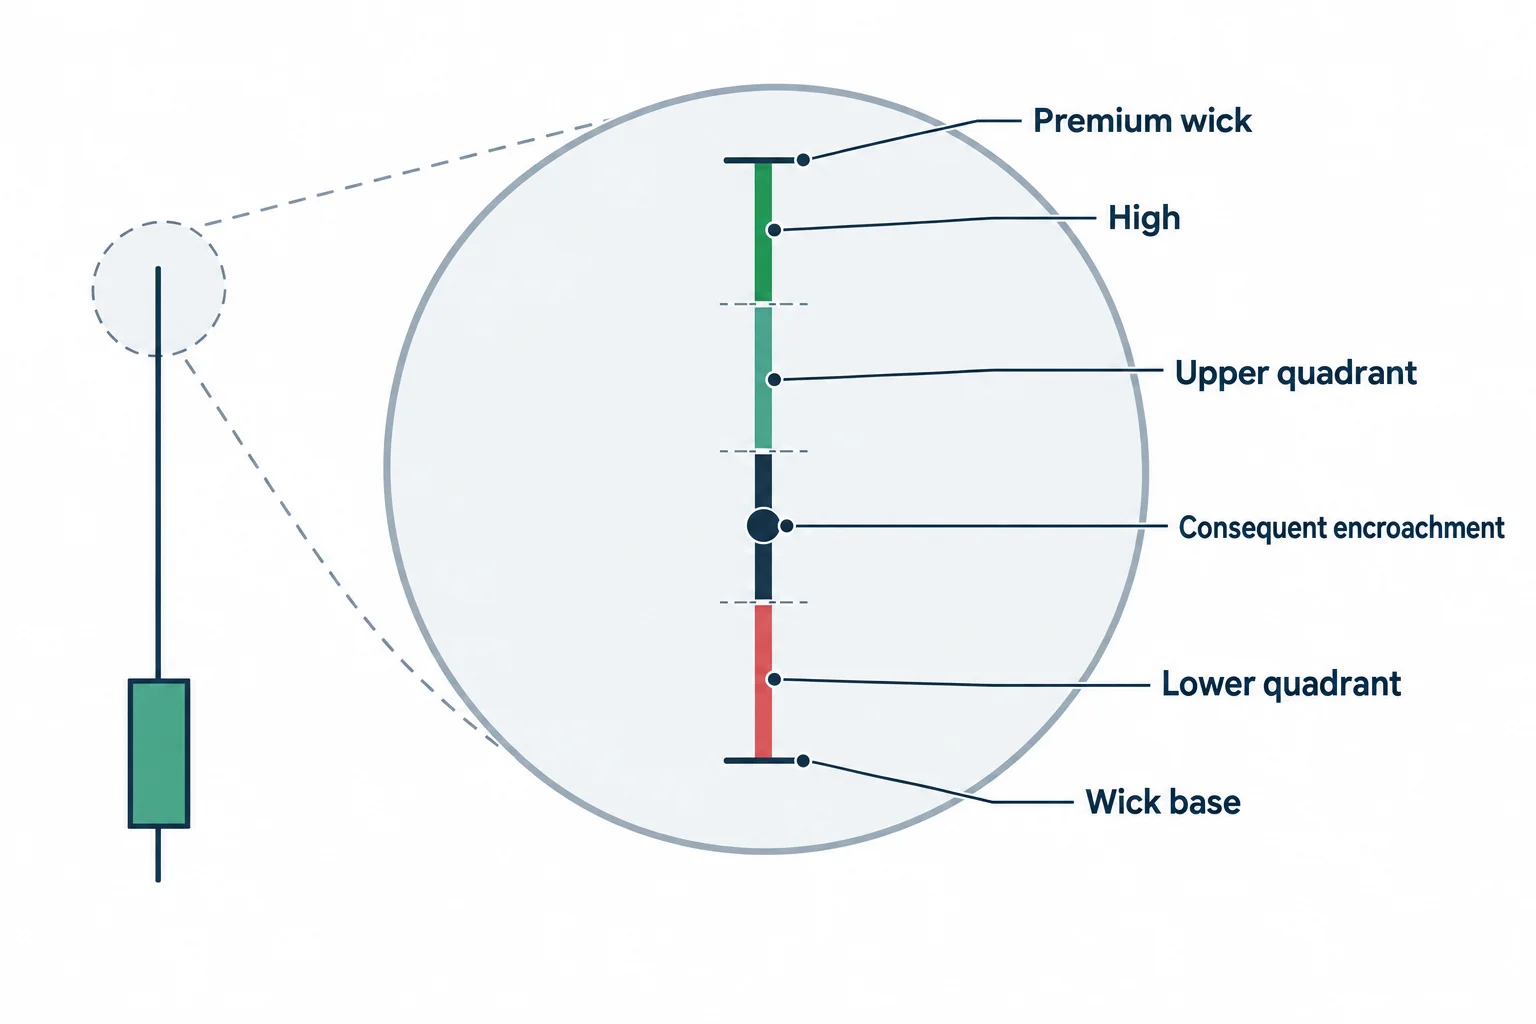
- Premium candle wicks: he grades selected wicks and divides them into gradient levels, including the midpoint, which he calls consequent encroachment, and expects them to offer what he calls discount sensitivity.
- Immediate rebalance: his term for a rapid return back through a recent candle’s range, which he interprets as a particularly strong reaction.
One phrase in this list is unclear in the automatic transcription. Around 5:36, he refers to a buy-side and sell-side imbalance concept that the transcript renders ambiguously; its exact wording should be checked against the presentation and audio rather than taken from this article.
Risk Control for ICT Market High Trades
ICT does not suggest that a bullish bias prevents losses. From 6:42, he addresses the objection directly: if you are long and the market collapses, that is part of trading. His response is that no single position should carry enough leverage or gearing to undermine the trader, and that if one transaction’s outcome threatens your account, the position is too large (7:27). He offers two acceptable paths: let the market go without you, or accept buy signals and let money management and trade management do their work.
That framing matters because “stay bullish until proven otherwise” can be misread as permission to hold an unlimited loss. The transcript supplies no stop-loss rule, position-size formula, or objective definition of when a reversal is complete.
ICT Daily Chart Walkthrough at Market Highs
The chart discussion begins at 8:07. ICT says he is working from a daily Nasdaq chart and will not drop to lower time frames in this lesson. He points to the prior record high that preceded the advance, which he quotes as trading up to a level transcribed as 24,403.50 (8:34); that figure comes from speech recognition and was not verified against the chart.
From there he traces a sell-side liquidity raid below a low, a gravitation back toward a short-term high, and his expectation that the high would be taken out rather than treated as a ceiling (8:51).
His recurring example involves price opening away from the previous day’s close and then returning toward it. A trader might expect price merely to close the gap and resume the advance. ICT says that near record highs price may instead move beyond the prior close before turning back up. At 10:28, he characterises the deeper move as a potential bear trap: the overshoot encourages traders to conclude that a top has formed, shortly before price recovers. He then walks through several days in which the same pattern repeats, and where the reaction instead occurs at a graded wick level.
The repeated analytical pattern he demonstrates is:
- Begin from a bullish higher-time-frame assumption because price sits near record highs.
- Mark prior daily closes and the relevant portions of earlier candle wicks.
- Allow for price to move below the obvious gap-closing level rather than treating the first overshoot as proof of a reversal.
- Observe whether price responds at one of the previously marked reference areas.
- Abandon the bullish interpretation when the market demonstrates a broader breakdown, rather than when a top merely looks plausible.
At 14:55, he anticipates the objection that he is cherry-picking examples: he tells viewers to go back over old market data and to test the behaviour on stocks as well, noting that gaps there tend to be larger.
ICT Market High Liquidity and Rebalance Mechanics
Immediate rebalance. From 11:56, he shows a large up-close candle, a return to the previous day’s close, and then an overshoot all the way back to the prior candle to deliver what he calls an immediate rebalance, the close of the gap plus redelivery back to that candle’s high. In his reading, that produces a strong reaction and the market treats the area as a discount array before launching higher.
Rejection blocks and graded wicks. From 13:00, he shows the open trading below the previous day’s close (the rejection block) and then measures a premium candle wick into lower quadrant, consequent encroachment and upper quadrant levels (13:37). He notes price reacting at the 75% quadrant in one instance and at the 50% level in another, and says these premium wicks should stay annotated because price will return to those levels again. He repeats the point at 16:15: the sequence he expects is another overshoot of the prior close, another top call from traders, and then price running back over them toward the record high.
He closes the chart work by warning against looking for shorts until the market visibly reverses: “until the market completely collapses and shows you it’s reversed, don’t look for shorts” (17:46). He frames the benefit as staying aligned with the higher-time-frame narrative and being able to weather the daily range, not as a guarantee of outcome.
ICT Market High Trade Preparation Checklist
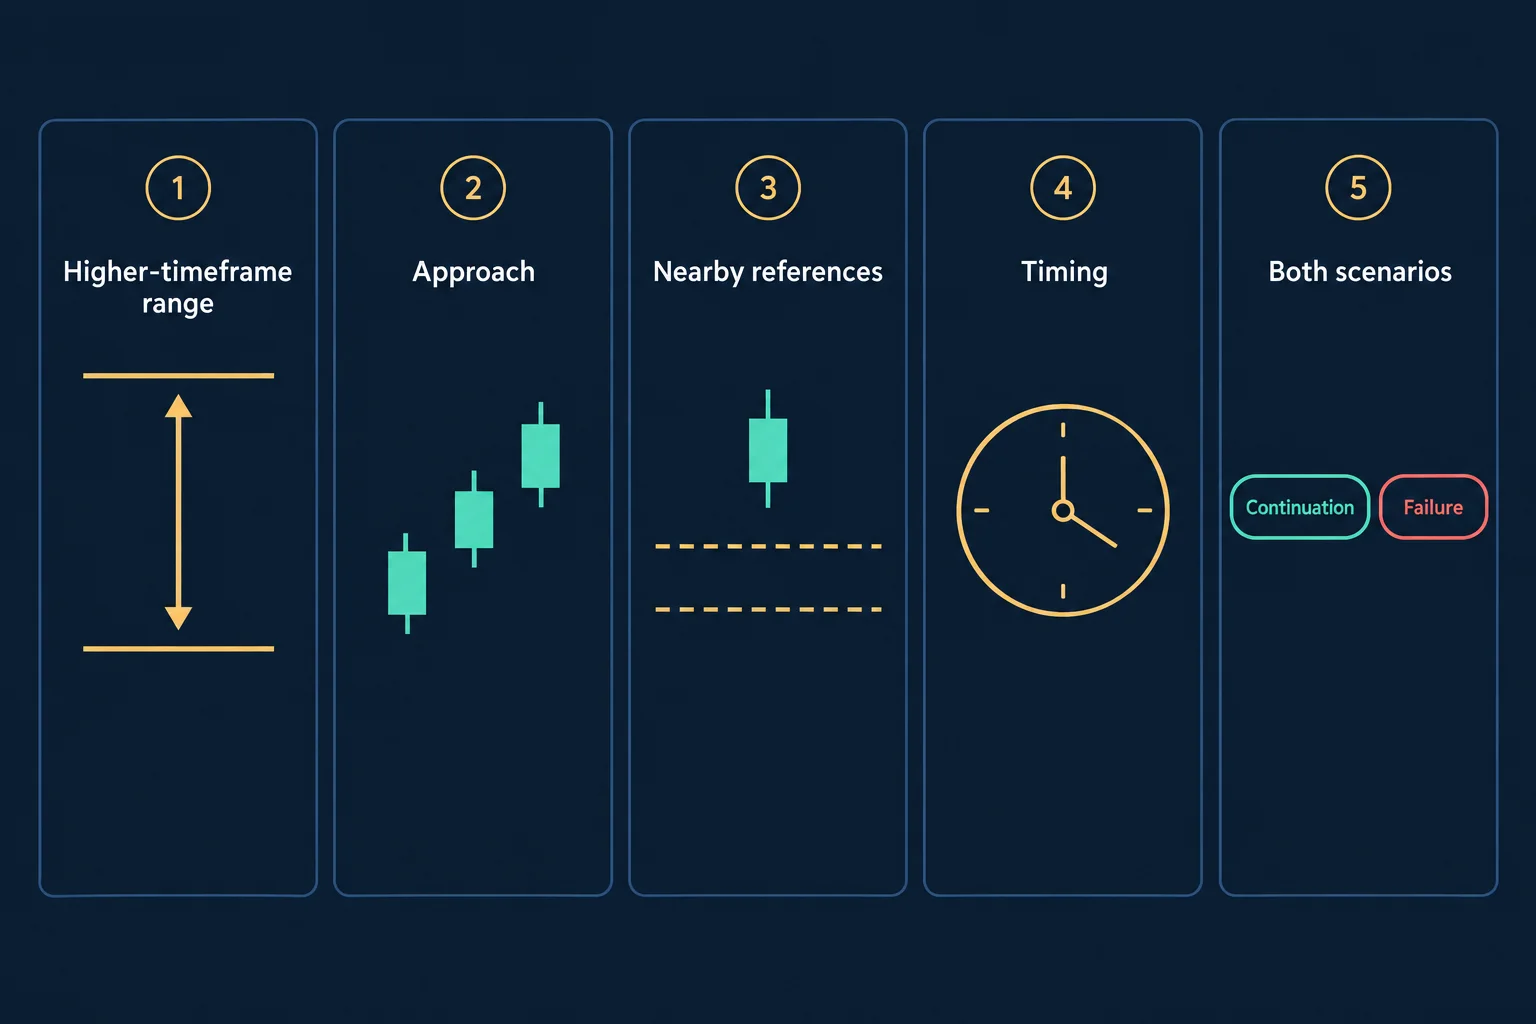
Set beside his terminology, the session supports a preparation routine that a reader can apply without adopting his model. The items below are general study practice drawn from this lesson, not claims the recording makes about edge or profitability.
- Range: define the higher-time-frame range you are working inside before looking for entries.
- Approach: note how price is arriving at a reference (extended, grinding, or after a failed break).
- Nearby references: mark prior daily closes, any opening-range gap, and the candle wicks you intend to grade.
- Timing: record the session and any scheduled release window that could change conditions.
- Both scenarios: write the continuation case and the failure case before the session, including what would invalidate your reading.
What ICT Market High Trading Cannot Establish
The lesson is a discretionary chart-reading framework. It reports no fills, no account results and no performance test, and ICT states outright that identifying the end of a bull market is a guess. Terms such as bear trap, rejection block or immediate rebalance are his descriptions of behaviour he sees on a daily chart; the transcript provides no independent evidence that the pattern, or his reading of why it happens, recurs predictably. Anyone using the material should treat it as a prompt for historical study (annotating examples without hindsight and recording the cases that fail as carefully as the ones that work) rather than as a validated system.
Watch ICT Trading All Time Market Highs
This article draws on an automated transcription of the full recording. The transcript is the source for the speaker’s words and for the timestamps used above; it is not independent proof that the chart markings appeared as described. The recording’s visuals remain the primary reference when following the annotations.
Watch the original recording on YouTube
This video cannot be played inside another website: when its embedded player was opened from a BestProps page and clicked on 14 September 2026, the player itself reported “Playback on other websites has been disabled by the video owner.” and settled on a “Watch on YouTube” prompt, with no duration and no playback progress reported. That message is why no player is reserved or left blank here; the recording is available directly on YouTube.
ICT Market High Trading Sources and Further Reading
- Trading All Time Market Highs (The Inner Circle Trader) the primary source for this article; every timestamp link above points into this recording.
- Nasdaq-100 index information (Nasdaq) the exchange operator’s own page for the index family the lecture uses as its chart.
- How stock markets work (SEC Investor.gov) regulator-published background on orders, liquidity and price discovery, useful for separating ICT’s vocabulary from standard market mechanics.
- “Trading All Time Market Highs”, ICT Archivist an unofficial third-party summary page for this recording. It is not affiliated with the speaker, was not reviewed or tested here, and is listed only as an independent note-taking example.
Editor’s note: this page reviews one speaker’s stated framework for studying markets at record highs. It contains no verified trade record and is not investment advice or a promise of trading performance. Quoted levels and terminology come from the recording and its automated transcription; the charts were not independently inspected.

