
Key takeaways
In his own lesson Trading All Time Highs and Disregarding TGIF (The Inner Circle Trader, published 19 September 2025), ICT states his usual Friday expectation first – after a bullish week he looks for a retracement of roughly 20% to 30% of the weekly range, sometimes as much as 40%, and the mirror expectation after…
Read the full summary
In his own lesson Trading All Time Highs and Disregarding TGIF (The Inner Circle Trader, published 19 September 2025), ICT states his usual Friday expectation first – after a bullish week he looks for a retracement of roughly 20% to 30% of the weekly range, sometimes as much as 40%, and the mirror expectation after a bearish week – and then gives the reason he sets it aside at all-time highs: with no older chart high above price, the market can simply keep going.[t=0:46] He returns to the same idea later by warning against trying to pick tops just because price is at record territory.[t=9:24] The rest of the Friday session he reviews is read through his own toolkit: a graded Thursday wick transposed onto a Nasdaq one-minute chart, a fair value gap he reclassifies as reclaimed, pre-market sell-side liquidity used as a target, the Dollar Index treated only as a barometer, and a GBP/USD London-window setup. ICT is the source of the retracement percentages, the levels and the executions recounted here; this page attributes them to him, has not verified any fill or result, and is not a recommendation to copy a trade.
How we researched this article
BestProps used document-based research from primary firm sources, checked September 24, 2026. The complete source list, scope, limitations, and commercial-state record appear near the end of this article.
What this recording is, and how this page uses it
The article below is written against the mapped recording itself: Trading All Time Highs and Disregarding TGIF on the channel The Inner Circle Trader.[1] It is a public first-party upload dated 19 September 2025 with a runtime of 905 seconds (15:05), and the presenter opens it by naming the same day – “this is September 19th, this is Friday” – so the spoken date and the platform date agree in this case rather than falling on different sides of midnight UTC.[t=0:00]
Two limits matter before reading further. First, the recording’s own audio was transcribed in full with local automatic speech recognition because captions were unavailable, so the timings quoted in this article are approximate and ICT-specific terms and numbers can be mis-transcribed. Terms are normalised only where the surrounding sentence makes the intended word clear – for example an artefact transcribed as “a wick inside of a bison balance, self-sign efficiency” is rendered below as a wick inside a buy-side imbalance and sell-side inefficiency, which is what the sentence describes. Where a term or number stays genuinely ambiguous it is flagged rather than smoothed over. Second, no video frame was visually inspected for this article: everything below is what the speaker says, and no plotted level, candle relationship or order marker is asserted as fact from the chart.
The TGIF premise ICT states, and the exception he adds
ICT introduces the topic by naming the lesson and then defining TGIF – “thank God it’s Friday” – as a late-week retracement expectation: in a bullish week he looks for price to retrace roughly 20% to 30% of the weekly range, and as much as 40%; in a bearish week he expects the same 20% to 30%, up to 40%, in the opposite direction.[t=0:46]
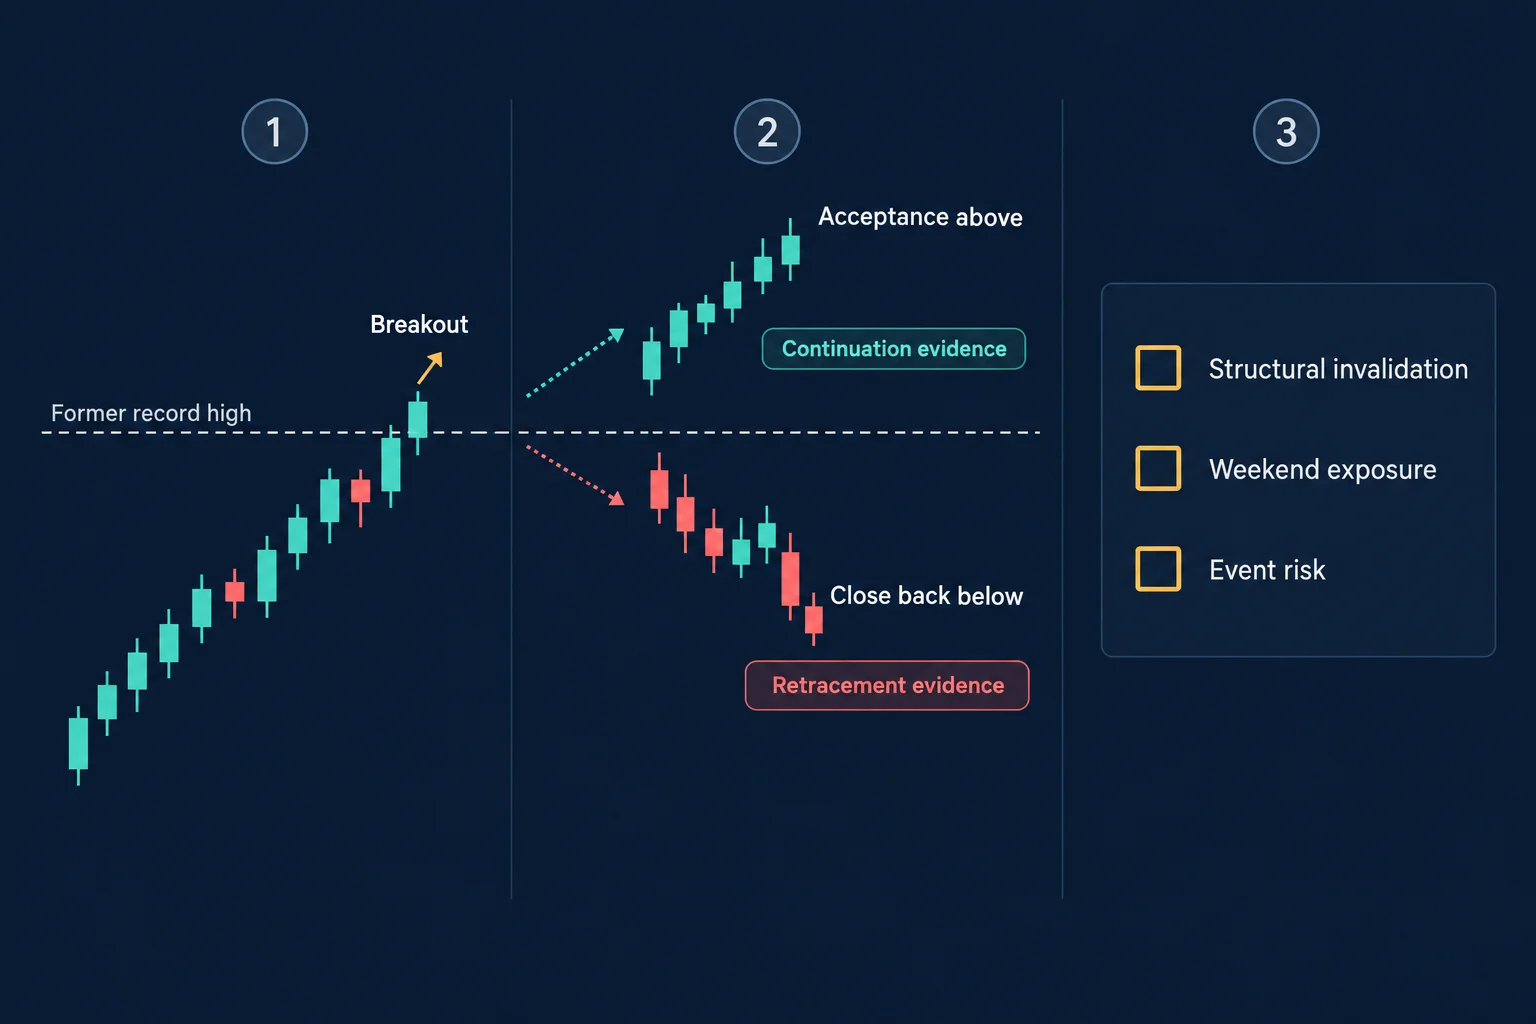
The exception is the point of the lecture. When the market is at all-time highs he disregards TGIF, in his words because “it can keep going and keep going and keep going”.[t=1:07] Read plainly, that is a statement of market context rather than a signal: the session he then walks through contains both a short he took and a rally that took out stands of liquidity to the upside, and he closes the Nasdaq segment by saying this is why you do not try to pick tops at all-time highs.[t=9:24] Nothing in the recording establishes what a future session will do, and the percentages are his working expectation, not a measured study.
The Nasdaq session he reviewed, in his own terms
The main example pairs a daily Nasdaq chart with a one-minute chart of the December 2025 Nasdaq E-mini contract – the mini, not the micro, as he specifies.[t=1:21] He describes the daily chart as having kept powering higher through the week, with a small volume imbalance still present where the session opened, an overnight drop during the London session, and a rally back into the latter part of the day.
Grading Thursday’s premium wick
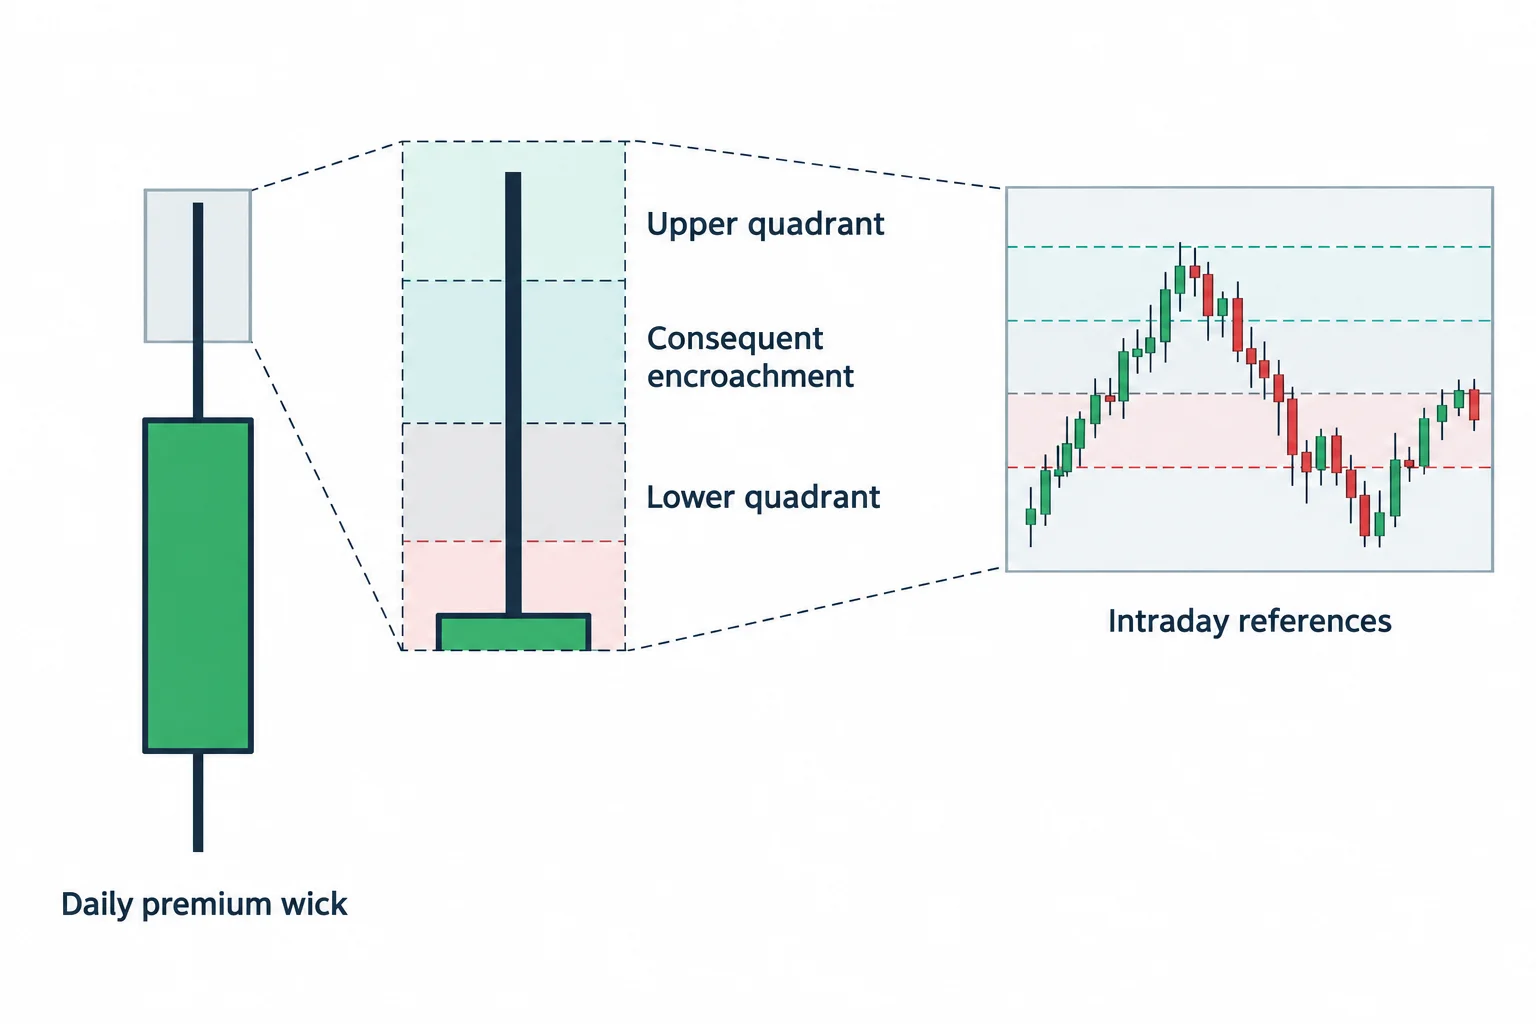
He then grades the prior day’s premium wick into reference levels: the candle’s close, the lower quadrant, the consequent encroachment at the halfway point, the upper quadrant and the high, and he transposes those daily levels onto the one-minute chart so the intraday reactions can be judged against them.[t=2:11] The teaching point is multi-time-frame context: levels taken from the prior daily candle do the organising work instead of every one-minute swing being treated as equally meaningful.
Conflicting arrays, and the break he refuses to call a shift
Earlier that morning he had flagged a level as suspect on social media, a reference he repeats in the lecture while describing it as pre-session sell-side liquidity.[t=2:50] From there he points to an intraday fair value gap, price returning into it more than once with candle bodies staying inside it, and a rally that hits a prior high before breaking lower. That break, he says, should not be classified as a valid market structure shift, because the wick sits inside an imbalance and an inefficiency, so two PD arrays are in conflict.[t=3:44] He is explicit that this is his classification, not a universal rule.
He also notes two points in the same stretch where a short was available to him and says plainly that he did not take either of them.[t=3:53] Later price trades back into the same gap and continues through it, which is what makes it, in his wording, a reclaimed bearish fair value gap.[t=4:36] The pattern he demonstrates is that a gap or a swing is judged together with candle bodies, nearby imbalances and whether price accepts or rejects an area, not in isolation.
Targets, and what the transcript does and does not establish
As price returns into that gap a third time, his read is that repeated tests weaken it, and he describes the objective as pre-market session sell-side liquidity and the relative equal lows below.[t=5:27] His risk discussion follows: in a primarily bullish market he prefers to take a sell-side liquidity pool a tick or two above it, or right at it, rather than overreaching, because reversals can be fickle against the larger trend; in a bearish market he is willing to extend further.[t=5:49]
He then recounts his own executions from the session: an add near $24,798 at the high end of the reclaimed gap, another at the upper quadrant level near $24,790.50, a target he describes as overzealous, a reduction of two lots when price would not reach it, and the last two stopped out after he trailed the stop to the consequent encroachment of the first presented gap.[t=6:31] Those figures are his account of what he did, transcribed from speech by automatic recognition; no fill, order flow or account result is independently verified here, and the transcript cannot confirm chart coordinates. He is equally clear about the afternoon: had he been in front of the charts he would have wanted a section of price action at a volume imbalance,[t=7:35] and price went on to run the prior daily high’s liquidity and rally almost to $24,900.[t=9:12] The tension is the lesson itself: taking an intraday short is not the same as calling the end of a bullish market.
Dollar Index and GBP/USD
In the Forex section he uses the Dollar Index as a directional barometer, not as an instrument he trades – by his own account he has never traded it – and he reads the index as rallying through intraday reference levels into a daily volume imbalance before selling off into consolidation.[t=9:46][t=10:39]
GBP/USD – cable, which he calls one of his favourite Forex pairs and which he says he traded as pound futures when he worked as a commodity trader – carries the bearish setup aligned with the stronger-dollar read: a sweep of Asian-session buy-side liquidity, a break lower during the London open kill zone, a return into a bearish fair value gap, and continuation into a daily discount area during the New York window.[t=10:52][t=13:06][t=13:57] He adds one reusable note for viewers: when a daily chart opens where it closed and the directional premise is bearish, he grades the lower (“discount”) wick, because its subdivisions tend to matter in the first 30 minutes to an hour of trading.[t=11:29] He also states his own London trading window as 1:00 a.m. to 5:00 a.m. Eastern Time, allowing for daylight-saving shifts,[t=13:21] and points to his free 2016-2017 mentorship playlists on his own channel for the true-day-start convention at midnight Eastern Time, noting that the associated PDFs were only the slides.[t=12:09]
What a reader can take from it, and what they cannot
- The retracement percentages, the graded levels, the classification of the wick and the gap, and every execution figure are ICT’s own statements in this recording, and they are attributed to him here.
- His framework is methodology-specific. Fair value gap, consequent encroachment, PD array, kill zone and TGIF are descriptive study terms on this page, not established rules, and no indicator, script or strategy was tested, replayed or measured.
- An all-time-high condition is context, not a signal. It is not a reason to buy, and “disregarding TGIF” is not a licence to ignore risk: the same session he reviews contains a short he did take.
- Automatic transcription can mishear terms and numbers. Where a figure mattered, it is presented as his reported figure with that caveat, not as verified market data.
This page is an educational explanation of a public recording, not investment advice, and it does not promise an outcome.
Watch the original lesson on YouTube
The video cannot be played inside another website: when its embedded player was opened and clicked on 13 September 2026 and again on 14 September 2026, the player itself reported “Playback on other websites has been disabled by the video owner.” That is the video owner’s own player message, which is why this page carries a watch card rather than an embed; the recording is available directly on YouTube.
Watch Trading All Time Highs and Disregarding TGIF on YouTube ↗
Sources and how each one is used
Four references sit behind this page. The first is the recording the article is written from, transcribed end to end for this version and used for everything the speaker says about TGIF, the Nasdaq session, the Dollar Index and cable.[1] The second is the exchange operator’s own education page on price discovery, used only for the general meaning of the term and its description of how a regulated futures market establishes price.[2] The third is an unofficial third-party archive summary, dated 16 September 2025, of a different and earlier lesson on a similar subject, used only for what it itself states.[3] The fourth is an unofficial third-party commercial tutorial that older versions of this article linked in the body; it sells its own PDF eBook and is used only as a description of how the TGIF idea is presented outside ICT’s own material.[4]
Sources
- [1] YouTube: Trading All Time Highs and Disregarding TGIF – The Inner Circle Trader (mapped first-party recording; page metadata and player data read 13 September 2026 and re-checked 14 September 2026: public rather than private or unlisted, publish and upload time 19 September 2025, runtime 905 seconds; full audio transcribed locally with automatic speech recognition because no YouTube captions were available; embedded playback reported by the player as disabled by the video owner)
- [2] CME Group Institute: Price Discovery (official exchange education lesson; cited only for the definition and the auction description it states)
- [3] ICT Archivist: Trading All Time Market Highs (unofficial third-party summary page dated 16 September 2025 covering a different, earlier lesson; cited only for the summary it gives)
- [4] InnerCircleTrader.net: ICT TGIF Setup guide (unofficial third-party commercial tutorial, not an ICT publication; cited only for what it states)
What the third-party material is and is not
The archive summary at [3] and the tutorial at [4] are both third-party pages. Neither is an ICT publication or an official lesson, and neither was relied on for a claim about what ICT taught in the mapped recording: the retracement percentages, levels and executions quoted in this article come from the recording itself.[1] Indicators, scripts, tutorials and strategies referenced anywhere on this page are descriptive study terms only; none is presented as official, tested or free of repainting, and nothing here was tested, traded or measured for this article.
BestProps is not affiliated with The Inner Circle Trader, ICT Archivist, CME Group or InnerCircleTrader.net, and no source listed here endorses this article, this site or any setup. TGIF, displacement, market structure shift, fair value gap, liquidity, rejection block and premium are used on this page only as descriptive study terms. No historical price, forecast or backtest result is presented as verified, and nothing on this page promises a trading outcome.

