
How we researched this article
BestProps used document-based research from primary firm sources, checked September 24, 2026. The complete source list, scope, limitations, and commercial-state record appear near the end of this article.
ICT January 21, 2025 — NQ Premarket Turtle Soup Short is a transcript-grounded recap of the original January 21, 2025 recording on “January 21, 2025 – Live Execution \ NQ PreMarket Turtle Soup Short”.
TL;DR
ICT narrates a premarket short on the NASDAQ off a two-minute chart: buy-side liquidity is taken before the 9:30 a.m. Eastern opening bell, price returns into a sell-side imbalance / buy-side inefficiency for a limit sell, and he calls the setup “essentially a turtle soup” with a deferred entry. He reports scaling from one contract toward four, aims at sell-side liquidity resting on relative equal lows, later reduces his stop, and says he will not take partial exits. All of this is his spoken narration, captured by automatic speech recognition; no fill, exit price or result is independently verified here.[1]
The recording is a walkthrough of one trader’s own market interpretation on a live session, not proof that the described pattern produces a repeatable edge. The transcript exposes his reasoning and order-management commentary, but it does not verify the chart, the annotations, the order tickets, the reported fills, commissions, or the final outcome.[1]
The initial short thesis
At 0:13 he says he is going to be looking at shorting the NASDAQ, and he works from a two-minute chart because that is where the inefficiency he wants to trade is clearest to him. At 0:30 he describes selling into what the automated transcript renders as a “sell side imbalance, buy side inefficiency” — the array commonly abbreviated SIBI in ICT vocabulary — with the relative equal lows below the market serving as the sell-side liquidity he is aiming at 0:39. His protective stop is placed above the first candle of that imbalance 0:47.
At 1:09 he reports that a limit order to be short one contract has filled now that price has come back inside the area, and he says he would be interested in selling more if price reaches the midpoint of that array — the level he calls consequent encroachment, which he says he is adding around at 1:42. At 2:11 he states he is presently short two contracts with risk defined at the high of that array.
Why he calls it a Turtle Soup with a deferred entry
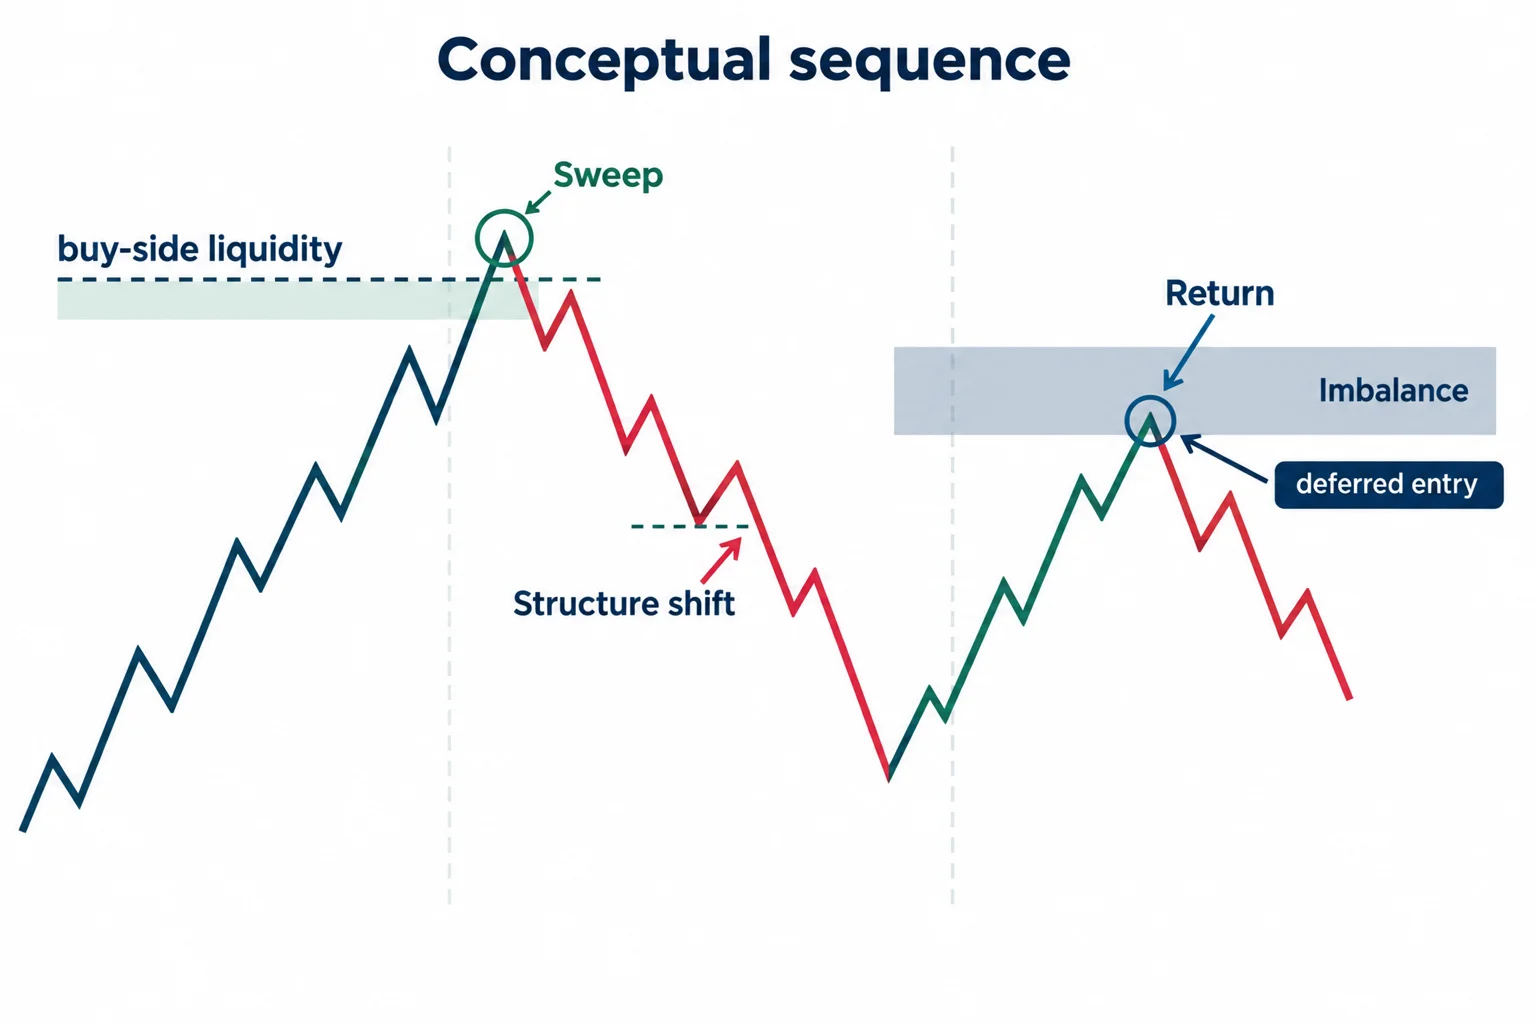
At 1:56 he summarises the situation as “essentially … a turtle soup” and calls it a deferred entry. In his description the relevant behaviour is that buy-side liquidity above the market has already been run: at 1:22 he says he is annotating a buy-stop liquidity raid and at 1:28 that the liquidity has been purged, so the market “should explore lower”, including back into yesterday’s regular trading hours. Rather than entering while price is still above, he waits for the return into the defined imbalance before establishing or adding to the short.[1]
At 2:29 he frames this as a classic pre-opening sequence: liquidity has already been taken before the 9:30 a.m. Eastern opening bell, followed by what he describes as a shift in market structure. He also notes at 4:27 that the run higher which took out the buy side began around 7:00 a.m., which he calls classic premarket session activity, and warns that the approach of the opening bell may bring whipsaw.
The one price he speaks, and how to treat it
At 2:49 he refers to a break below a low the automatic transcript renders as “around 21,698”, saying that breaking it should start to accelerate things. That number comes from automated recognition of speech, not from reading the chart, and the chart itself is not available here, so it is reported as spoken rather than as an exact level. The same caution applies to the transcript’s colour words for the highlighted rectangles, which vary between passages; no conclusion in this recap rests on which box was pink, red or orange.[1]
What he watches after entry
He does not expect an uninterrupted decline. At 4:52 he says he does not feel the stop is in jeopardy, adds that it could be hit, and says that if it is hit he will look to reshort. His central confirmation criterion, described from 5:26, is price’s apparent unwillingness to work back into the premium half of the arrays he has drawn: he wants price to stay in the lower half of the imbalance and in the lower half of an inversion fair value gap. He repeats that lower-half behaviour is “very, very critical” at 9:36, and at 6:06 he points to a sharp rejection as behaviour consistent with his read, while still allowing that price could reach his stop.
- Liquidity event: buy-side liquidity taken before the opening bell.
- Entry framework: price returns into a two-minute imbalance for a limit sell, with adds around the midpoint.
- Held confirmation: price remains in the lower half of the imbalance and the inversion fair value gap.
- Target: sell-side liquidity resting on relative equal lows.
- Invalidation and risk: stop initially above the referenced array, described by him as risk defined at that high.
Why the two-minute chart was used
At 8:22 he addresses the timeframe choice directly. He says there is no secret to the two-minute chart on that day: the imbalance he highlights can be drawn as one two-minute candle, whereas the one-minute chart breaks the same range into several fair value gaps. He refers to having taught this distinction in what he calls the 2024 video lineup on his channel; that reference is his own, and the earlier material is not reviewed here. From 9:02 he sets out the split he works with: bias and the anticipated draw on liquidity come first, and timing is then taken from whichever of the five-, four-, three-, two- or one-minute charts shows the cleanest inefficiency. That is his stated discretionary selection process, not a rule the transcript tests.
Position and risk management as described
During the recording he reports building the position from one contract. At 11:25 he says that is about where the fourth contract filled, noting the midpoint of the array again. By 11:45 he says he will sit pat with what he has, will not add further, and will not do partials, describing the plan as a full move to sell-side liquidity if he can get it. From 12:52 he reviews the risk and reduces the stop, saying the revised stop will stay with the trade for its life, and at 13:10 he remarks that if he is stopped out at that level it would at least cover commission costs. The transcript contains no ticket, position size in dollars, account type or equity figure, so the monetary risk is not established here.[1]
He also flags a limitation of the recording itself: from 13:23 he says that if price punches through the low it may move beyond where his limit order is marked, so a displayed execution label might not reflect his actual fill. That is his own caveat and it is worth carrying forward: the marked target in a narrated session is not the same thing as a recorded fill.
Claims that need caution
This recap can describe what was said; it cannot independently confirm that any order was placed, that any account was funded, or how the sequence ended. The closing seconds of the transcript are ambiguous, and no exit price, payout or completed result can be established from the text alone. Statements about the setup working as intended, or about a reduced stop covering costs, are the speaker’s own characterisations made inside the recording.[1] The phrase “live execution” in the upload title should likewise not be read as independent evidence of live-money trading; the upload’s own description area carries a risk-disclaimer block that opens with a reference to CFTC Rule 4.41 and states that the performance shown is hypothetical, which is exactly why a recording’s labels deserve careful reading.[1]
Any general educational takeaway should be kept separate from the reported session: reading a liquidity sweep, a return into an imbalance, and a failure to reclaim the premium half of that area is a descriptive narrative, and none of it establishes that the same sequence will produce comparable outcomes.[2] Rules of thumb about simulated or hypothetical performance exist for this reason: 17 CFR 4.41 provides that no person may present the performance of any simulated or hypothetical commodity interest account unless the performance is accompanied by a prescribed statement, and that where such a presentation is not oral the statement must be prominently disclosed and in immediate proximity to the performance presented.[3]
Verifying these claims against the source
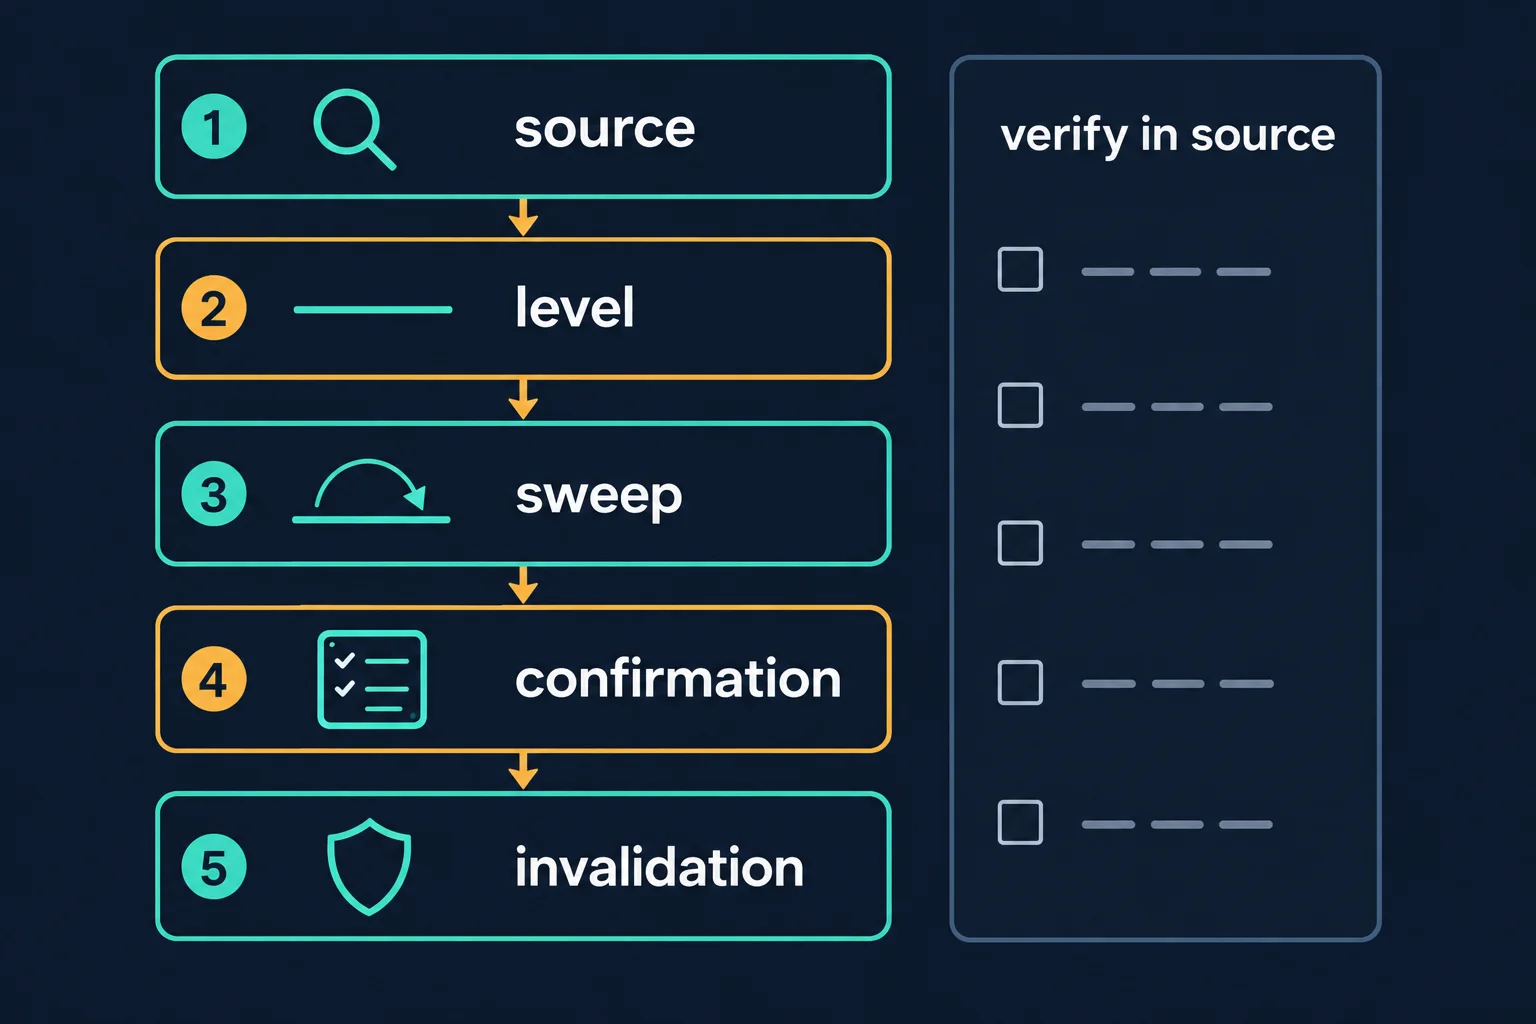
Every timestamp above links back into the recording, and that is the only way to check the recap: open the video at the stated time and compare the spoken words and the chart with what is written here.[1] Where the recap quotes a term, such as the imbalance abbreviation, the automated transcript’s own spellings vary between passages, so the term is normalised only where the surrounding context supports it; the raw wording remains in the source. The instrument itself is worth pinning down: “NQ” commonly refers to E-mini Nasdaq-100 futures, and the index provider’s own overview states that the Nasdaq-100 Index includes 100 of the largest domestic and international non-financial companies listed on The Nasdaq Stock Market based on market capitalisation.[4] An index description is not a contract specification, so it establishes no contract month, tick size or session hours, and nothing in the recording is claimed here to fix those details.
On timing, the article quotes Eastern-time references the speaker uses, including the 9:30 a.m. opening bell and a 7:00 a.m. premarket move. Anyone comparing those to on-screen clocks should account for timezone handling: the IANA Time Zone Database is updated periodically to reflect changes made by political bodies to time zone boundaries, UTC offsets and daylight-saving rules.[5] The upload is dated January 21, 2025 and the speaker refers to the prior day’s regular trading hours, but the transcript alone does not independently prove the calendar date of the session being narrated.
One further caution about this page’s own source: the transcript behind it was produced by automatic speech recognition of the full original audio rather than by human-verified captions, so specialised terms and numbers should be checked against the recording, and no chart detail is asserted here that the audio does not support. Two third-party write-ups are left in place as background reading only — a charting vendor’s Turtle Soup explainer and a replay tool’s strategy page. Neither is a first-party source for this recording, neither was used to establish a definition, level or result above, and both are unofficial and untested. No backtest, win rate, drawdown or account result is claimed anywhere on this page.
Watch the original recording
The Inner Circle Trader — January 21, 2025 – Live Execution \ NQ PreMarket Turtle Soup Short
The video cannot be played inside another website: when its embedded player was opened and clicked on 14 September 2026, the player itself reported “Playback on other websites has been disabled by the video owner.” and settled on a “Watch on YouTube” prompt, reporting no duration and no playback progress, and the watch page’s own embed flag reads playableInEmbed: false. That message is the reason this page carries a visible watch link instead of an embed.
Watch January 21, 2025 – Live Execution \ NQ PreMarket Turtle Soup Short on YouTube ↗
The watch page, re-read on 14 September 2026, attributes the upload to The Inner Circle Trader, dates it 2025-01-21T07:55:55-08:00, shows a displayed runtime of 14:08, and reported a view count of 99,823; the transcript used here covers 14:08 of audio, which is consistent with that runtime.
Sources and further study
- [1] The Inner Circle Trader — “January 21, 2025 – Live Execution \ NQ PreMarket Turtle Soup Short” (primary recording; watch page and audio transcribed 14 September 2026)
- [2] CFTC — Learn & Protect
- [3] eCFR — 17 CFR 4.41, Advertising by commodity pool operators, commodity trading advisors, and the principals thereof
- [4] Nasdaq Global Indexes — Nasdaq-100 Index overview
- [5] IANA — Time Zone Database
Background reading, unofficial and untested: Flux Charts — ICT Turtle Soup strategy explained; FX Replay — ICT Turtle Soup strategy.
Futures trading involves substantial risk and is not suitable for everyone. This recap is educational, reports no outcome from any account, and states no price, level, forecast or backtest result.

