
How we researched this article
BestProps used document-based research from primary firm sources, checked September 24, 2026. The complete source list, scope, limitations, and commercial-state record appear near the end of this article.
In Focus On Forex DXY EurUsd GbpUsd 09/25/2025, published on Thursday 25 September 2025 at 3:32 p.m. Pacific time and running 11 minutes 17 seconds, ICT reviews the dollar index, EUR/USD and GBP/USD on daily and five-minute charts. He opens with the date and the instrument list and treats the session as the day’s forex wrap-up (0:00).
He also opens by revisiting a call: he says he was bullish on the dollar the previous week unless price traded below the daily consequent encroachment of an inversion fair value gap that he describes as having been identified before it formed, and he frames the subsequent rally as one more demonstration of authorship (0:16). That framing is his own claim about his prior posts; the recording does not contain those posts, and no entry, stop, size or result is stated for any market in the lesson.
Source note: this page is grounded in the timestamped transcript of the recording linked below — automated speech recognition of its full audio (local Whisper large-v3-turbo), not YouTube captions. The recording is a screen-share chart review and no chart imagery was available to the reviewer, so timestamp links point to what the speaker says rather than to independently verified levels or candle boundaries.
Dollar index: premium wicks, quadrants and a Judas swing
ICT starts with the daily chart and two candlestick wicks. He explains that the candle with the longest wick is the premium wick he is working from and that he draws gradient levels across it from the candle’s open to its high (0:49). He adds a practical note about the tool itself: whether the retracement is drawn from low to high or from high to low does not matter for this exercise, because what he is using is the location of the quadrant levels relative to current price, not the specific ratio values (1:12).
On the five-minute chart he says price consolidated into midnight and traded down to 97.786, the low of that premium wick (1:48). He describes the session opening with a dip that he labels a Judas swing and then finding support at that same level (2:02), a London open he calls uneventful, and a New York open with far more movement (2:13). After a breakaway gap he marks a fair value gap sitting on the lower quadrant of that premium wick, plus a second, smaller gap that he says can be used to pyramid (2:28).
The sequence continues with a retracement-lower fair value gap, a volume imbalance that he warns is tight to see, a bullish fair value gap whose bodies are respected, a measuring gap that stays open, and a bullish breaker built from a swing low and a lower low (2:51). Price then rallies through the bullish fair value gap into the lower quadrant of 98.456, which he identifies as the lower quadrant of a further premium wick (3:27).
He explains why he included so much of that price action: the advance kept going past the window he normally treats as the end of the New York session. He defines his London close window as starting around 10 a.m. Eastern and extending to as late as 1 p.m. Eastern, and says that is the latest part of the day he would be concerned about; on this session price ran further than that because of the size of the move (3:48).
He then applies the same treatment to a second premium wick, saying its levels become more relevant around 98.245, where he says the buys respected the level and price drew back into it (4:35). He marks relative equal highs and notes that the one on the right sits lower, which he treats as the qualification that matters, then puts buy-side liquidity at 98.733 and calls it striking distance for the index (5:04). All of this is his reading of the chart as the session unfolded, not a verified forecast or a documented trade.
EUR/USD: when a bullish gap changes state
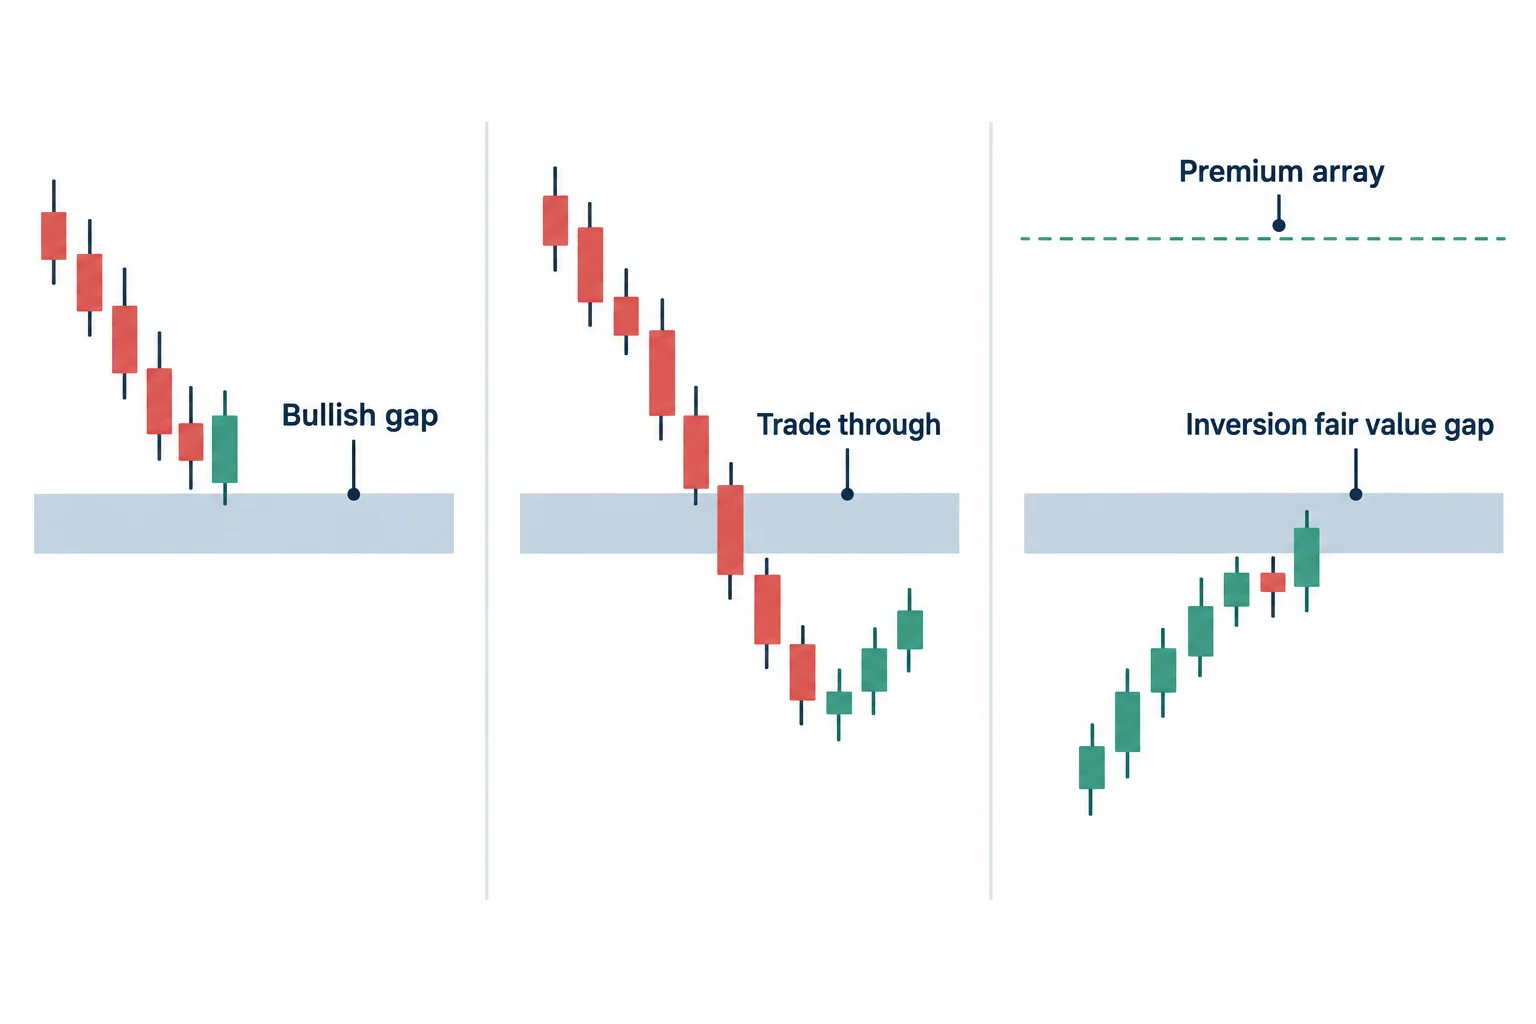
The EUR/USD section opens at 5:19 with his comment that the pair had fallen out of bed. He recaps the state change he had discussed earlier in the week: a gap that is a bullish fair value gap keeps that function while price trades down into it, but if price trades down through it — as he says happened on the previous day — it becomes an inversion fair value gap and acts as a premium array instead (5:34). He notes that he deliberately left the colour unchanged so that the two objects are not confused on the chart.
He then walks the session: a run up into a kill zone, an earlier session that he calls lethargic compared with the dollar index, a New York session that came alive, a breakaway gap, a bearish fair value gap, a Judas swing during New York, a break lower, and an order block where he says the bears changed the state of delivery at that candle’s opening price (6:03). Price then dropped into the discount wick of that candle, which he puts at 1.16945 (6:34).
The description continues with a measuring gap and a bearish breaker built from a swing high, a low and a higher high (6:41). He says price traded up into the breaker several times with wicks doing the damage while the bodies did not accept above it, broke lower, left a gap he considers too small to annotate, and then hit an inversion fair value gap before continuing lower into the London close and trading below the low of that discount wick (7:02). Near the end of the section he points to a further discount wick that he says may need attention and tells viewers to keep both references on their charts rather than only the longest wick (7:20).
GBP/USD: a reclaimed gap and a precise midpoint
Cable is reviewed from 7:39. He starts from a bearish fair value gap that he says was reclaimed and delivered from the previous day, then a discount wick, then a gap price traded down to, with gradient levels placed across the bullish fair value gap there (8:00). For Thursday’s range he identifies the upper quadrant at 1.34650, which he also describes as the lower quadrant of that discount wick, and says the bodies respected the fair value gap there before price broke lower after one more return into it (8:16).
He then describes a breakaway gap and a return into a fair value gap that he calls an institutional order-flow entry drill, and notes that this level landed directly on the consequent encroachment of the discount wick before price broke aggressively (8:43). A measuring gap he reads as roughly halfway to the objective, the bullish fair value gap lower down, follows (8:52).
The most concrete sequence in the video comes next. He says price traded into a bearish fair value gap — the transcript renders his term for it as “SIVI”, and he immediately glosses it as a bearish fair value gap, so the acronym should be checked against the recording — and that the level was hit with a wick only, not with candle bodies (9:05). He then points to a series of small, tightly spaced gaps where the bodies respect the level while wicks trade outside it, and says price dug into a blue bullish fair value gap, respected it, sold off, and stopped about a tick short of a prior low (9:12). The one-tick claim is his description of the chart; the transcript cannot measure it, and no trade is reported around it.
His stated lesson, and its limits
He summarises the point as learning to read gaps that show up as a wick above or below a candle rather than as a clean void between bodies (9:40). From there the closing section shifts into claims that should be separated from the chart description. He names a candlestick author — the transcript renders the name as “Steve Nielsen”, most plausibly Steve Nison — says he does not follow that material, with respect, and argues that his own reading of wicks and gaps is the part that reflects real order flow (9:51). He then says the number of contracts resting above or below the market has zero bearing on where price goes, and that what matters is knowing where the market is likely to reach for, followed by identifying key levels (10:06). Finally he says the material he has presented over the past two weeks is insight into price action that nobody else has described, and that it overlaps with his price-delivery arrays so that the arrays stand out (10:27).
Those are opinions about method and about order flow. Nothing in the recording tests them: there is no dataset, no backtest, no stated win rate, and no trade with an entry, stop, size or result. The levels quoted above are spoken over a chart the reviewer could not see, the transcript is automated speech recognition, and its numeric renderings should be checked against the video before being reused.
What to capture when studying a session like this
The recording is a chart-reading exercise rather than a plan, so the useful output of watching it is a session note that can be checked later. Keeping the same fields for each review is what makes two dated sessions comparable, and it also prevents a later chart from being read back into the original commentary.
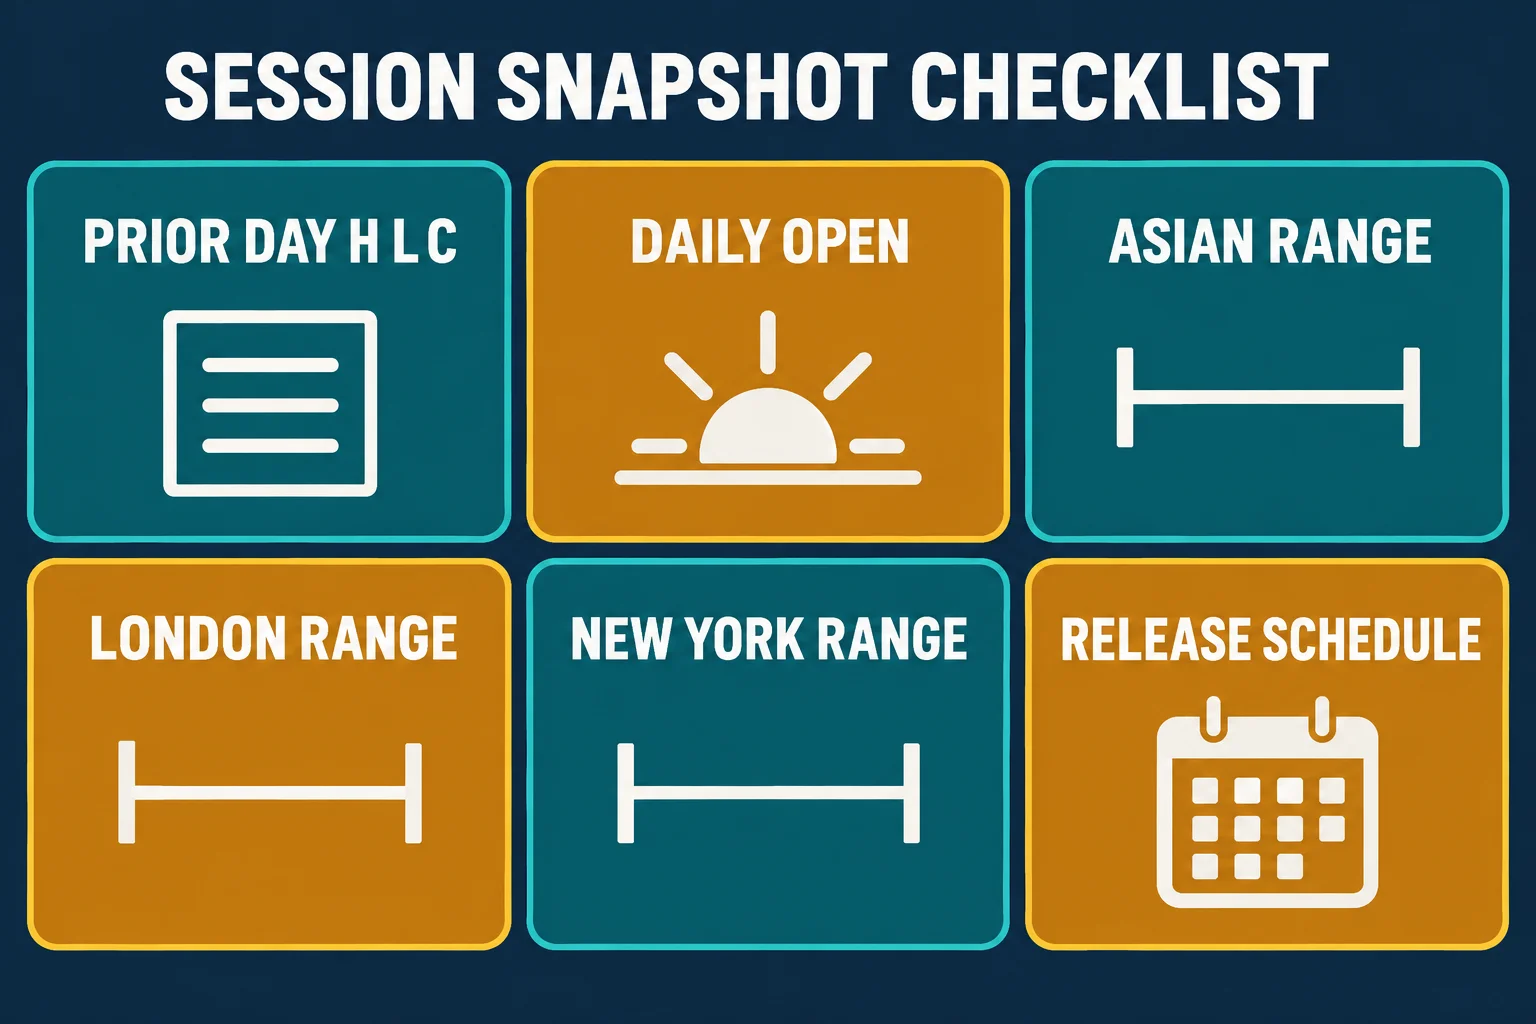
- Prior day and daily open. ICT’s reading depends on levels carried forward from earlier candles, so the references have to be dated, not just described.
- Session ranges. He separates an uneventful London open from an active New York session in both the dollar index and EUR/USD discussions, and defines an extended London close window of roughly 10 a.m. to 1 p.m. Eastern.
- Instrument and timeframe. The same numbers appear on daily and five-minute charts; without the timeframe and the candle they belong to, a quoted level is not reproducible.
- Conditional wording. Much of the commentary is conditional — bullish on the dollar unless a level traded, a gap being bullish until price traded through it — so notes that convert these into fixed calls change what was said.
- Releases. This particular recording does not discuss scheduled economic releases, even though his session reading is time-based; the release calendar belongs in the same note for any session where it is mentioned.
Watch the original lesson
This article draws on the automatically transcribed English audio of Focus On Forex DXY EurUsd GbpUsd 09/25/2025 (677 seconds, 11:17). The transcript is a source for the speaker’s words, not independent proof of the chart work, the levels or any result.
Watch the original lesson on YouTube
The video cannot be played inside another website: when its embedded player was opened and clicked on 14 September 2026, the player itself reported “Playback on other websites has been disabled by the video owner.” and settled on a “Watch on YouTube” prompt, with no duration and no playback progress reported. That message is the reason no embed is left blank here; the recording itself is available directly on YouTube.
Watch Focus On Forex DXY EurUsd GbpUsd 09/25/2025 on YouTube ↗
Primary source and further reading
- Focus On Forex DXY EurUsd GbpUsd 09/25/2025: the primary source, on the channel The Inner Circle Trader. Its watch page was read on 14 September 2026 and reported a publish and upload time of 2025-09-25T15:32:05-07:00, a runtime of 677 seconds, a view count of 38,894, public non-unlisted availability, no live archive, and the Education category. The timestamp links above jump to the passages they summarise.
- ICE: US Dollar Index Futures (product page read 14 September 2026): the index operator describes the USDX futures contract as a benchmark for the international value of the US dollar and publishes its trading hours by venue. It is cited only for what the instrument he calls the dollar index is — an indexed dollar basket with a listed futures contract — and not for any level discussed in the recording.
- NinjaTrader Support: Trading Hours Templates — Desktop (article updated 14 August 2026; read 14 September 2026): the charting documentation states that trading hours templates “dictate the session start and end times for an instrument displayed on a Chart” and that a template’s time zone, session start and end times and holiday hours are editable. It is cited for why the London close or New York session window in this recording is a chart setting rather than a shared fact.
Method note: captions were not available for this upload, so this article was written from the automatically transcribed English audio of the full recording (local speech-to-text, Whisper large-v3-turbo). That transcript renders several specialist terms inconsistently — it writes “consequent encouragement” for consequent encroachment, “SIVI” for what the speaker glosses as a bearish fair value gap, “PDA race” for price-delivery arrays, and a candlestick author’s name as “Steve Nielsen” — and the numeric levels quoted above were neither visible to the reviewer nor checkable from the text alone. The article also omits one domestic interruption in the recording, where the speaker pauses to change a household alarm battery, because it carries no market content.
This is independent educational commentary on one dated forex review. It is not official ICT material, not a transcript, not a tested trading system, not investment advice, and not evidence that the approach described produces the results the speaker reports. BestProps is not affiliated with The Inner Circle Trader, YouTube, ICE or NinjaTrader Group, and no source listed here endorses this article or any setup. Terms such as liquidity, fair value gap, inversion fair value gap, breaker, order block, premium and discount wick, consequent encroachment and change in state of delivery are used on this page only as descriptive study terms from the general ICT vocabulary; none is presented as official, tested or free of repainting, and nothing here has been replayed, backtested or measured.

