
Key takeaways
This is a short, narrated trade example rather than a taught model.
Read the full summary
This is a short, narrated trade example rather than a taught model. The speaker says he is short on the basis of the lower half of a sell-side imbalance at a “9:30 candle” plus a fair value gap, with price having broken into a new week opening gap; he targets an earlier low, takes a partial at the 10 a.m. low area, and keeps lowering his stop from the gap’s high to its consequent encroachment to below the gap’s low as the move develops. Volatility stops the position out, he re-shorts after price returns to the new week opening gap and breaks its low, takes further partials, then leaves the charts. On returning he judges that a possible inversion fair value gap could threaten the remaining position, tightens the stop again, and reports that the stop is subsequently hit. The value of the clip is that it shows a loss, a re-entry and repeated partial exits rather than a clean winner — and it shows the transcript cannot confirm any fill, size or result.
How we researched this article
BestProps used document-based research from primary firm sources, checked September 24, 2026. The complete source list, scope, limitations, and commercial-state record appear near the end of this article.
2025 Lecture Series — SMC Trade Example 01/14/2025 is a public first-party upload on the YouTube channel The Inner Circle Trader. The watch page reports 143,415 views, a publish and upload time of 2025-01-14T20:04:00-08:00 (04:04 UTC on 15 January) and a runtime of 489 seconds, or 8 minutes 9 seconds. The title names 14 January 2025; the recording itself never states a calendar date, so the date is the upload’s, not something spoken. This article is transcript-based educational commentary on the recording, not an ICT publication and not a record of verified results.
What the example is and what it is not
The recording opens with the speaker calling it “an example of the model I’m employing this year” (0:11). It is an account of one sequence in real time, not a rule set: he describes what he is doing to a chart that is never shown in the transcript, and the instrument, the contract and the timeframe are never named. The only session references are clock times such as the 9:30 candle, the 10 a.m. low and a later “macro” period.
That matters because of how easily a clip like this is read as instruction. The transcript contains no chart image, no price scale and no statement, so everything below is the speaker’s narration of his own reasoning and orders, reported here as such.
The opening short and its reference points
He says price has dropped below the “9:30 fair value gap” and that he is executing on the basis of the lower half of that sell-side imbalance at the 9:30 candle together with what he calls the first presented fair value gap, which he then highlights (0:17). The automatic transcription renders the imbalance term inconsistently across the recording; the surrounding discussion is consistent with the sell-side imbalance, buy-side inefficiency idea, and it is described in those words here rather than silently corrected.
His next reference is the new week opening gap, a weekly gap he says price has broken lower into and is now trading near the high of (0:40). For an initial objective he names an earlier session low that the transcript renders as the “830 low”, and says he will look to take a partial at the 10 a.m. low (0:50). Both of those labels are transcript renderings of speech, not values read from a chart, and neither is treated here as a verified price.
Stop management as the move develops
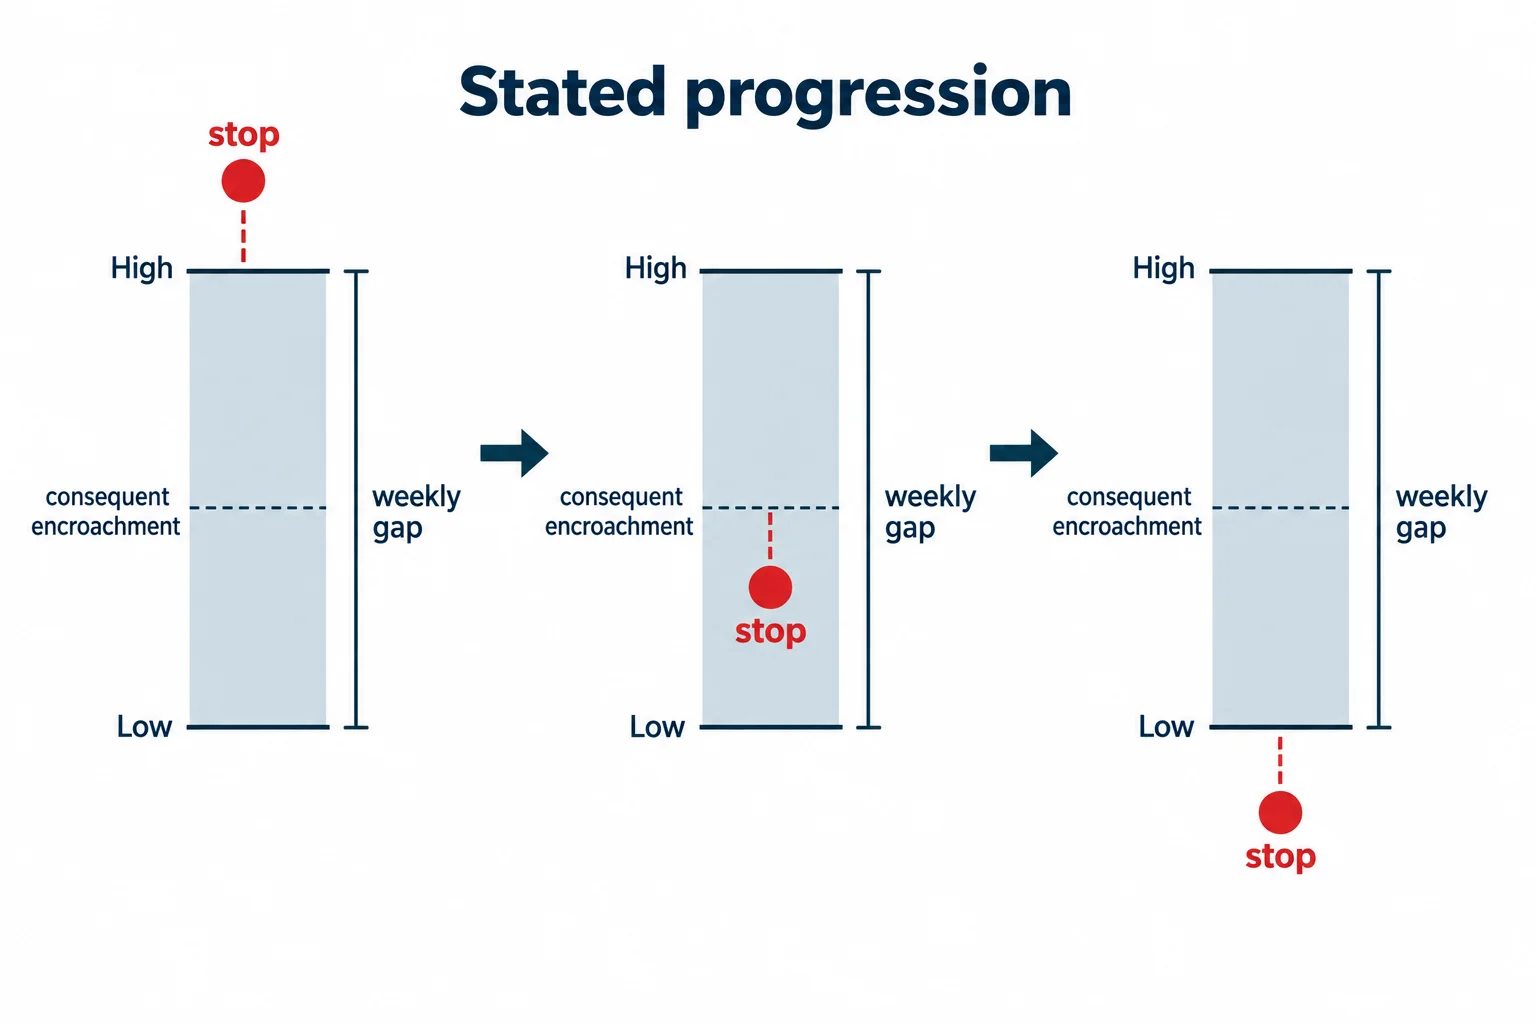
What the clip actually demonstrates is a stop walked in one direction. He describes placing a buy limit order below the 10 a.m. swing low and lowering his stop to the high of the same weekly gap plus one tick (1:12); then, once price uses the gap’s low and trades into the gap’s midpoint, which he calls consequent encroachment and treats as a permissible range, he lowers the stop below that midpoint (1:29 and 1:50). When the limit order fills he reports that one partial has been taken and moves the stop below the gap’s low (1:57).
This is a progression worth reading carefully, because it is a risk decision rather than a forecast: each stop move is tied to a level he has marked, and he repeatedly notes that a return to the gap’s low would be “permissible” without invalidating his read (4:10). Nothing in the recording tests how often that kind of flexibility helps rather than hurts.
The stop-out and the re-entry
He then reports that the volatility of the day stopped him out, and says he will look to enter again and re-short (2:21). The re-entry sequence is described in three parts: price returns to the new week opening gap and its midpoint level (2:39), it then breaks below the gap’s low (2:54), and candle bodies are described as respecting that low while he waits for a lower low (3:15).
He also states he expects the market to leave a portion of the gap open rather than trading through all of it (3:02). That is a claim about what the market will do, made in advance, and the recording never returns to score it.
Partials, targets and the “macro” period
He describes the session entering what the transcript renders as a macro period, expecting price to “spool” lower (3:31), and says he will take another partial once a lower low prints (3:44). His stated best case is a level the transcript renders as 20,640 with a limit order it renders as “below 37.50” (3:51). Both figures are renderings of speech by automatic transcription, not chart values this review could read, and the near-identical structure of the two numbers is a warning sign rather than a confirmation — they are reported as what he said, not used to derive any distance, tick count or dollar amount.
He ties the next leg to an entry drill around a partial fair value gap and expects expansion to hit his limit (4:31), then explains that he is allowing price to expand toward an old daily low marked on his daily chart, and is explicit that this is “the best case scenario” and “not necessarily what I demand” (5:00).
He reports taking another partial and lowering the stop again, and says he is now in a position where he does not care if he is stopped out but would prefer the move to continue (5:40). Size, fills and the money involved are never verifiable from the recording; partials are his description of his own order handling.
Leaving the screen, and the final stop
He then says he has to walk away from the charts and will only check periodically (5:48). Reviewing what happened while he was away, he says that if he had been watching he would have read a large imbalance as a potential inversion fair value gap that put his stop in jeopardy (6:18), that on returning he saw he could be stopped out through that inversion fair value gap, and that he therefore lowered the stop rather than risk more (6:40).
He describes the day as involving a lot of manipulation and as unusually wild (7:19), notes that his stop happened to sit above relative equal highs with no recent stop hunt (7:37), and then reports that the stop was triggered, with a phone alert bringing him back to the chart to close the presentation (7:53).
That ending is the most useful part of the clip for a reader evaluating the approach: a described setup that started with a stop-out, required re-entry, and finished with the remaining position stopped after several partials. Whether the overall sequence was profitable is not stated in the recording and cannot be established from it.
What this example does not establish
The recording demonstrates one narrated sequence. It does not state the instrument, the contract, the account, the position size relative to equity, or any net result, and it does not compare this sequence with the cases where the same reading would have failed. The claims that price would leave part of the weekly gap open, that the move would spool lower during the macro period, and that the day’s action reflected manipulation are the speaker’s interpretations of a chart this review never saw.
The two figures quoted above come from automatic transcription and should not be treated as the market’s actual levels. Nothing here is a rule to copy: stop placement, partial-exit policy and acceptable daily loss depend on the instrument, the account’s rules and the trader’s own tested process. Prop-firm limits must be checked with the firm directly.
Frequently asked questions
Was this example profitable?
The recording does not say. It documents a stop-out, a re-entry, several partial exits and a final stopped position; no statement, fill report or account figure is shown or described, so no net result is claimed here. The clip is useful precisely because a loss is visible in it.
What is a “new week opening gap”?
It is the weekly gap the speaker uses as his main reference in this example: price breaks into it, trades to its low and its midpoint, which he calls consequent encroachment, and he adjusts his stop relative to those boundaries (0:40). The definition is his; the recording does not formalise it or test it.
Why did he re-enter after being stopped out?
He describes wanting another short once price returned to the new week opening gap and then broke below its low while candle bodies respected that boundary (2:54). That is his stated condition, not a general rule, and it is the same condition that had already failed once.
Which market and timeframe is this?
Neither is named in the recording. The references to a 9:30 candle, a 10 a.m. low, a macro period and a daily chart are consistent with a US index futures session on an intraday chart, but no instrument, contract month or timeframe is asserted here because the source does not provide them.
Related source video: 2025 Lecture Series — SMC Trade Example 01/14/2025
The recording mapped to this article is 2025 Lecture Series — SMC Trade Example 01/14/2025, a public upload on the channel The Inner Circle Trader: 143,415 views, 2025-01-14T20:04:00-08:00, 489 seconds (8:09). Every timestamp link above points into that recording. The transcript used for this guide was produced by automatic speech recognition of the complete original audio rather than from YouTube captions, which is why the terminology and the two numeric renderings flagged above may be wrong.
Watch the original recording on YouTube
The owner has disabled playback of this video inside other websites, so it is shown as a watch card rather than an embedded player. The full 8-minute clip plays directly on YouTube.
Watch 2025 Lecture Series – SMC Trade Example 01/14/2025 on YouTube ↗
Reference sources and provenance
These references support specific points in the guide above. None of them is an ICT publication, none endorses or tests the approach, and none is offered as evidence for the example’s reasoning or its outcome.
How simulated results are described in regulation
A narrated example is not a performance record, and it is worth knowing how regulators describe that distinction. 17 CFR 4.41 sets out the statement advertising of simulated or hypothetical performance must carry, including the observation that simulated trading is designed with the benefit of hindsight and may have under- or over-compensated for market factors such as lack of liquidity.[1] That rule governs advertising and sales literature, so it is cited here only for its plain description of hindsight bias; this article is not advertising and makes no performance claim about the example.
Session clocks and the 9:30 reference
The example is anchored to clock labels rather than to prices. NYSE’s Holidays & Trading Hours page documents the Core Trading Session as 9:30 a.m. to 4:00 p.m. ET.[2] That is a cash equities timetable, not proof of the futures session the recording appears to reference, so it is included to show why the speaker’s “9:30 candle” and “10 a.m. low” labels only have meaning once an instrument and a timezone configuration are known — neither of which the recording states.
Why this page shows a watch card instead of a player
YouTube’s own documentation describes the uploader control behind the message this video returns: turning off embedding prevents a video from playing on external sites.[3] When the embedded player was opened and clicked from a bestprops.com page origin on 14 September 2026, it reported “Playback on other websites has been disabled by the video owner” with no duration and no progress, which is why a visible watch card is used and no iframe is present.
Source, method and limits
This article is grounded in the full timestamped transcript of the mapped upload. The transcript was produced by local automatic speech recognition of the complete original audio and is not human-reviewed captions; the recording’s charts were not examined by this review. Automatic transcription renders several of the speaker’s terms inconsistently — the imbalance shorthand, consequent encroachment and the two numeric levels quoted in the body — and each is described in the words the surrounding discussion supports rather than silently renamed. No fill, position size, spread or net result is asserted anywhere on this page, and the stop-out and re-entry are reported as the speaker narrated them.
Sources
- [1] eCFR: 17 CFR 4.41 — Advertising by commodity pool operators and commodity trading advisors
- [2] NYSE: Holidays & Trading Hours (Core Trading Session 9:30 a.m.–4:00 p.m. ET)
- [3] YouTube Help: Embed videos & playlists
- [4] Primary source: 2025 Lecture Series — SMC Trade Example 01/14/2025 (The Inner Circle Trader)
