
Key takeaways
The Inner Circle Trader’s public YouTube lesson explains ICT’s untested 2025 opening range gap framework using a one-minute chart set to New York time and regular trading hours, with the gap bounded by the prior day’s four fourteen p.m.
Read the full summary
The Inner Circle Trader’s public YouTube lesson explains ICT’s untested 2025 opening range gap framework using a one-minute chart set to New York time and regular trading hours, with the gap bounded by the prior day’s four fourteen p.m. Eastern settlement and the next day’s nine thirty a.m. open. An open above settlement creates a premium gap and is measured upward with Fibonacci, while an open below creates a discount gap and reverses the measurement. The range is divided into upper and lower quadrants, a midpoint called consequent encroachment, and both boundaries. Electronic-hours charts instead represent new day or new week opening gaps, with the six p.m. to nine thirty a.m. span treated as pre-market context. ICT calls gaps of 120 handles or more extreme, generally targets only the nearest quadrant and avoids expecting an immediate half or full fill. For 20 to 75 handles he favors a move to the midpoint, often after price first seeks pre-market, overnight, London, or relative equal highs. Gaps from 75 to 120 handles are discretionary, may be skipped during the first 30 minutes from nine thirty to ten a.m., and require market structure, economic-calendar, and seasonal context. The chart’s stated prior settlement is 21,049.75, but the instrument, contract month, and tick value are not identified. In the narrated examples, the 3 January 2025 premium gap reaches its upper quadrant without closing, while the 7 January session trades through its own gap and the earlier gap’s upper quadrant, midpoint, lower quadrant, and full closure. The video runs about 19 minutes 25 seconds, provides no verified win rate, backtest, account result, or independently tested probability, and includes hypothetical-performance and leveraged-trading risk disclaimers.
How we researched this article
BestProps used document-based research from primary firm sources, checked September 24, 2026. The complete source list, scope, limitations, and commercial-state record appear near the end of this article.
In 2025 Lecture Series – SMC Opening Range Gaps, ICT works through the rules he says he will apply in 2025 to the opening range gap. The lesson is a definitional one: it separates the opening range gap from the new day and new week opening gaps, fixes the two prices that define it, and then divides that range into levels he uses to describe where price might travel. The recurring point is that the whole construction depends on one chart setting being correct.
This guide summarises what the lecture states. The rules are ICT’s own market interpretations, not independently tested probabilities, and nothing here is a guarantee that a gap will behave in any particular way. The recording is a spoken explanation over a chart; the transcript used here was produced by automatic speech recognition, so occasional wording and numbers may be misheard, and no chart detail is asserted beyond what the narration states.
ICT Opening Range Gap Chart Settings
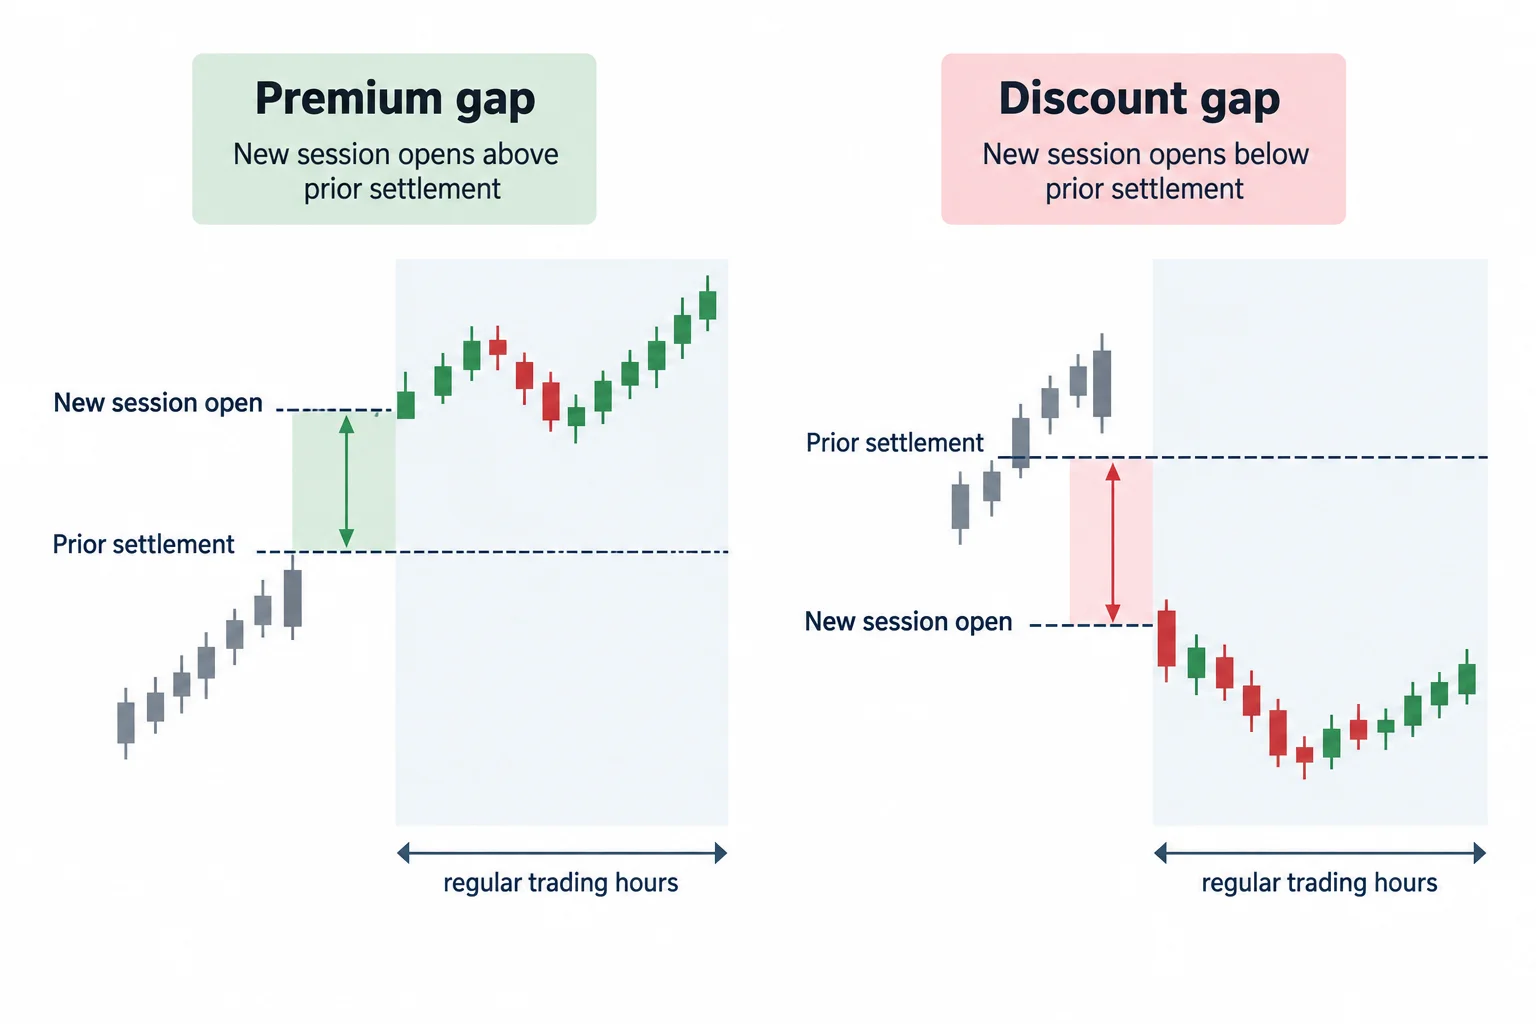
ICT opens by telling viewers to confirm the chart is set to regular trading hours rather than electronic trading hours, pointing to the RTH/ETH toggle in the lower right of the platform, and to set the time zone to New York (1:12, 1:38). The chart shown is a one-minute chart.
He then names the two prices that bound the gap:
- the previous trading day’s regular-trading-hours settlement price, which he marks on the 4:14 p.m. Eastern candle (2:20, 2:26); and
- the 9:30 a.m. Eastern opening price of the next trading day (2:36).
Classification follows directly from which of those two prices is higher. If the 9:30 a.m. regular-hours open is above the prior 4:14 p.m. settlement, he calls it a premium opening range gap; if the open is below that settlement, it is a discount opening range gap (3:09, 8:01). He notes the direction of that classification is what tells you which way to draw the Fibonacci tool, not what the gap is called in general market conversation.
The chart example carries a stated prior settlement of 21,049.75 read from the highlighted candle (1:53). The transcript does not name the instrument, contract month or tick value, so that number is best treated as a chart reading from the recording rather than a specification of what “handles” mean for any given market.
Why ICT Opening Range Gaps Exclude Electronic Hours
ICT stresses that the opening range gap as he defines it exists only on the regular-trading-hours view. On that view the space between 4:14 p.m. and the next 9:30 a.m. is empty, because regular hours are closed; he calls that a liquidity void in his own terminology, while acknowledging that transactions did occur in the same price interval during electronic hours (6:13, 15:53). He contrasts that with a fast one-sided candlestick move, where buying and selling did occur inside the candle’s own range, so the two should not be labelled the same way.
Switch the chart to electronic hours and the levels change meaning: he says the measurement you are then looking at belongs to the new day opening gap or the new week opening gap (7:03). He also refers to the electronic session beginning at 6 p.m. Eastern and to everything between then and 9:30 a.m. as the pre-market span, useful for context but not part of the regular-hours gap (6:33, 10:15).
How to Mark ICT Opening Range Gap Levels
Once the two endpoints are marked, ICT divides the range with the Fibonacci tool: for a premium gap he anchors at the prior 4:14 p.m. settlement and drags up to the next 9:30 a.m. open, and for a discount gap he reverses the direction (3:40, 9:43). The levels that result are the two boundaries, an upper and a lower quadrant, and the midpoint, which he calls consequent encroachment (5:59, 10:57). He names the upper quadrant as roughly the quarter of the gap nearest the opening price and the lower quadrant as the quarter nearest the prior settlement.
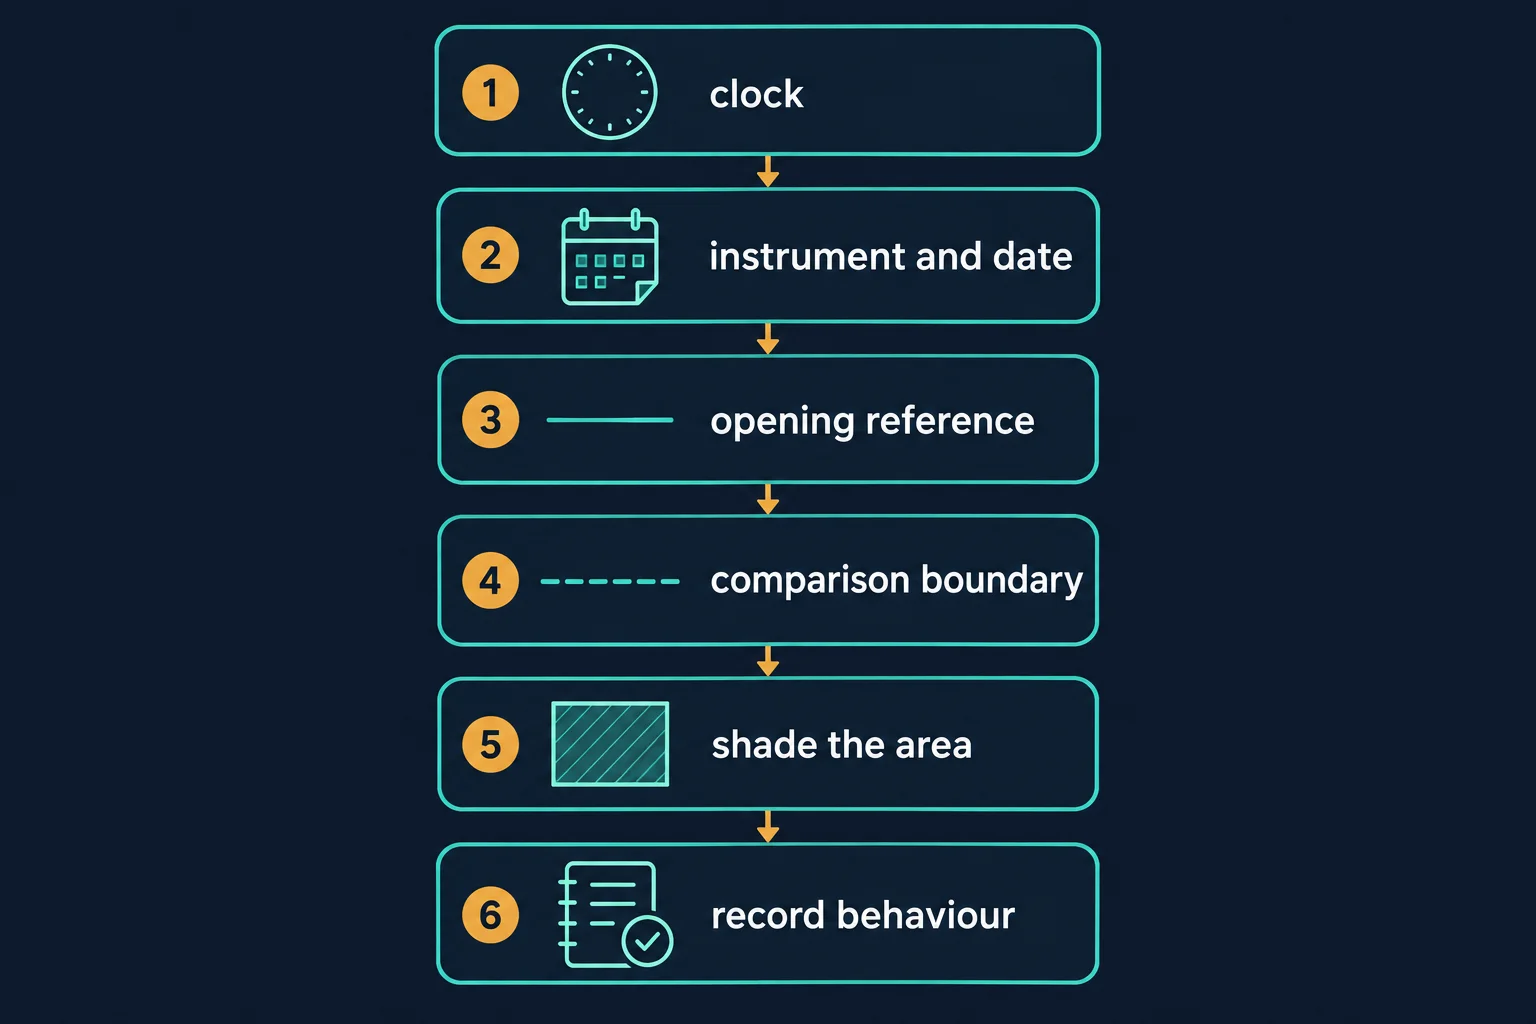
- Set the clock. Put the chart on New York time, since the lecture uses Eastern Time throughout (1:38).
- Choose the instrument and date. Keep the same market and contract when comparing sessions, because a roll or a different feed changes the prints.
- Mark the opening reference. Place a level on the 9:30 a.m. Eastern regular-hours open (2:36).
- Mark the comparison boundary. Place a level on the prior 4:14 p.m. Eastern settlement (2:20).
- Shade the area between them. Label it with the date and session so it is not confused with a new day or new week gap (7:03).
- Record subsequent behaviour. Note whether later sessions trade into the quadrant levels, the midpoint or the far boundary, without treating the observation as a rule.
That sequence is a study routine, not a lecture procedure that the recording states in those words.
ICT Opening Range Gap Sizes and Expectations
The lecture then attaches expectations to the size of the gap, measured in handles. Because the instrument and tick value are not stated in the recording, those thresholds should not be assumed to transfer unchanged to another market.
Opening Gaps of 120 Handles or More
ICT describes a gap this size as extreme and says he is cautious about expecting it to be filled immediately, noting it can remain open and be rebalanced later instead (3:20, 4:20). For a large premium gap he says his interest sits at the upper quadrant first, and that around a quarter of the gap (the upper quadrant) is usually what he expects to see traded (4:55). The discount case reverses the geometry. He repeats near the end that above 120 handles he is reluctant to expect an immediate refill to at least half the gap (18:40).
Opening Gaps From 20 to 75 Handles
In this band he says he likes the odds of price reaching the midpoint of the gap. His described sequence for a premium gap is an initial run toward buy-side liquidity already sitting above (a pre-market high, an overnight or London high, or relative equal highs formed between 6 a.m. and the 9:30 open, followed by a move back down to minimum consequent encroachment, the midpoint of the gap (10:00, 10:51). Whether he then looks for full closure depends, he says, on whether he is leaning bullish or bearish and where price sits in the wider range.
Opening Gaps From 75 to 120 Handles
He calls this a sweet spot where price can go either way, and says he errs toward what other analysis elements show him (12:51). In that situation he may sit on his hands and pass on the opening range altogether, which he defines as the first 30 minutes from 9:30 to 10:00 a.m. Eastern, leaning instead on market structure, the economic calendar and seasonal tendencies (13:05, 13:26). The transcript describes the middle band with slightly varying boundaries, including a reference to around 100 handles, so these figures read as general guidelines rather than fixed cut-offs.
ICT 2025 Opening Range Gap Chart Examples
The walkthrough that follows uses sessions from the first week of January 2025. ICT narrates a premium gap from 3 January 2025 that trades up first and then returns to the upper quadrant in the 3 p.m. hour without closing the gap (11:36, 15:14). He then follows the next session, which he identifies as 9:30 a.m. on Tuesday 7 January 2025, and describes price breaking lower, trading back into that day’s opening range gap, and then working down through the previous day’s upper quadrant, consequent encroachment, the lower quadrant and finally a complete closure of the earlier premium gap (14:35, 14:53).
Those descriptions are ICT’s account of what he is pointing at on his own chart. The transcript supports the sequence he narrates, but it cannot verify candle coordinates, the instrument, any order, fill or result, or whether the levels were drawn before or after the move. The upload itself carries a risk-disclaimer block opening with a reference to CFTC Rule 4.41 and stating that displayed trading performance is hypothetical.
He also flags a limitation of the approach himself: in the 75-to-120 handle band the rules become discretionary, and with very large gaps he wants more information than the gap measurement alone (18:24). On relative equal lows visible in his example he notes that price levels that look too clean usually do not stay intact, and that the market tends to make those smooth edges jagged (17:55).
ICT 2025 Lecture Series on SMC Opening Range Gaps
The article is mapped to 2025 Lecture Series – SMC Opening Range Gaps, a public upload on the channel The Inner Circle Trader. Its watch page, read on 13 September 2026, attributes the upload to that channel, shows a player runtime displayed as 19:25 (the page’s metadata duration field reads PT19M26S), and records publication at 2025-01-09T19:30:36-08:00, an instant the same page renders as 2025-01-10 when expressed in UTC, which is why the upload date and the session dates discussed inside the recording belong to different calendar days.[1] The sessions he walks through, 3 January and 7 January 2025, precede the upload. Every claim in this guide is taken from that recording’s spoken narration.
Watch the original lesson on YouTube
The video cannot be played inside another website: when its embedded player was opened and clicked on 13 September 2026, the player itself reported “Playback on other websites has been disabled by the video owner.” and settled on a “Watch on YouTube” prompt, reporting no duration and no playback progress. The page’s own embed flag (playableInEmbed: false) agrees. That message is the reason no embed is placed here; the recording itself is available directly on YouTube.
Watch 2025 Lecture Series – SMC Opening Range Gaps on YouTube ↗
ICT Opening Range Gaps Sources and Further Reading
- The original Inner Circle Trader lesson Use the timestamp links above to check each statement in this guide against its source.
- NYSE (markets hours and calendars) The exchange operator’s own statement of United States equity trading hours, listed because this article refers to a 9:30 a.m. Eastern session open.[2]
- Investor.gov (U.S. Securities and Exchange Commission), Day Trading General risk framing for short-horizon discretionary trading, not a comment on this method.[3]
- Time.gov (official U.S.) time (NIST and U.S. Naval Observatory) The civil clock reference behind the time-zone caution above; it does not determine what a charting platform prints on a bar.[4]
Any ICT, SMC or third-party indicator, script, transcript, note set or social summary circulating outside the publishing channel’s own upload page is unofficial and untested here. No performance test, win rate, drawdown figure or account result is claimed anywhere in this article, and the rules described above are recorded as the lecturer’s stated framework rather than as verified edges.
Leveraged and futures trading involves substantial risk and is not suitable for everyone. This article is educational commentary, does not provide individualized financial advice, reports no outcome from any lecture or account, and states no price, level, forecast or backtest result.
[1] 2025 Lecture Series – SMC Opening Range Gaps, The Inner Circle Trader (watch page read 13 September 2026). [2] NYSE, markets hours and calendars. [3] Investor.gov (U.S. Securities and Exchange Commission), Day Trading. [4] Time.gov, official U.S. time (NIST and U.S. Naval Observatory).

