
Key takeaways
In a May 15, 2025 presession review, ICT walks through an overnight sell-off, a daily fair value gap he wanted treated as an inversion fair value gap, and a bullish intraday trade he says he entered near the midpoint of session-level arrays before closing manually ahead of scheduled US economic releases. Much of the lesson is about organization rather than entries: separate chart templates for each session and type of price-delivery array, and only the references that matter for the current setup.
How we researched this article
BestProps used document-based research from primary firm sources, checked September 24, 2026. The complete source list, scope, limitations, and commercial-state record appear near the end of this article.
This review is built from the transcript of the mapped recording, 2025 Lecture Series – NQ Review Presession Trade May 15, 2025, on the channel The Inner Circle Trader. The audio was transcribed automatically rather than by hand, so quotations are avoided and recognition-sensitive phrases are flagged at the end. Everything attributed to ICT below is his own narration from the recording, with the timestamp it comes from. Chart visuals were not inspected, so no price, level, coordinate, fill or net result is asserted anywhere on this page.
Higher-time-frame context and the overnight move
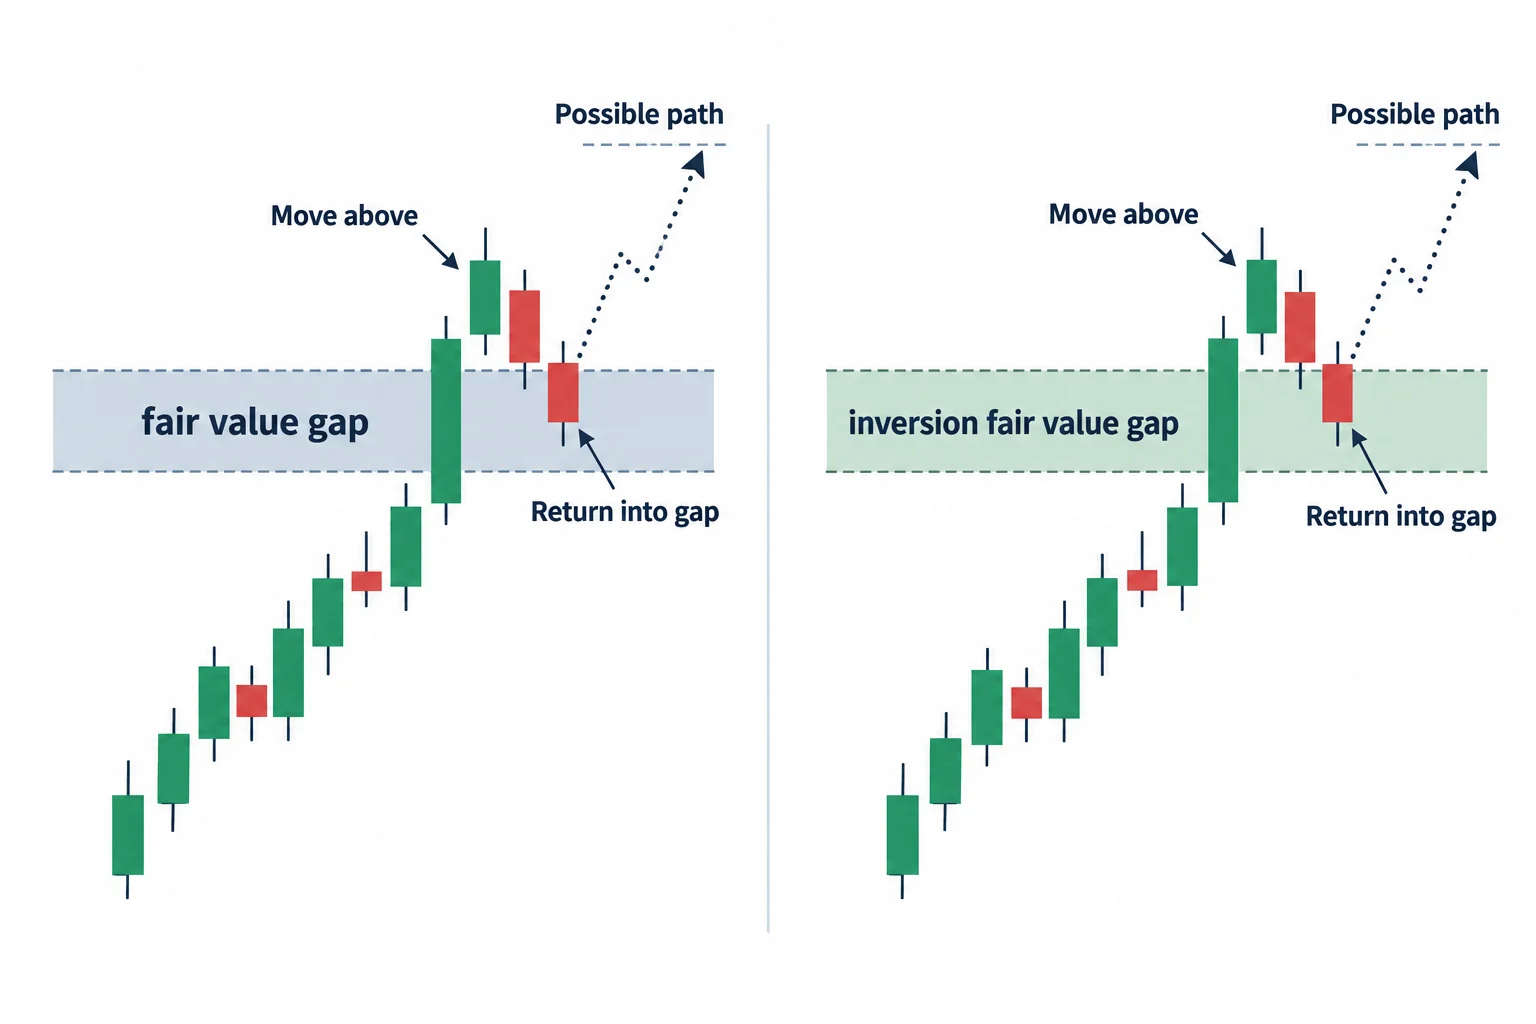
ICT opens with relative equal lows and says price had swept beneath them on Wednesday, after which he describes a short he took. See the discussion beginning at 0:09. He reports a sell-off overnight and says a Tuesday afternoon-session fair value gap was used as a London-session short reference at 0:37 and 0:44.
He then moves out to the daily chart and reiterates that his broader expectation had been bullish. In ICT’s interpretation price was approaching a daily price-delivery array, and he wanted to see it trade above the fair value gap and come back down into it so that the level could be treated as an inversion fair value gap, with a higher inefficiency as a further objective. That context is set out from 1:04. The qualification matters: he says plainly that he could be wrong and that the run higher may not happen, while noting buy-side stops above as a possible scenario if a rally develops at 3:32.
He also lists the day’s scheduled event risk as he understood it, naming unemployment claims in the morning, PPI figures, and remarks from Federal Reserve Chair Jerome Powell at 8:40. Those items are reported here as ICT states them at 0:23 and 0:27; they were not checked against an official economic calendar, and any reader should use a current calendar rather than this summary.
Why ICT limits how much is displayed on the chart
A large part of the lesson is about chart organization rather than entry mechanics. Starting at 4:00, ICT recommends saving separate templates or workspaces for selected sessions and types of price-delivery array, so that toggling one reference set on and off shows only the levels relevant to that context. His examples from 4:37 include afternoon-session fair value gaps with only the most recent few displayed, the New York open, the regular opening range he describes as 9:30 to 10:00 Eastern time at 5:02, and the Asian and London sessions. He says he rotates through his own templates and keeps only the information he considers salient to the current market structure.
The stated purpose of that discipline is to avoid two failure modes he names directly: a chart too cluttered to navigate, and analysis paralysis from carrying every array he has ever described. In his framing at 6:02, the references worth keeping are the ones that could frame a move toward:
- An old high or old low that could act as a liquidity objective;
- An inefficiency price might revisit and redeliver from;
- A session-specific fair value gap;
- The midpoint, which ICT calls the consequent encroachment, of a selected range or imbalance.
That is an organizational method inside ICT’s own analytical vocabulary. It is not evidence that the marked levels predict price, and the recording does not present any test, sample or measurement of the approach. The transferable part is narrower and more defensible: group observations by session or setup, cut visual clutter, and decide in advance which information is relevant to the current hypothesis.
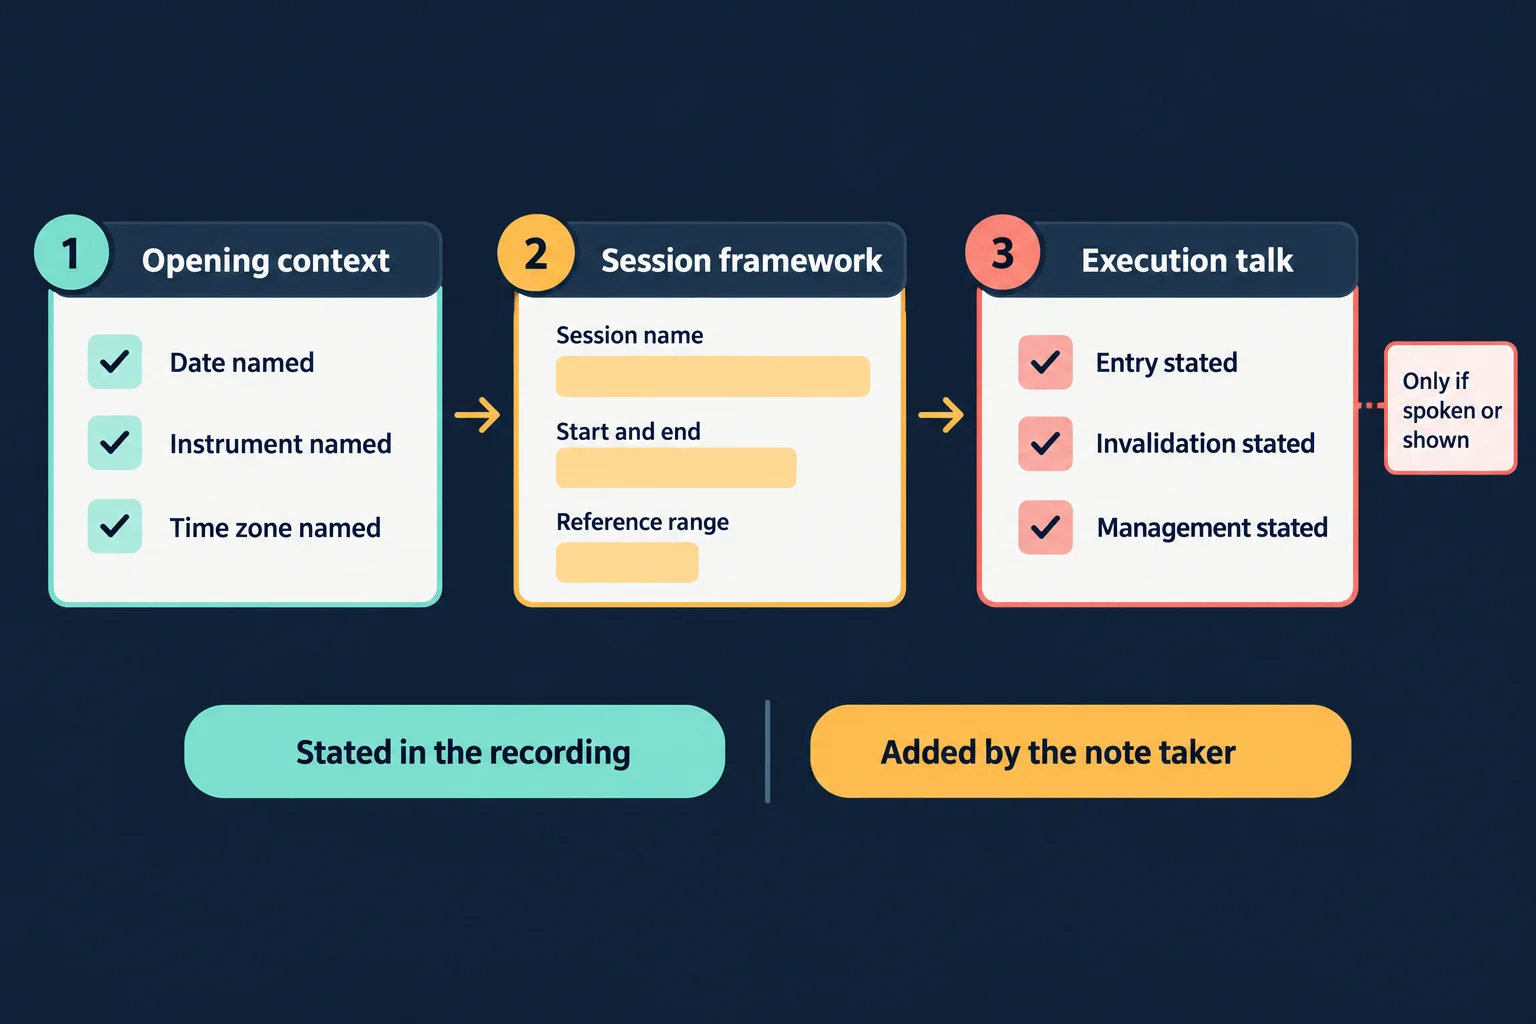
The same discipline can be applied to a reviewer’s own notes. The schematic below separates what a recording states from what an analyst adds, and keeps the fields general rather than filling them with values the transcript does not establish.
The trade he describes
From 6:20 ICT returns to the daily fair value gap and describes what price had done in his reading of the chart: above the midpoint of the daily gap, into a smaller Asian-session fair value gap, then back to the midpoint of the larger daily gap, which he was watching as a discount array at 7:05.
He says his entry was built on the expectation that price would regain a nearby level and take out a prior high, and that his stop was positioned with reference to the midpoint of what the transcript renders as a buy-side imbalance and sell-side inefficiency. His account of the entry, the stop reference and the addition begins at 7:49. He then reports price coming back above, tapping the level, rallying, and his adding to the position at 8:20, with the stop raised as price extended at 8:38. No entry, exit, stop price, position size or independently verifiable fill appears in the transcript, so this is a narrated walkthrough of a reported trade, not a reconstructable trade record.
Candle bodies and the bullish breaker
From 9:05 ICT compares candle bodies across two swing lows to support his classification of a bullish breaker. He notes that the later wick did not create the lower-low relationship he was looking at, and argues that the body behaviour across the two closes tells the more useful story about the swing. He places that breaker inside an older session gap he connects to February as well as the broader bullish context, and says the midpoint of that level is what he expected to send price higher. He says he added again there and then closed the position manually at 10:02.
The useful observation is how many separate inputs he layers before acting: higher-time-frame direction, a prior session imbalance, midpoint behaviour, candle-body structure and a nearby liquidity objective. These are ICT’s interpretations in his own terminology, and the recording offers no testing that the combination has a measurable edge.
The previous day’s executions and the review habit
ICT also walks back through the prior session, and this part is worth noting because it shows what he treats as a review rather than a result. He refers to business he had already walked through publicly on X, describing a low-hanging-fruit objective, profits taken below the relative equal lows, and the move into consolidation afterwards. See 2:38 through 3:10. He says there were no other trades overnight and that he slept in that morning during the London session.
He presents that passage as process commentary, not as a performance claim, and nothing on this page turns it into one. A single reviewed day cannot demonstrate expectancy, and the transcript contains no account-level figures, commissions, slippage or verification of any fill.
Closing before event-driven volatility
ICT says he closed the position manually even though he remained interested in the possibility of higher prices. His stated reason was the proximity of scheduled events and especially Powell’s remarks, which he expected could produce unusually sharp or hard-to-interpret price action. He also says the close finished his trading week. He discusses the decision from 10:02 and signs off at 10:32.
The general lesson is that a market hypothesis and an exposure decision are separate things: a trader can still favour a direction and still choose not to hold risk through a scheduled release. Prop-firm rules on news trading, overnight exposure, position limits and loss thresholds vary by firm and change over time, so any application of that idea belongs in the reader’s own rulebook and current account terms. This article is educational and is not investment advice.
Related source video: 2025 Lecture Series – NQ Review Presession Trade May 15, 2025
The recording mapped to this article is 2025 Lecture Series – NQ Review Presession Trade May 15, 2025, on the channel The Inner Circle Trader. Its watch page returned that exact title with a publish and upload time of 2025-05-15 and a runtime of 644 seconds, and the audio transcribed for this review runs 643.9 seconds, so the transcript covers the complete recording rather than a fragment of it. The official post for the lecture links to the same video identifier.
Watch the original lesson on YouTube
The video cannot be played inside another website: when its embedded player was opened from a BestProps page origin and clicked on 14 September 2026, the player itself reported “Playback on other websites has been disabled by the video owner.” That message is why this article shows a watch card instead of an embed, and the recording remains available directly on YouTube.
Watch 2025 Lecture Series – NQ Review Presession Trade May 15, 2025 on YouTube ↗
Review notes: what is verified and what is not
Source. The mapped recording is a public, first-party upload whose watch page returned the exact title, the 2025-05-15 publish and upload time and a 644-second runtime. The audio used for this review was downloaded in full and decoded at 643.9 seconds, matching that runtime, so the source is complete and correctly identified.
Transcript. The transcript is automatic speech recognition, not hand-made captions, and no visual chart verification was possible. Recognition is generally confident, but a few terms are uncertain. The phrase rendered repeatedly as “first percent of the fair value gap” is ambiguous and is deliberately not treated as a fixed term anywhere above. “Consequent encroachment” was normalised from a clearly corrupted rendering, and the stop reference is described using the wording the transcript produced. Any wording attributed to ICT should be read with that caveat.
Claims that stay open. The transcript does not establish exact chart prices, the contract month shown, the chart timezone, order fills, position size or the eventual outcome of the described trade, and none of those is asserted here. The scheduled releases ICT names are his own account of the day and were not verified against an official calendar. Nothing in this article verifies or recommends the method, and a reported trade is not evidence of profitability.
Sources
Four references support this article: the first-party recording it is grounded in, the two official posts used to confirm the lecture identity and distinguish the adjacent May 2 lecture, and one exchange product page used only for what it states about the contract commonly referred to as NQ.
- [1] The Inner Circle Trader – “2025 Lecture Series – NQ Review Presession Trade May 15, 2025” (first-party recording, the source for every claim in this article; watch page read 2026-09-14). Its page metadata reported title “2025 Lecture Series – NQ Review Presession Trade May 15, 2025”, publish and upload time 2025-05-15T05:07:13-07:00, a length of 644 seconds, public rather than unlisted or private, and playability status OK; the page displayed 51K views when read on 2026-09-13.
- [2] The Inner Circle Trader on X – official May 15, 2025 post for this lecture (shortened link resolves to the same video identifier VteCEU9i4Zc; post read 2026-09-13, link checked again 2026-09-14). The post text carries the lecture title and the shortened YouTube link, with the post’s own timestamp shown as 12:07 PM on May 15, 2025.
- [3] The Inner Circle Trader on X – official May 2, 2025 review post (read 2026-09-13, link checked again 2026-09-14). It carries different wording and a different shortened link, which is how the May 2 lecture is confirmed as a separate item that is not used to fill any gap in the May 15 recording.
- [4] CME Group – E-mini Nasdaq-100 product and trading-hours reference (official exchange page, read 2026-09-13; cited only for what it states about the contract unit and CME Globex hours, not for any market data it displayed). It is the only thing on this page that speaks to what the symbol NQ commonly refers to; the recording itself does not establish which contract month was charted.
BestProps is not affiliated with The Inner Circle Trader, CME Group or X Corp., and no source listed here endorses this article, this site or any setup. Presession, liquidity, fair value gap, inversion fair value gap, consequent encroachment and session framework are used on this page as descriptive study terms taken from the recording; none is presented as official, tested or free of repainting. No indicator, script, strategy or account was tested, replayed or measured for this review.
