
Key takeaways
In this October 3, 2024 review, ICT walks Nasdaq-100 futures from the weekly chart down to a 15-second view, keeping a conditional bearish bias while price held at or below a selected candle’s opening price.
Read the full summary
In this October 3, 2024 review, ICT walks Nasdaq-100 futures from the weekly chart down to a 15-second view, keeping a conditional bearish bias while price held at or below a selected candle’s opening price. He repeats his standing guidance for newer traders during non-farm-payroll week — trade Monday, avoid Wednesday through Friday — and uses the week’s consolidation as the illustration. He then works through a regular-hours opening range gap between Wednesday’s 4:14 p.m. Eastern settlement and Thursday’s 9:30 a.m. open, its midpoint, a sell-side imbalance and its consequent encroachment, and a gap he first expected to be revisited before reclassifying it as a breakaway gap. He closes with a narrated 15-second-chart short: six contracts reported short at 20,010.75, four more added, partial exits reported at 19,964.50, 19,925.00 and 19,882.25, and the two remaining contracts reported stopped at 19,941.50 — his own account of his orders, not a verified result.
How we researched this article
BestProps used document-based research from primary firm sources, checked September 24, 2026. The complete source list, scope, limitations, and commercial-state record appear near the end of this article.
In October 03, 2024 NQ Market Review, ICT reviews Nasdaq futures across weekly, daily, 15-minute, five-minute, one-minute and 15-second views. The central lesson is not only where price moved but that a consolidating session during a payroll week can argue for restraint, particularly for inexperienced traders.
The recording mixes a directional interpretation with a retrospective account of a short position. Both are the speaker’s own statements. The transcript is local automatic speech recognition of the audio, so wording and numbers may be misheard, and no chart detail, fill or result is verified here.
The higher-time-frame case and its invalidation condition
He starts from the weekly chart, referring back to top-down analysis he says he gave on Monday’s live stream: price had traded up into what he calls a premium sell-side imbalance and buy-side inefficiency, opening the week near the high end of a candle’s opening price (0:20, 0:28). On the daily chart he marks further inefficiency below and says price could trade below the nearby lows before reaching it (0:57, 1:00).
The bias comes with an explicit condition. He says that for him to turn bullish, price would have to trade above a particular candle’s opening price, and that at or below that level he remains bearish (2:00, 2:08). He does not name the candle on the recording, so the level itself is not recoverable from the audio — what transfers is the habit of naming what would invalidate the view.
On the following day’s non-farm payroll release he is dismissive of the data itself: he says it is already baked into price, while the number still moves sentiment and can unravel positions, and he expects heavy volatility at 8:30 a.m. Eastern (1:08, 1:16, 1:39, 2:42). His description of that session as “highly manipulated” and his claim that the data is priced in are opinions stated in the review, not findings this transcript can establish.
His standing payroll-week rule, and what it is not
The most concrete piece of teaching is a scheduling rule he attributes to his own mentorship: for a new student, trade Monday of the non-farm-payroll week and do not trade Wednesday, Thursday or Friday (2:18, 2:30). He shows Thursday, Wednesday and Tuesday side by side on the 15-minute chart and says Tuesday delivered price more cleanly while Wednesday and Thursday consolidated (2:35, 2:41, 2:49).
He is careful about the scope of the advice. He says it does not mean someone with more experience, a defined model and controlled position size cannot take trades; his stated concern is a beginner getting wrapped up in a piece of price action, losing their bearings and taking financial damage (2:56, 3:02, 3:11). The five-minute chart of the day is the exhibit he uses for this: price rises to the buy side he marked on the 15-minute view and then spends a long stretch swinging back and forth, which is exactly the condition he tells students to avoid (3:50, 4:00).
Read as a study habit rather than an instruction, the point is that choosing not to trade is itself a decision, and that session quality and event risk can matter as much as having a directional narrative. The weekday rule is his stated guidance to beginners, not a tested calendar effect.
The regular-hours opening range gap
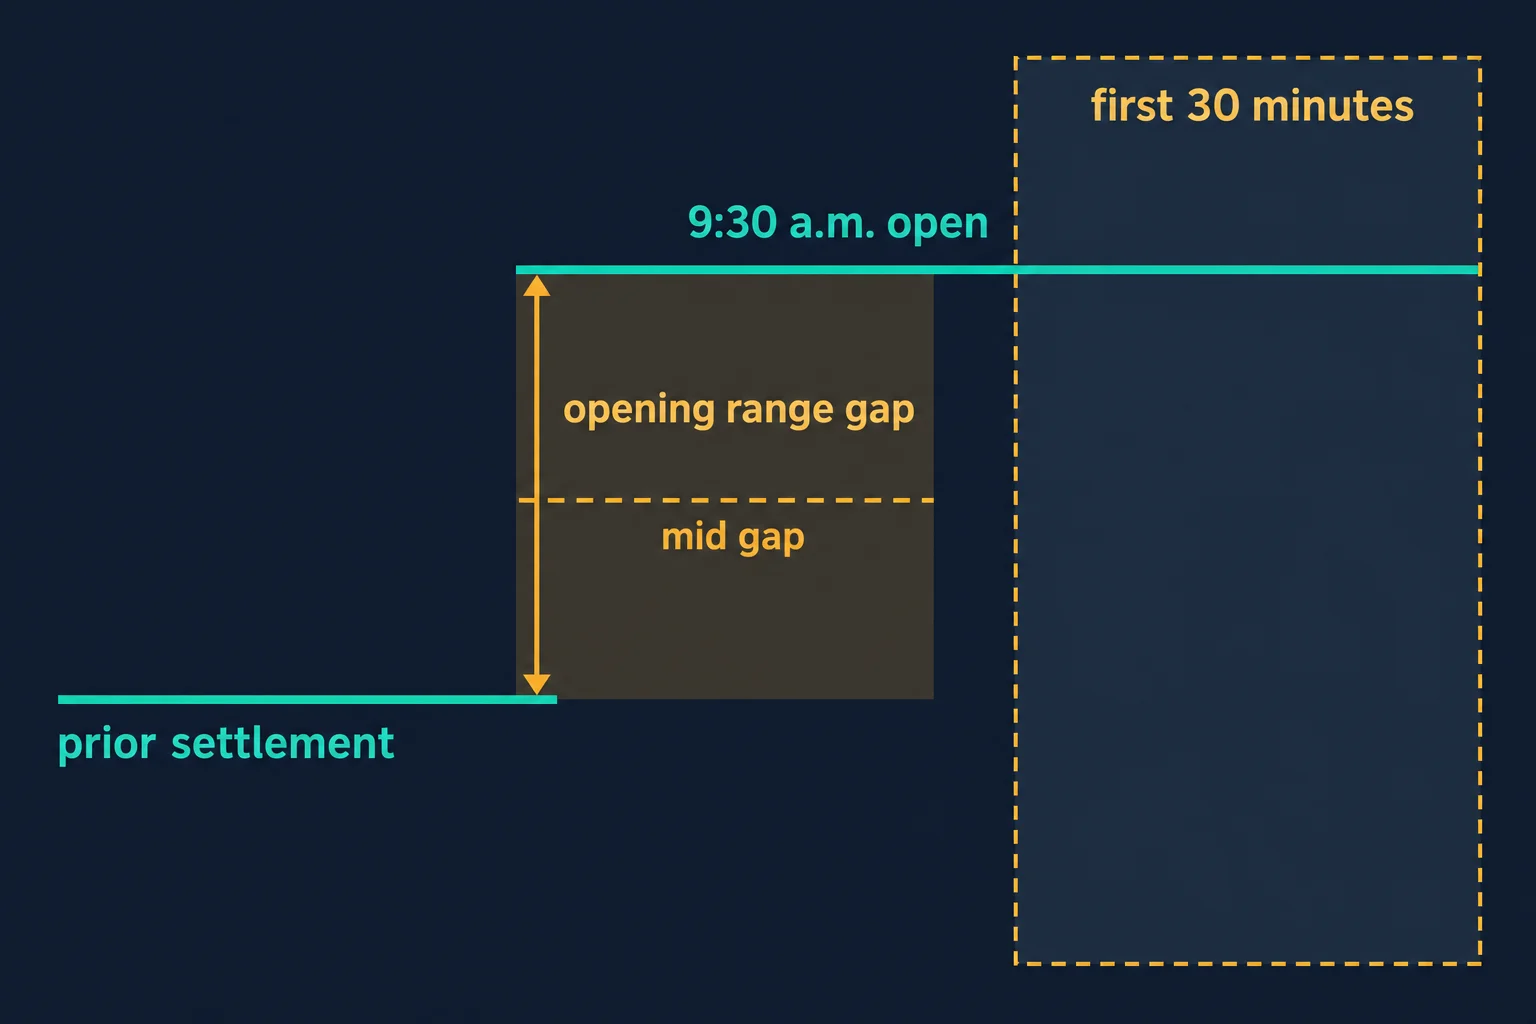
He then opens a one-minute chart with the platform set to regular trading hours, pointing to the RTH label in the lower right, and defines the session as 9:30 a.m. to 4:14 p.m. Eastern (4:22, 4:28, 4:33). The opening range gap is the separation between Wednesday’s 4:14 p.m. settlement and Thursday’s 9:30 a.m. open, and the opening range is the first 30 minutes of trading (4:42, 4:49, 4:51, 5:43). He marks the midpoint as a reference he watches.
On the midpoint he makes a statistical claim and attributes it to his own long experience: he says the gap reaches its halfway level a large share of the time, and when a viewer cited a study saying it does not happen as often as commonly believed, he answered that he had gone back 40 years, holds data going back decades, and that the “70” figure for reaching the midpoint is a good scalping opportunity (5:12, 5:17, 5:31, 5:37). No dataset, sample or methodology is shown in the recording, so the figure is reported here as his assertion rather than a validated statistic.
He reads the day through those levels: opening lower, trading back up to mid gap, pulling back into a fair value gap, rallying with support at mid gap, continuing to the previous day’s settlement, and clearing the buy side after another fair value gap (5:43, 5:48, 5:56). His interpretation of the pause above those highs is that buy stops were being accumulated for the express purpose of trading the market short afterward (6:03, 6:07). That is a description of intent he assigns to other participants, not something the audio evidence establishes.
Imbalance, consequent encroachment and a reclassified gap
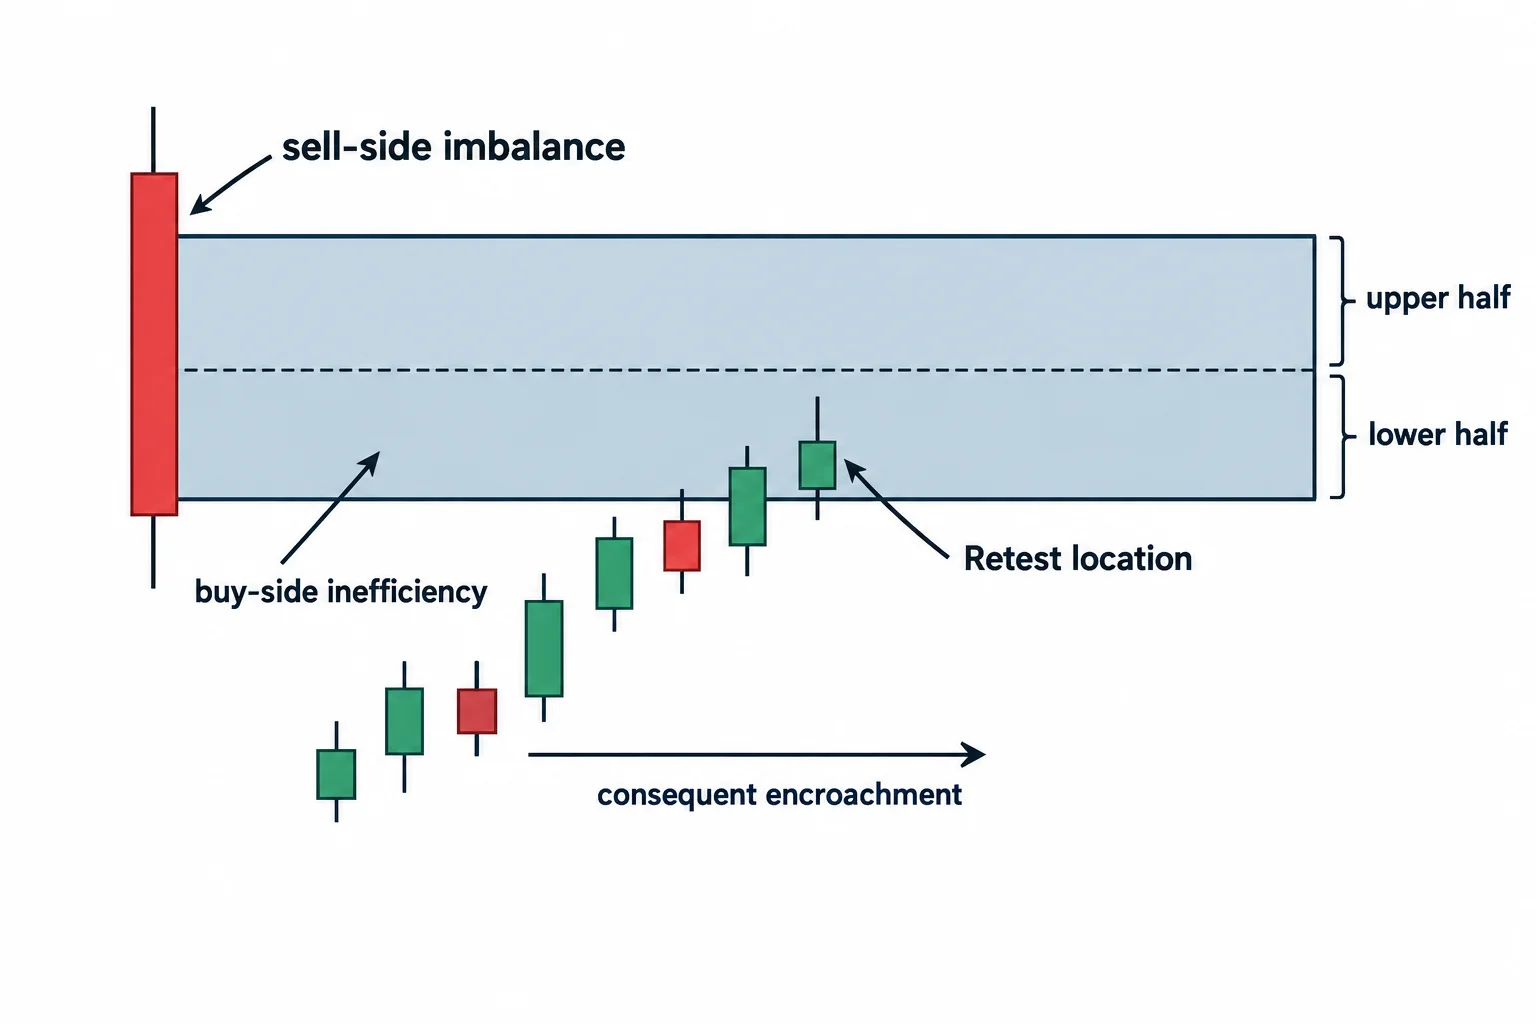
After the buy side is taken, he says price breaks lower into a sell-side imbalance with buy-side inefficiency. He draws a dashed line at the candle low and another at the candle high and marks the middle as consequent encroachment, then describes a rough back-and-forth consolidation inside that range before price rallies back and trades into its midpoint again (6:13, 6:18, 6:23, 6:34).
Switching to an electronic-hours view of the same one-minute chart, the detail he highlights is which half of that range price revisited later in the day: it returns to the lower half and does not reach the upper half, which he reads as favouring further downside, given a pool of liquidity below and the midpoint of the weekly imbalance (6:39, 6:44, 6:58, 7:05, 7:09).
He also describes revising his own read mid-session. After displacement lower left a gap he initially expected price to trade back up into, he says he corrected himself and treated it instead as a breakaway gap (7:23, 7:29, 7:31). The sequence he narrates from there ends with price attacking successive sell-side areas and delivering into the consequent encroachment of the weekly imbalance — the region he says he marked in Monday’s livestream — where he says the low of the day formed before an afternoon consolidation (7:51, 8:01, 8:10).
The reported short, as he tells it
He then zooms to a 15-second chart to show what he says was an inversion fair value gap that the one-minute view could not display: a candle’s sell-side imbalance with buy-side inefficiency that price traded outside of and then came back into (8:20, 8:25, 8:30). His account of the orders is:
- short six contracts at 20,010.75 as price returned into that level (8:34);
- four more added after one further spike up and before the candle’s low was taken out (8:40, 8:46);
- partial exits reported at 19,964.50, then 19,925.00 after a further leg lower (8:46, 8:56, 9:03);
- one more contract off at 19,882.25, which he describes as roughly three handles away from the low of the day (9:12);
- two contracts left running in case price broke down further, which he says were ultimately stopped at 19,941.50 (9:25, 9:30, 9:34).
These figures are a transcription of his retrospective narration. The recording does not show position size relative to the account, commission, slippage or the net result of the sequence, and the audio cannot verify any fill or the chart annotations behind it. The last two contracts being stopped after the profitable partials is part of his account, and it is not treated here as evidence of an edge.
What he says the lesson is
He closes on experience rather than levels. His argument is that a newer trader is unlikely to be able to trade this kind of session the same way, that it would be irresponsible of him as a mentor to teach students to chase those moves, and that the better use of such a day is to sit still and study it, because the alternative is unrealistic expectations (9:34, 9:43, 9:53, 10:03, 10:13).
Stripped of the proprietary vocabulary, the reasoning pattern on display is: start from higher-time-frame context, state what would invalidate the view, treat gaps and liquidity levels as references rather than promises, and be willing to reclassify a gap when price contradicts the first assumption. The percentage he attaches to the gap midpoint and the intent he assigns to stop accumulation are his interpretations; nothing here demonstrates that the framework predicts price or that the narrated sequence is repeatable.
Related source video: October 03, 2024 NQ Market Review
The article is mapped to October 03, 2024 NQ Market Review, a public upload on the channel The Inner Circle Trader. Its watch page, read on 14 September 2026, reports title “October 03, 2024 NQ Market Review”, a page duration field of 647 seconds (about 10 minutes 47 seconds), a publication field of 2024-10-03T16:34:33-07:00, and an upload that is neither unlisted nor private with a playability status of OK.[1] That publication instant is 2024-10-03 23:34 UTC, so the page’s own date and the trading day under review are the same calendar date, and the session he reviews is the Thursday before the Friday payroll release he previews. Every statement in this article is taken from the recording’s spoken narration.
Watch the original review on YouTube
The video cannot be played inside another website: when its embedded player was opened and clicked from a bestprops.com page on 14 September 2026, the player itself reported “Playback on other websites has been disabled by the video owner.” and settled on a “Watch on YouTube” prompt, with no duration and no playback progress reported. That is why this article carries a watch card instead of an embed; the recording is available directly on YouTube.
Primary source and further reading
- The original Inner Circle Trader review — use the timestamp links above to check each statement against its source.
- CFTC — customer advisories and articles — the U.S. derivatives regulator’s risk material for futures customers, and the reason the reported sequence is not presented as a result.[2]
- Investor.gov (U.S. Securities and Exchange Commission) — Day Trading — general risk framing for short-horizon trading; it says nothing about this method.[3]
- 17 CFR 4.41 — disclosures concerning hypothetical performance — the rule governing hypothetical performance claims, cited because channels in this space typically state that displayed performance is hypothetical.[4]
Any ICT, SMC or third-party indicator, script, transcript, note set, spreadsheet or social summary circulating outside the publishing channel’s own upload page is unofficial and untested here. The 70% midpoint figure, the “manipulated day” description and the accumulation-of-stops interpretation are the speaker’s own claims. No performance test, win rate, drawdown figure or account result is claimed anywhere in this article.
Futures and leveraged trading involves substantial risk and is not suitable for everyone. This article is educational commentary, does not provide individualized financial advice, and reports no outcome from any session or account.
[1] October 03, 2024 NQ Market Review — The Inner Circle Trader (watch page read 14 September 2026). [2] CFTC — customer advisories and articles. [3] Investor.gov (U.S. Securities and Exchange Commission) — Day Trading. [4] 17 CFR 4.41 — disclosures concerning hypothetical performance.
