
Key takeaways
ICT’s December 1, 2024 Nasdaq-100 futures commentary lays out a conditional bullish NQ framework ahead of the Sunday evening open, with 21,580.25 named as an upside extension objective only after a sustained break above November’s high.
Read the full summary
ICT’s December 1, 2024 Nasdaq-100 futures commentary lays out a conditional bullish NQ framework ahead of the Sunday evening open, with 21,580.25 named as an upside extension objective only after a sustained break above November’s high. He builds the case from the weekly November range, a daily imbalance he would treat as an inversion fair value gap, and hourly relative equal highs, then reviews how price interacted with the previous new week opening gap on the 15-minute chart. He states that losing a referenced chart low would change his view for the week, and he preferred a softer Sunday open that trades down to the weekly gap and recovers rather than an upper-area open that sells off into it. Because of non-farm payroll conditions, he suggested newer traders focus on Monday and Tuesday setups and finish by Wednesday’s New York session open.
How we researched this article
BestProps used document-based research from primary firm sources, checked September 24, 2026. The complete source list, scope, limitations, and commercial-state record appear near the end of this article.
In New Week Commentary For Nq Futures December 01, 2024, ICT gives a pre-week preview of Nasdaq-100 futures (NQ) before the Sunday evening futures open. He works from the weekly chart down to daily, hourly and 15-minute views. The subjects are November’s range, nearby liquidity, imbalances and gaps, the new week opening gap, and the risk he attaches to the week’s employment data.
Everything below is what the recording states. It is a spoken chart walkthrough, transcribed here by automatic speech recognition, so wording and numbers may contain recognition errors, no chart detail is asserted beyond what he says, and none of it is a tested probability or a recommendation to trade.
November’s range and the conditional upside objective
He opens on the weekly chart with November’s high and low marked for NQ, an imbalance inside that range, and a volume imbalance he asks viewers to note even though he does not annotate it (0:13, 0:30, 0:37). He describes buy-side liquidity sitting above and sell-side liquidity below (0:42).
Before the 6 p.m. Eastern opening bell he says he favors a run higher rather than trying to pick a top, and gives a specific extension reading: measuring from a prior low up to a prior high, he cites 21,580.25 as the upside objective, conditional on price breaking and continuing above November’s high (0:49, 1:00, 1:16). That figure is what he reads off his own chart, and the audio alone does not identify the contract month, the swing points it was measured from, or the retracement tool’s settings, so the level is reported as his stated objective rather than a verified market data point.
The daily chart: imbalance, consequent encroachment and a candidate inversion gap
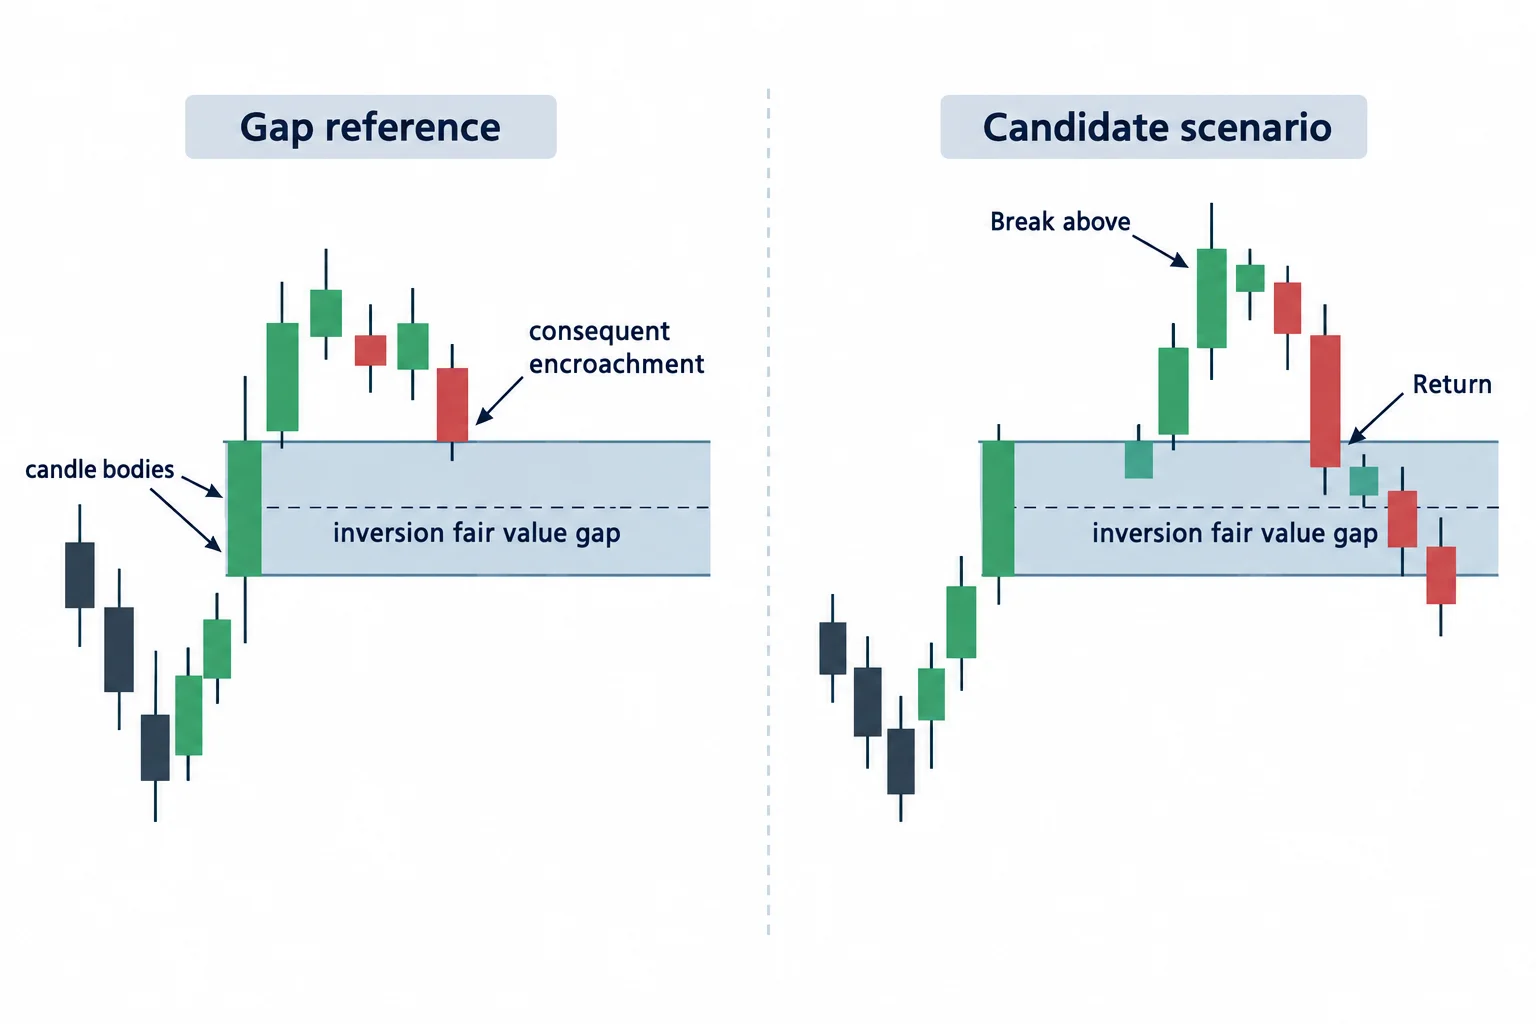
On the daily chart he points to a gap, describes buy-side imbalance against sell-side inefficiency, and marks a volume imbalance (1:52, 1:53, 1:57). He says candle bodies had been respecting the midpoint of a relevant range — consequent encroachment — and notes price had shown down to that level (2:09, 2:17).
His interpretation is that this kind of structure makes sustained directional runs harder, not that trades are impossible: price had been held inside it too long, which he attributes to thinner participation around the U.S. Thanksgiving holiday and the range-bound week that followed (2:23, 2:27, 2:37, 2:46).
The gap above that structure is the piece he returns to. He says that if price breaks higher and then comes back down into it, it could be treated as an inversion fair value gap, and that in his framework support there might act as a catalyst to carry price above November’s high and on to the extension level he showed on the daily view (3:03, 3:23, 3:30).
Hourly relative equal highs and the level that would change his view
Moving to the hourly chart, he marks a pair of relative equal highs and says he is less concerned about an intervening wick than about whether price can trade above those highs with visible strength and willingness to extend from them (3:39, 3:49, 3:53). He also notes a prior stop run in which a low was taken out, and another set of highs left overhead (4:14).
He is explicit that the Sunday opening price is unknowable in advance, and describes what he wants to see: a trade above the nearby highs, the intervening wick largely ignored, and a push up into November’s high (4:30, 4:37). The condition attached to the whole idea comes next: he says that losing the referenced low would change things for the week, and that a breakdown would make him switch gears — until then he stays with the higher-time-frame bullish stance on stock indices (4:53, 5:06). Because the low is only visible on his chart, the recording does not supply a dependable invalidation price — only the condition that a loss of it would matter.
The new week opening gap on the 15-minute chart
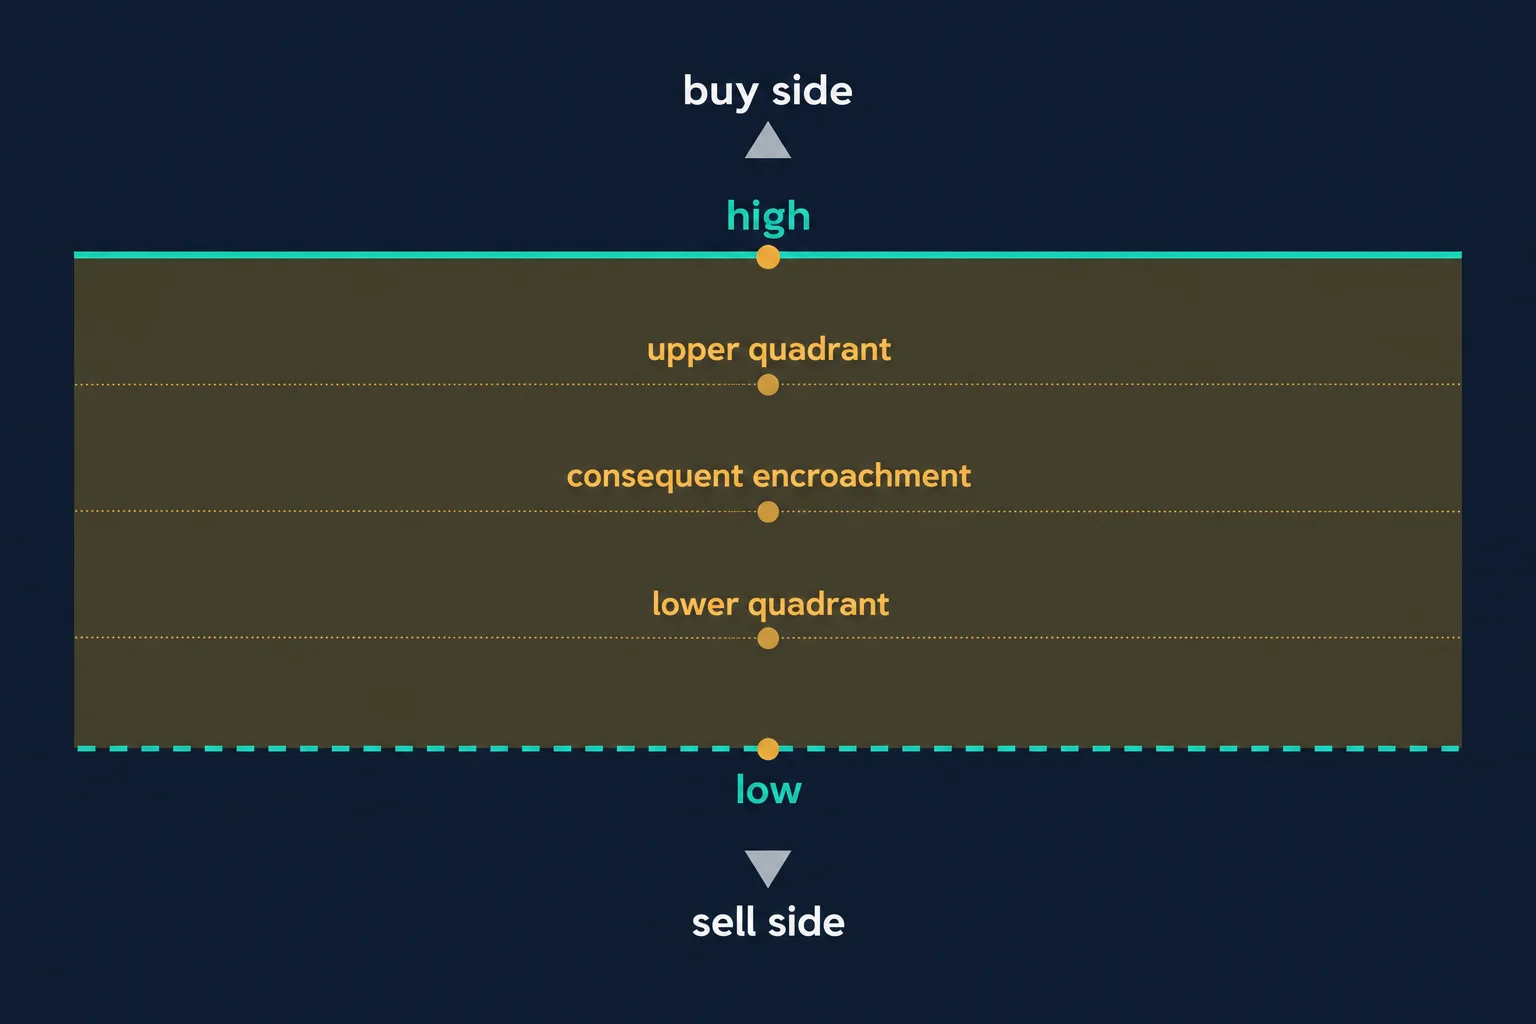
On the 15-minute view he reviews how price had interacted with the previous new week opening gap, which he subdivides into a high, an upper quadrant, consequent encroachment at the midpoint, a lower quadrant and a low (5:34). He walks through the sequence he says followed: Monday’s trading breaking lower into sell side, that sell side later being taken, and price trading back up into consequent encroachment of the gap (5:40, 5:46).
He then narrates a longer list of level interactions — sweeps below the gap’s upper quadrant, a false break, repeated consequent-encroachment touches on the way up, a sell-side sweep he labels optimal trade entry, another sweep below the level he says constitutes the inversion, and finally a trade back down into the lower quadrant of the shaded inversion area and the gap’s high (5:56, 6:26, 6:39, 6:59, 7:05). He presents this as evidence of how precisely his concept organizes levels, which is his assessment of his own reading of the past week’s chart. A voice recording cannot confirm where those bodies sat, whether the levels were drawn before or after the moves, or what any position did — only what he says he was pointing at.
His preferred Sunday-to-Monday sequence
Although he says the chart looks a little toppy to him, he still wants to see an aggressive attempt higher. He then describes which opening path he would prefer, and it is a conditional path rather than a prediction (7:05):
- A softer opening at 6 p.m. Eastern, which he notes was then about 90 minutes away;
- a gap lower and a trade down into the new week opening gap;
- a recovery back above the gap;
- a pullback that finds support, followed by a rally.
He says the opposite path — opening near the upper area and then trading back down into the new week opening gap — would be harder for him to navigate on Monday, and that an open, trade-down, then trade-back-over-the-top sequence would suit him better (7:24, 7:39, 7:57, 8:11). The distinction matters for reading the commentary correctly: a bullish bias did not translate into buying immediately at the open. The path price took into the marked levels was part of his reasoning.
The payroll-week timing note
He closes with a schedule caution rather than a market call. Because non-farm payroll conditions were in play that week, he suggests that traders new to his concepts, or new to trading generally, focus their setups on Monday and Tuesday and be finished by the New York session opening on Wednesday, describing conditions after that point as more difficult or “squirrely” (8:21, 8:26, 8:35).
What the commentary does and does not establish
The transferable idea is the construction of a conditional scenario: he starts with higher-time-frame range and liquidity, refines it on lower time frames, specifies the behaviour he would prefer, and names the condition that would make him abandon the bullish stance. Everything about how the week actually resolved sits outside the recording — he is previewing the week ahead, and the transcript documents the preview, not an outcome. The levels, the terminology and the expected reactions are his market interpretations, not established predictive edges, and no entry, exit, position size, fill or result is verified here.
Related source video: New Week Commentary For Nq Futures December 01, 2024
The article is mapped to New Week Commentary For Nq Futures December 01, 2024, a public upload on the channel The Inner Circle Trader. Its watch page, read on 14 September 2026, reports a page duration of 540 seconds (nine minutes) and records the publication field as 2024-12-01T15:00:02-08:00, which is 2024-12-01 23:00 UTC; the page also reports the upload as neither unlisted nor private with a playability status of OK.[1] The recording itself opens by saying it is Sunday, about ten minutes past 4 p.m. Eastern, ahead of the 6 p.m. Eastern Sunday open and roughly 90 minutes before it — so the spoken moment and the page’s publication field are different instants on the same calendar day, which is why both are stated here rather than treated as a contradiction.
Watch the original commentary on YouTube
The video cannot be played inside another website: when its embedded player was opened and clicked from a bestprops.com page on 14 September 2026, the player itself reported “Playback on other websites has been disabled by the video owner.” and settled on a “Watch on YouTube” prompt, with no duration and no playback progress reported. That is why this article carries a watch card instead of an embed; the recording is available directly on YouTube.
Watch New Week Commentary For Nq Futures December 01, 2024 on YouTube ↗
Primary source and further reading
Four references accompany this guide; none of them was used to reconstruct the commentary.
- The original Inner Circle Trader commentary — use the timestamp links above to check each statement against its source.
- CFTC — customer advisories and articles — the U.S. derivatives regulator’s own risk material for futures customers, listed because this is a futures market commentary.[2]
- Investor.gov (U.S. Securities and Exchange Commission) — Futures — a general definition of the product class being discussed, without any view on this method.[3]
- 17 CFR 4.41 — disclosures concerning hypothetical performance — the rule the channel’s own description area cites when it states that displayed performance is hypothetical, and the reason no performance figure is repeated here.[4]
Any ICT, SMC or third-party indicator, script, transcript, note set, spreadsheet or social summary circulating outside the publishing channel’s own upload page is unofficial and untested here. No performance test, win rate, drawdown figure or account result is claimed anywhere in this article.
Futures and leveraged trading involves substantial risk and is not suitable for everyone. This article is educational commentary, does not provide individualized financial advice, reports no outcome from any session or account, and states no price target as a forecast.
[1] New Week Commentary For Nq Futures December 01, 2024 — The Inner Circle Trader (watch page read 14 September 2026). [2] CFTC — customer advisories and articles. [3] Investor.gov (U.S. Securities and Exchange Commission) — Futures. [4] 17 CFR 4.41 — disclosures concerning hypothetical performance.

