
Key takeaways
The Inner Circle Trader reviews the December 2024 E-mini Nasdaq-100 futures contract, valued at $20 times the index with a 0.25-point minimum tick, from weekly through five-second charts in a roughly thirteen-minute retrospective recording.
Read the full summary
The Inner Circle Trader reviews the December 2024 E-mini Nasdaq-100 futures contract, valued at $20 times the index with a 0.25-point minimum tick, from weekly through five-second charts in a roughly thirteen-minute retrospective recording. ICT identifies 21,580.25 as a pre-week upside reference, applies a daily breakout rule projecting one quarter of the prior range beyond the breakout, and maintains a higher-price bias while noting an hourly high transcribed as 21,567.25. He avoids a fuzzy opening and 9 o’clock range lacking clear expansion, waits for a 10 o’clock liquidity run, and ranks minor and primary buy-side and sell-side levels before targeting the Thursday London-session low at 21,490. He reports shorting above an old high, adding on a rebalance, receiving two layered limit fills while one order and four remaining contracts were not filled, then being stopped near 21,526. On a five-second chart he reworks the short, fades a retail-style bull flag, uses imbalance, midpoint, consequent-encroachment and volume-imbalance references, and says a limit order ultimately filled at 21,490. He later marks relative equal lows as potential sell-side liquidity for payroll Friday or early the following week unless price moves aggressively higher. The reported trades, fills, spreads, charts and results are unverified, and transcript artefacts leave some terminology and numbers uncertain. ICT also says the free 2025 YouTube mentorship will cover daily forex reviews, the dollar index, index futures and commodity markets, while TradingView Bar Replay is suggested for study even though paper and broker orders execute against real-time rather than replay data.
How we researched this article
BestProps used document-based research from primary firm sources, checked September 24, 2026. The complete source list, scope, limitations, and commercial-state record appear near the end of this article.
ICT December 2024 Recording Overview
The video is a market review on the channel The Inner Circle Trader. He opens by telling viewers the channel is not being deleted (0:04) and then begins the chart work on the weekly chart of the Nasdaq December 2024 delivery month (0:10). The recording runs about thirteen minutes and is a retrospective walkthrough of a completed session rather than a live call.
The source used for this article is a timestamped transcript produced by local automatic speech recognition of the full original audio, not YouTube captions. Timestamps are automated and specialised terms and numbers can be mis-transcribed, so this article reports the levels as his spoken references and does not treat them as values read off his charts. Nothing here was verified against the charts themselves, and the reviewer did not see any chart, order ticket or account statement.
ICT December 2024 Weekly Price Reference
He points to a rally and the retracement that followed it, says “this was the high”, and states the level: 21,580.25 (0:52). He says that level came from the guidance he gave in a Sunday pre-market session before the week started trading (0:31), and that he had published his expectation for that draw in his posts on X (1:01).
He also separates the number from a forecast. He says price could still run through it and that being precise about the target is not important to him (2:50). Treating a level as a place in the market to look at is different from claiming the market must reach it.
ICT December 2024 Daily Breakout Rule
On the daily chart (1:15) he sets out the general rule he says he has used for years: once a range is broken out, look for either an upside objective, a straightforward draw on liquidity, or a frame of reference for a potential reversal setup he calls a “turtle soup” (1:37, 1:47). The ruler he proposes for that objective is one quarter of the previous range, taken beyond the breakout (1:57).
He describes the daily chart as trading at all-time highs and says his standing posture was simply to stay with higher prices until price proved otherwise (2:06). He then notes that the daily range printed a higher high but failed to reach the extension, and calls that acceptable rather than a failure of the idea (2:13).
On the hourly chart (3:00) he says price traded above an earlier high and topped out at what the transcript renders as “21 5 67 and a quarter” (21,567.25) before giving back the day's gains and trading lower (3:06). That reading is a few points below the 21,580.25 weekly reference, and the same passage also renders the phrase “just below that 21 500”, which does not match 21,567.25; the words are reported as transcribed and the discrepancy is flagged rather than resolved. He identifies a breaker formed by a high, a low, a higher high and a down-close candle, and says price traded back up into it and was then sent to the sell side (3:35).
Why ICT Found the December Session Difficult
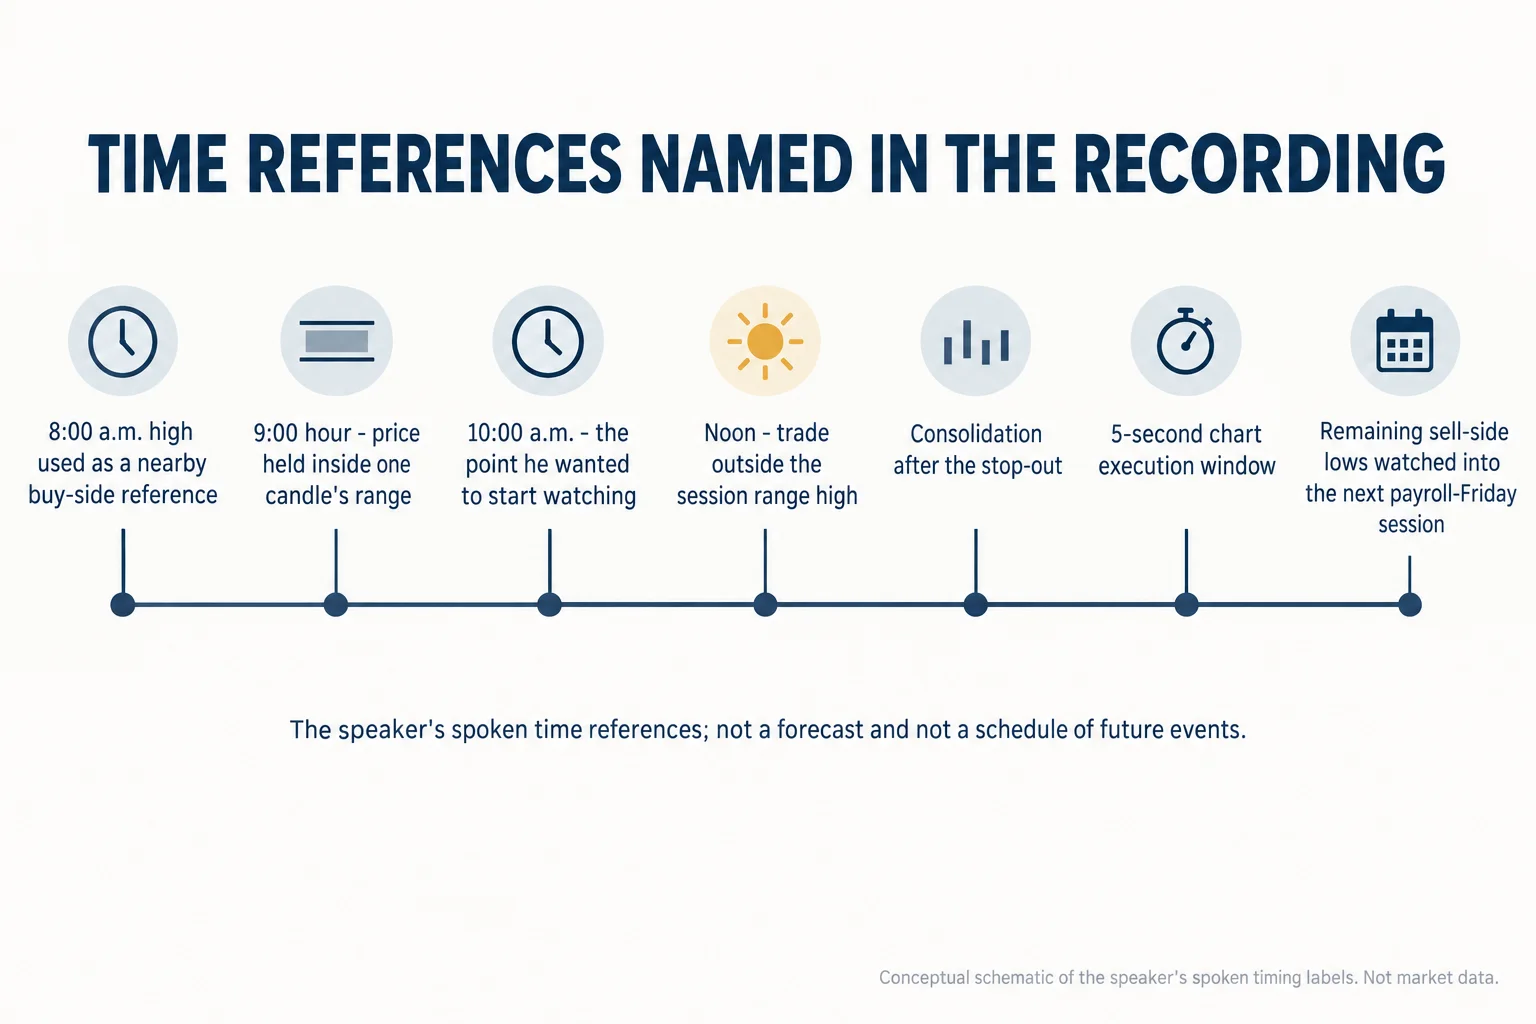
Dropping to the 15-minute chart, he calls the morning delivery “really fuzzy” and says it was problematic because it gave no clear expansion (3:47). His response was to want to see an obvious run at 10 o’clock instead of forcing a read inside the early range (3:58). He notes that the market did eventually trade outside the range high, at the point he describes as noon (4:06).
That wait is the practical content of the section. He is not describing a signal that fired in the first minutes of the session; he is describing a decision to stand aside until the range resolved, and then to work from the liquidity that resolution created.
ICT December Liquidity Levels and Objectives
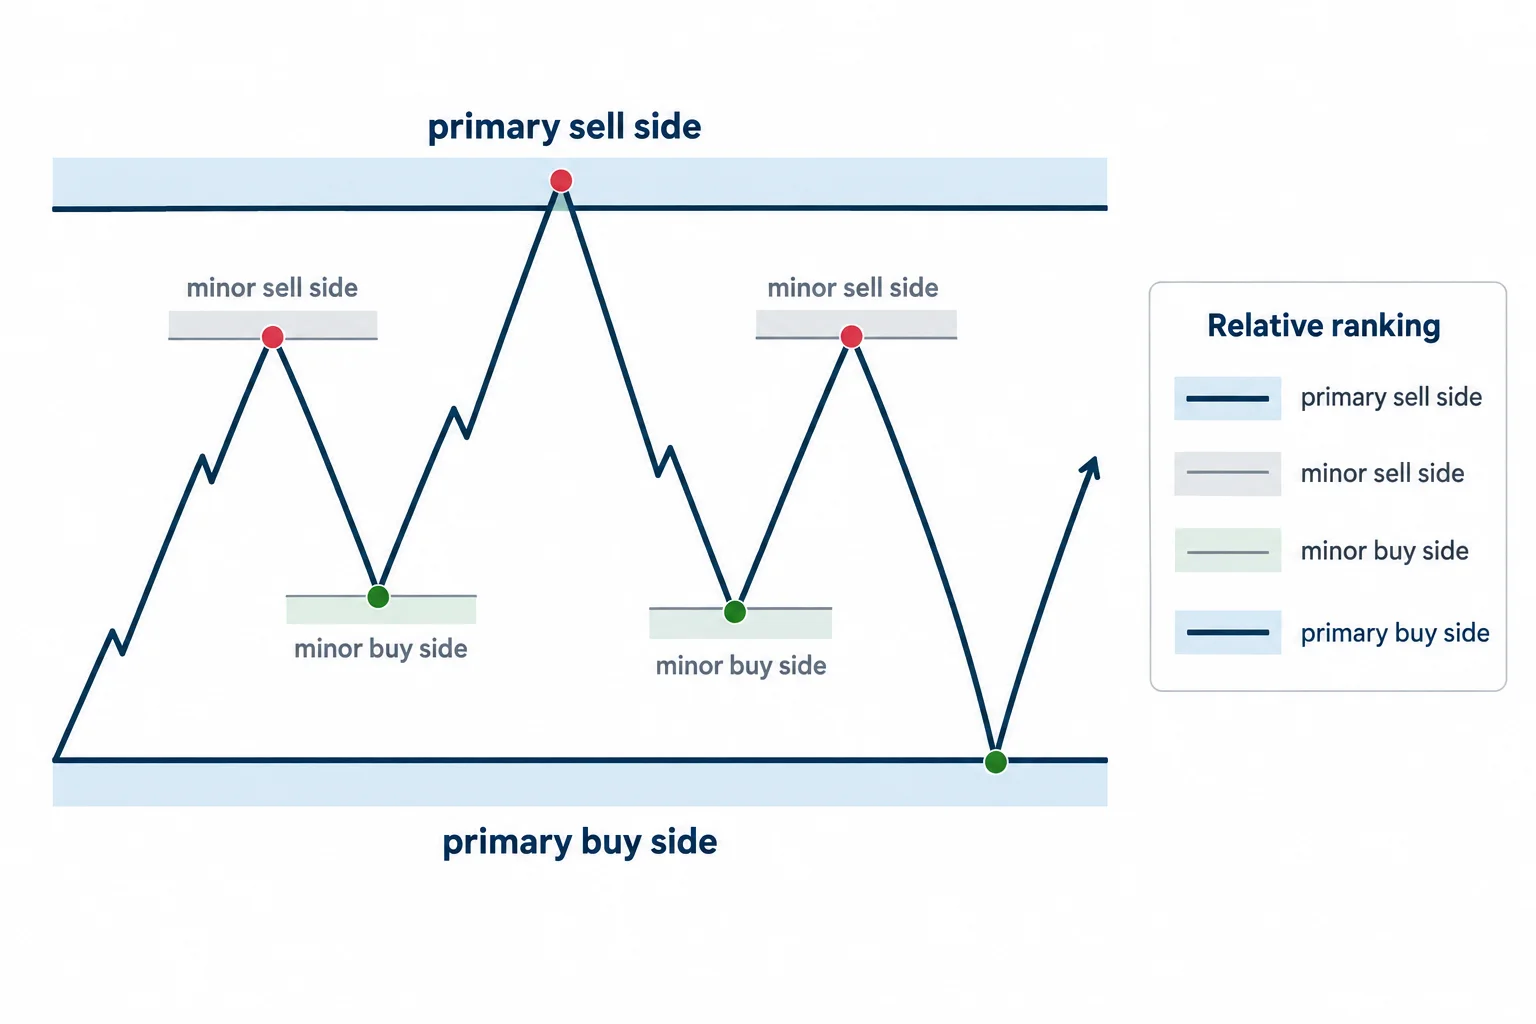
He separates the nearby turning points into levels of different rank. His stated sequence was to take the 8 a.m. high, then work down to 21,490, and then trade in the direction of the 21,580 level, the guidance he says he posted on X that morning (6:44). Before that he labels specific highs and lows as minor buy side, minor sell side, primary buy side and primary sell side (6:06, 6:32). In his framing a high is buy-side liquidity because stops can rest above it and a low is sell-side liquidity because stops can rest below it, so the ranking determines which level is more interesting to him.
The lower objective came from overnight work. He marks the Thursday overnight London session lows on a one-minute chart and says that although two lows were candidates, the one he annotated was the level he called 21,490 (4:48, 5:11). He also describes the 9 o’clock hour as problematic because price stayed inside a single candle’s range (5:26), which is the same reason he wanted to hold off until 10 o’clock (5:45).
ICT December Short Entry Limits and Stop
He says the market traded up and then broke down, and that the bodies of the candles on the rally represented a shift in market structure (7:08). As price traded back above the old high he says he went short, then added when the market rebalanced back up into a nearby low (7:20, 7:33).
He reports that he had several limit orders layered below the market in case price did not reach 21,490, that two of them were taken while one was left behind, that price went right down to his price but the spread would not let him get out, and that the remaining four contracts were not filled either. He then says the market rallied back and hit his stop at the level the transcript renders only as “526”, which reads as 21,526 given the other prices quoted although the full number is not spoken; he adds that he had given that level out on X in real time (7:46, 8:04).
This is his account of his own trading and it is not evidence of anything beyond that. A spoken recap cannot establish broker-confirmed fills, contract count, slippage, spread behaviour or the net result of the sequence, and no statement or platform record appears in the recording.
ICT December Five-Second Execution and Bull Flag
After the stop he describes the market as range-bound and consolidating (8:10), then drops to a five-second chart (8:53) and works through a sequence of progressively higher highs inside a small range. His observation is that the candle bodies respected an imbalance boundary even though wicks traded through it (9:13).
The terminology in this section needs a caveat. The automated transcript renders the boundary he is watching as “Sibi” at one point and as “CIVI” at another, and renders the target as “consequent encouragement”. Those strings are most consistent with his standard vocabulary (a sell-side imbalance/buy-side inefficiency and consequent encroachment), but the terms were not confirmed visually, so they are reported here as transcript artefacts rather than as verified labels on his chart.
He says he went short into that area aiming for the consequent-encroachment level and a volume imbalance (9:37). He notes that on a five-second chart he is entering at market rather than with limits, and adds that he deliberately avoided market replay so that viewers could see orders being filled with the buy and sell buttons (9:43, 9:50). He then describes the retracement as a premium array, calls the area a reclaimed sell-side imbalance with buy-side efficiency, and says price came back to respect the midpoint and the high (10:03, 10:18).
His most explicit statement about the pattern-reading comes next: he says he saw a bull flag that retail would want to trade higher off, and that he faded it instead (10:22). He then describes price breaking down through a low aggressively, the “thin” back-and-forth delivery, a fresh inefficiency, and, after giving room for price to retrace into the higher of two inefficiencies, a sell-off into 21,490 where he says the limit order was filled (10:39, 10:48, 11:02). He says he wanted that filled specifically because he had outlined the level in advance (11:05).
What ICT Expected After the December Session
At the end of the review he marks a run of relative equal lows followed by lower lows and says they are a good candidate for sell-side liquidity (11:23, 11:40). He says that if the market does not trade aggressively higher into the payroll Friday he expects that area to be attacked, either on Friday or in the early part of the following week, and calls it his expectation rather than a known outcome (11:49). The transcript renders “non-front payroll Friday”; in context the scheduled employment report is the reference, and no price or reaction is forecast in the recording.
He closes with housekeeping: he says he will resume daily forex market reviews, mentions the bitcoin 100,000 level as the occasion for it, explains that he is not doing them now because it is the holiday season, and says the 2025 mentorship on YouTube will be free and will add daily forex reviews, the dollar index, index futures and commodity markets across sectors (12:08, 12:25).
How to Study the ICT December Review
The recording is useful as a worked example of process rather than as a record of performance. Four habits in it transfer to study: rank the nearby highs and lows before trading them; refuse to trade an opening range that has not expanded; keep the higher-time-frame objective separate from the entry timeframe; and treat each execution as data about the process rather than proof of an edge.
Two of the claims in the recording are checkable in principle and are not checked here. The levels he says he posted in advance on X are outside the recording, and the fills he reports are not visible to a listener. A student can at least test whether a marked level was knowable before the move by replaying the chart. TradingView's documentation covers turning Bar Replay on, choosing the starting point by date and time, and its stated limits, including that paper and broker orders execute against real-time data rather than the replay feed.[3] That documents the tool, not this trader’s results.
ICT December Instruments and Trading Sessions
The contract being reviewed is the E-mini Nasdaq-100 future, which CME Group documents as $20 multiplied by the Nasdaq-100 index with a minimum tick of 0.25 index points.[1] That is the scale on which the 0.25-point and quarter-point levels quoted in the recording sit, and it explains why he distinguishes values as fine as 21,567.25.
The recording also refers to the holiday season and to Globex session structure; CME Group publishes its Globex and holiday trading hours and notes that the schedule is subject to change and is usually finalised about two weeks before each holiday.[2] The payroll reference is a scheduled release: the U.S. Bureau of Labor Statistics publishes the release calendar for the Employment Situation in advance.[4] None of these sources comments on this review, on ICT’s levels or on any outcome.
Watch the ICT December 2024 Recording
Watch the original recording on YouTube
This recording cannot be played inside another website. A test run from a BestProps page on 14 September 2026 loaded the YouTube player for this video and the player itself returned “Playback on other websites has been disabled by the video owner”, with no playback position and no media data, so no player is embedded here and no restriction beyond that message is asserted. The full recording is available directly on YouTube.
Watch NQ December 05, 2024 Seek & Destroy Review on YouTube ↗
ICT December 2024 Review Sources
- [1] CME Group: E-mini Nasdaq-100 Futures Contract Specs
- [2] CME Group: Holiday and Trading Hours (CME Globex)
- [3] TradingView Help: How do I turn Bar Replay on?
- [4] U.S. Bureau of Labor Statistics: Schedule of Releases for the Employment Situation
BestProps is not affiliated with CME Group, TradingView, the U.S. Bureau of Labor Statistics or the Inner Circle Trader, and no source listed here endorses this article or any setup. Terms such as breaker, buy-side and sell-side liquidity, turtle soup, inefficiency, consequent encroachment, premium array and bull flag are used as descriptive study terms taken from the recording. The trades described are the speaker’s own reported account; nothing on this page demonstrates a tested, repeatable or profitable result, and any practical application involves substantial risk. This review is educational commentary only and is not investment advice.
