
Key takeaways
In NQ Futures Review & The ICT Sick Sister Consolidation Model, ICT reviews a session he had already classified as a consolidation day and explains why the index future that failed to make a matching high was the one he wanted to buy rather than short.
Read the full summary
In NQ Futures Review & The ICT Sick Sister Consolidation Model, ICT reviews a session he had already classified as a consolidation day and explains why the index future that failed to make a matching high was the one he wanted to buy rather than short. He says the week’s heavier scheduled news sat on Wednesday through Friday while Monday and Tuesday had no medium- or high-impact drivers he considered meaningful (0:36), and he points to an older new-week opening gap sitting close to the current one (1:33). Comparing the Dow, the E-mini S&P and the Nasdaq at the same prior highs, he says the Dow exceeded both referenced highs, ES exceeded one of the two and the Nasdaq exceeded neither (7:13) — the lagging market he calls the weak sister. Instead of selling that weakness, he waited for the Nasdaq to drop into what he calls a deep discount: below equilibrium, inside an order block that overlapped a fair value gap and inside the 62%–79% Fibonacci band he calls optimal trade entry (4:26 and 5:25). He reports accumulating there and exiting above a nearer buy-side high rather than at the most distant one (5:44 and 6:19). The recording is his own review of his own framework: it contains no prices, no fills, no order records, no account figures and no independently verified results.
How we researched this article
BestProps used document-based research from primary firm sources, checked September 24, 2026. The complete source list, scope, limitations, and commercial-state record appear near the end of this article.
The recording was published by The Inner Circle Trader on 8 May 2023 and runs about eleven minutes. The transcript used here is the video’s own English caption track, which is auto-generated, so some ICT terms and numbers are mis-recognised; where that happens the term is normalised only when the surrounding context supports it, and anything genuinely ambiguous is flagged rather than smoothed over. Everything below is what he says in the recording, checked against its timed passages. No chart detail is reported as independently observed, and nothing here is a recommendation to copy a trade.
Why ICT expected a consolidating session
He begins with the calendar. The more consequential scheduled news for that week was concentrated on Wednesday, Thursday and Friday, while Monday and Tuesday lacked what he regarded as meaningful medium- or high-impact drivers, so he expected consolidation days rather than trend or swing days (0:36). He then describes price briefly penetrating a high and coming straight back inside the range between that high and a low (1:01), and says explicitly that he does not read that as a swing day or a trending day.
That does not make the session untradeable in his framework. He says a range-bound market can still offer setups, but the trader has to be far more nimble and far better versed in market symmetry (1:22). The other structural input he mentions is an older new-week opening gap sitting in close proximity to the current one; he says he covered that on his own tweet rather than on the chart in the video (1:33), and later repeats that converging new-week opening gaps, or gaps very close to one another, make sideways trade likely (8:51). A calendar he calls anemic is the third factor he says was leaning on the market (9:02).
The cross-market comparison: Dow, ES and Nasdaq
The comparison starts with the Dow against the Nasdaq (1:47). He points out that the Dow was able to make a higher high while the Nasdaq was unwilling to make that same higher high (2:03 and 2:07), which is the pattern he teaches as SMT. He then brings ES into the comparison (3:17), saying it also made a higher high but not the one he is pointing at around eight o’clock in the morning (3:20 and 3:23), while the Nasdaq printed a lower high across both referenced highs (4:14 and 4:19).
His tally a few minutes later is the concrete part of the argument. He says one of the two referenced highs was taken out on ES, both were taken out on the Dow, and neither was taken out on the Nasdaq (7:05, 7:10 and 7:13), and he calls that the Sick Sister (7:16). He adds that all three dropped from those highs but that the Nasdaq could not get back above the old high, and that the Dow gave back the high it had set around 2:30 in the previous session while ES was not willing to do so (6:49 and 6:57); that last comparison is partly garbled in the caption track, so it is reported here as his reading of the previous session rather than as a verified level. His conclusion from it is that a consolidating market like this one is likely to drop into a discount and then rally back to the buy side (7:18 and 7:21).
What makes this Sick Sister rather than plain SMT
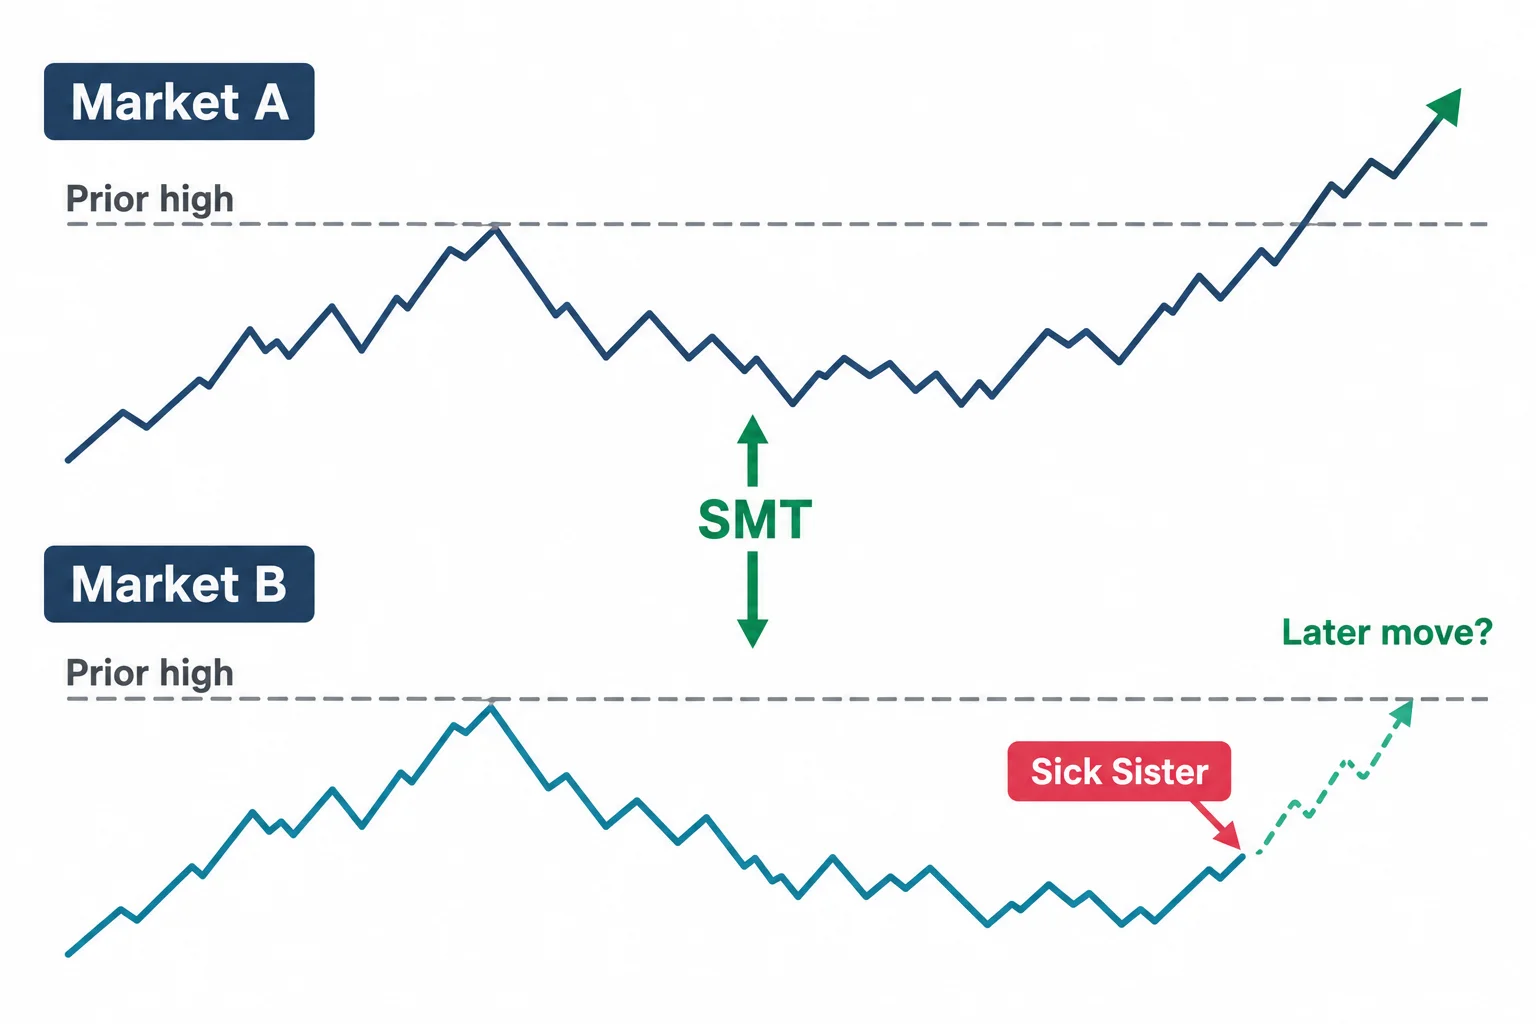
He is careful to separate the two ideas. In a trending market, he says, the Sick Sister opportunity is a move that has not yet happened on one asset or correlated market — meeting or exceeding an old high or old low (2:22) — and he stresses that Sick Sister is similar to, but not the same as, SMT (2:16).
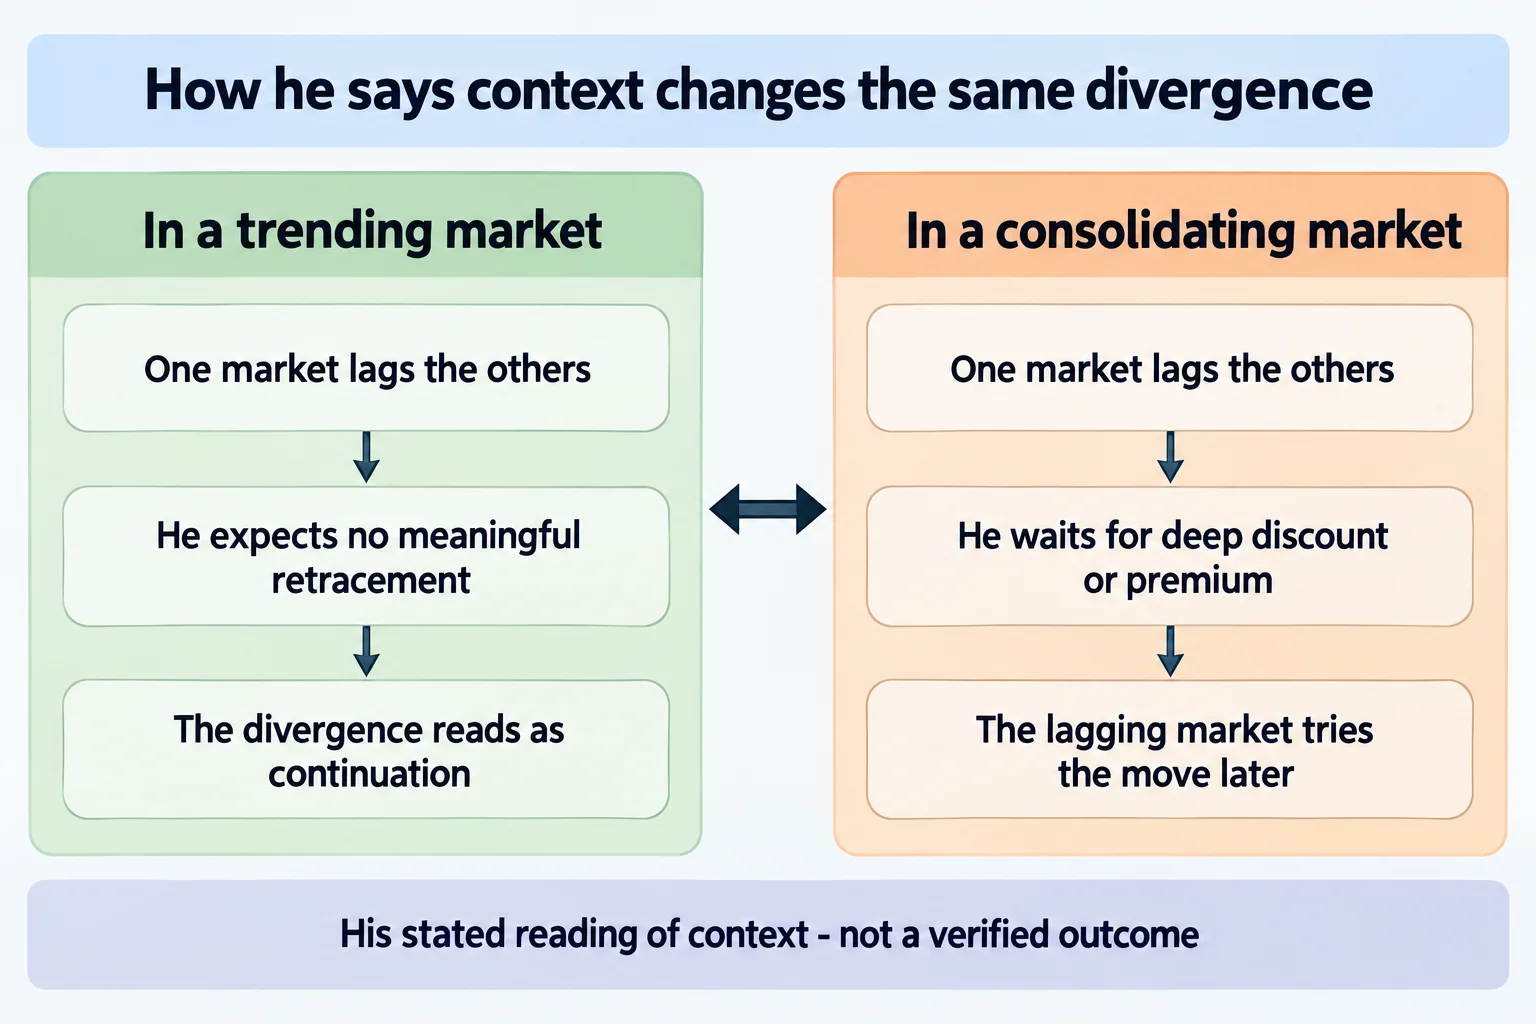
The difference is in what you do with the divergence. In a consolidation, he says, the model still looks for the market that failed to make the corresponding higher high or lower low, which is like typical SMT (7:41 and 7:45), but the Sick Sister approach assumes that market will try to make that move later, so his focus goes to the weakest one (7:50 and 7:57). He quotes a line he uses for it, that the first now shall be last later (8:00), and observes that the Nasdaq could not muster enough momentum to climb while ES managed to edge a little higher (8:05 and 8:11).
How the discount long was framed
Once the Nasdaq is identified as the weak one, his instruction to himself is to wait for it to drop into a deep discount (4:26 and 4:33). He runs a Fibonacci retracement from the low up to the high of the range he is working (4:35, 4:41 and 4:51), marks the optimal trade entry band and equilibrium (4:53 and 4:55), and notes that price trades below equilibrium and then into an order block he describes as a run of consecutive down-closed candles, with a fair value gap inside the same area (5:00 and 5:03).
The specific numbers he cites are the 62 and 79 levels on that Fib (5:25). He says he was looking to buy in discount rather than chase price that had already rallied (5:27), and that he did not need price to travel all the way to the most distant high to find a trade (5:17). He then reports what he did: accumulating a position inside the order block, inside the fair value gap and inside the deep discount (5:44), aiming at the buy side above the nearer high and above a second reference, with an additional target between the two (5:53, 5:59 and 6:02).
He says he did not hold for the most distant high even though he thought it was likely to be reached, and exited above the nearer one because he believed that once the buy side was taken price could want to rejoin what ES and the Dow had already shown (6:14, 6:19 and 6:24). That sequence — identification, location, target, exit — is his retrospective account of one session. The captions do not establish contract symbols, entry and exit prices, position size, risk parameters, fills or a net result, and nothing in the recording independently verifies that the model works.
What he says happened into the afternoon
He walks forward to the 2 p.m. hour and says price traded back down into an order block, rallied and bumped the buy side, and then dropped sharply from just above those highs (9:14, 9:17 and 9:22). His caution there is that such a reaction can leave the high untouched, so he singles out the particular highs he was actually focused on rather than every high on the page (9:32 and 9:35).
He also pushes back on how his tweet was read. In his words, the idea never justified buying simply because price was going up — the whole point was to buy at a discount, which means waiting for price to drop first (9:45 and 9:54). He then describes price working down into the opening session and the typical 30-minute opening range, and notes that when it is dropping inside that range while trading into a deep discount, inside the fair value gap, inside the order block and below equilibrium, the price-delivery arrays are lining up with a potential long ahead of the afternoon session (10:06, 10:11 and 10:14).
The same divergence means something different in a trend
The clearest qualification in the recording comes at the end of the cross-market discussion. If the same divergence appeared while the market were trending, and he did not believe a reversal or even a meaningful retracement was likely, he says he would expect the market to resume and go higher instead (8:20 and 8:28). It is the consolidation classification — supported in his account by the converging new-week opening gaps and the empty calendar — that turns the lagging market into a discount-buying exercise rather than a continuation short (8:48).
Sick Sister model takeaways from this review
Read as a sequence rather than a signal, the steps he demonstrates in this recording are:
- Classify the session first: consolidating or trending, using the calendar and the new-week opening gaps as inputs.
- Compare correlated index futures at the same prior highs or lows.
- Identify the market that failed to confirm the others — in this session, the Nasdaq.
- In consolidation, wait for that market to reach a deep discount for a bullish idea, or by implication a premium for a bearish one, rather than shorting the weakness.
- Use the nearer liquidity references as objectives instead of assuming every distant level must be reached.
- Expect the same divergence to read as continuation rather than catch-up when the market is trending.
He closes by saying more refined Sick Sister lessons will follow in their own presentation, and by drawing the parallels and oppositions to what is classically seen as SMT: the two ideas are similar, but the way the later discount or later premium is used is, in his words, starkly different (10:36, 10:51 and 10:55).
NQ Futures Review & The ICT Sick Sister Consolidation Model
The Inner Circle Trader · published 8 May 2023 · about 11 minutes. This is the primary source for this article; every timestamp link above points into it.
The video is not embedded here because the owner has disabled playback on other websites. That was checked directly on 15 September 2026: the player loads and returns “Playback on other websites has been disabled by the video owner” instead of playing, at both desktop and mobile viewport sizes.
These are the sources checked for this article. The regulator and industry pages below are general material about leveraged futures trading and about trading systems sold to the public; they are not assessments of ICT or of anything said in the recording, and none of them verifies a statement made here. Any ICT, smart-money or third-party indicator, script, note set or transcript circulating outside the publishing channel’s own upload page is unofficial and untested here.
- [1] NQ Futures Review & The ICT Sick Sister Consolidation Model — The Inner Circle Trader (primary source; watch page read 15 September 2026, 11M08S)
- [2] The Inner Circle Trader — official YouTube channel (read 15 September 2026)
- [3] CFTC — Fraud Advisory: Commodity Trading Systems Sold on the Internet (read 15 September 2026)
- [4] NFA — Investor Education & Resources (read 15 September 2026)
This is independent educational commentary on one speaker’s framework and his review of one session. It is not official ICT material, it is not a tested trading system and it is not investment advice. The recording states no profit or loss figure and none is reported here. Leveraged index futures trading involves substantial risk and is not suitable for everyone.
