
Key takeaways
In ICT Mentorship 2023 – August 22, 2023 Forex & Index Futures Review, a seven-minute review, ICT describes only a “very soft bias” toward a higher dollar (0:42), works through pierced relative equal lows on the euro and a range-bound pound, then moves to the S&P and Nasdaq daily charts.
Read the full summary
In ICT Mentorship 2023 – August 22, 2023 Forex & Index Futures Review, a seven-minute review, ICT describes only a “very soft bias” toward a higher dollar (0:42), works through pierced relative equal lows on the euro and a range-bound pound, then moves to the S&P and Nasdaq daily charts. He points to a daily sell-side liquidity pool beneath the S&P as his focus area (2:49), tracks how candle bodies respected a daily fair value gap’s lower boundary, and labels the five-minute Nasdaq sequence an example of his 2022 model: price into a bearish order block, displacement, a new fair value gap, a retracement into it, then a lower low (5:50). The recording is retrospective chart commentary: it contains no confirmed entries, fills, executed trades or performance figures.
How we researched this article
BestProps used document-based research from primary firm sources, checked September 24, 2026. The complete source list, scope, limitations, and commercial-state record appear near the end of this article.
This article covers a short review, so it stays close to what was said. It explains ICT’s chart-reading in his own terms; it does not test his model, and nothing here is a recommendation to trade index futures or currencies.
Dollar context and the currency pairs
ICT opens on the Dollar Index at 0:21. He notes the higher high he had been watching for did arrive, and says a further run toward his objective remained possible even though price failed to reach it that day. He characterizes the whole read as a “very soft bias” for a higher dollar — his own hedge on the direction, not a firm forecast.
At 0:46 the review turns to the euro. He points to relative equal lows that were pierced that day and says the move does not look finished to him. He then references an inversion fair value gap and its consequent encroachment, and describes price running up into that midpoint, selling off, and digging into sell-side liquidity. His stated expectation is a deeper run below those lows, which in his framework corresponds to another higher high on the dollar and another lower low on the euro. The captions garble part of this terminology, so the terms are reported as he uses them rather than reconstructed from chart values.
On the four-hour view he repeats that the relative equal lows had just been pierced, and calls the current forex ranges very difficult to trade. The British pound gets a brief mention at 1:45: he describes it as “a mess too” that cannot escape its range, and says that condition had held for the entire month of August. He uses it to argue against trying to pass a funded-account challenge during the slow summer months. That is his practical opinion from this session, not evidence that every summer market or evaluation behaves the same way.
Daily equity-index framework
At 2:11 he moves to the index futures. For the S&P he says price dropped into a daily gap he had flagged the previous night, though he had not drawn the lines on the chart at the time. For Nasdaq he says price reached the daily fair value gap, traded through it and up into a bearish order block around the opening price, then closed the day below its open. That closes the sequence he had described on the daily timeframe.
He then frames the question forward rather than as a call: he wants to see whether the indices start to roll over and make a run at sell-side liquidity. On the S&P specifically, the sell-side liquidity pool at 2:49 below the market is where he says his focus would be. The review presents that as a scenario to monitor, not a confirmed forecast.
Reading the S&P daily inefficiency
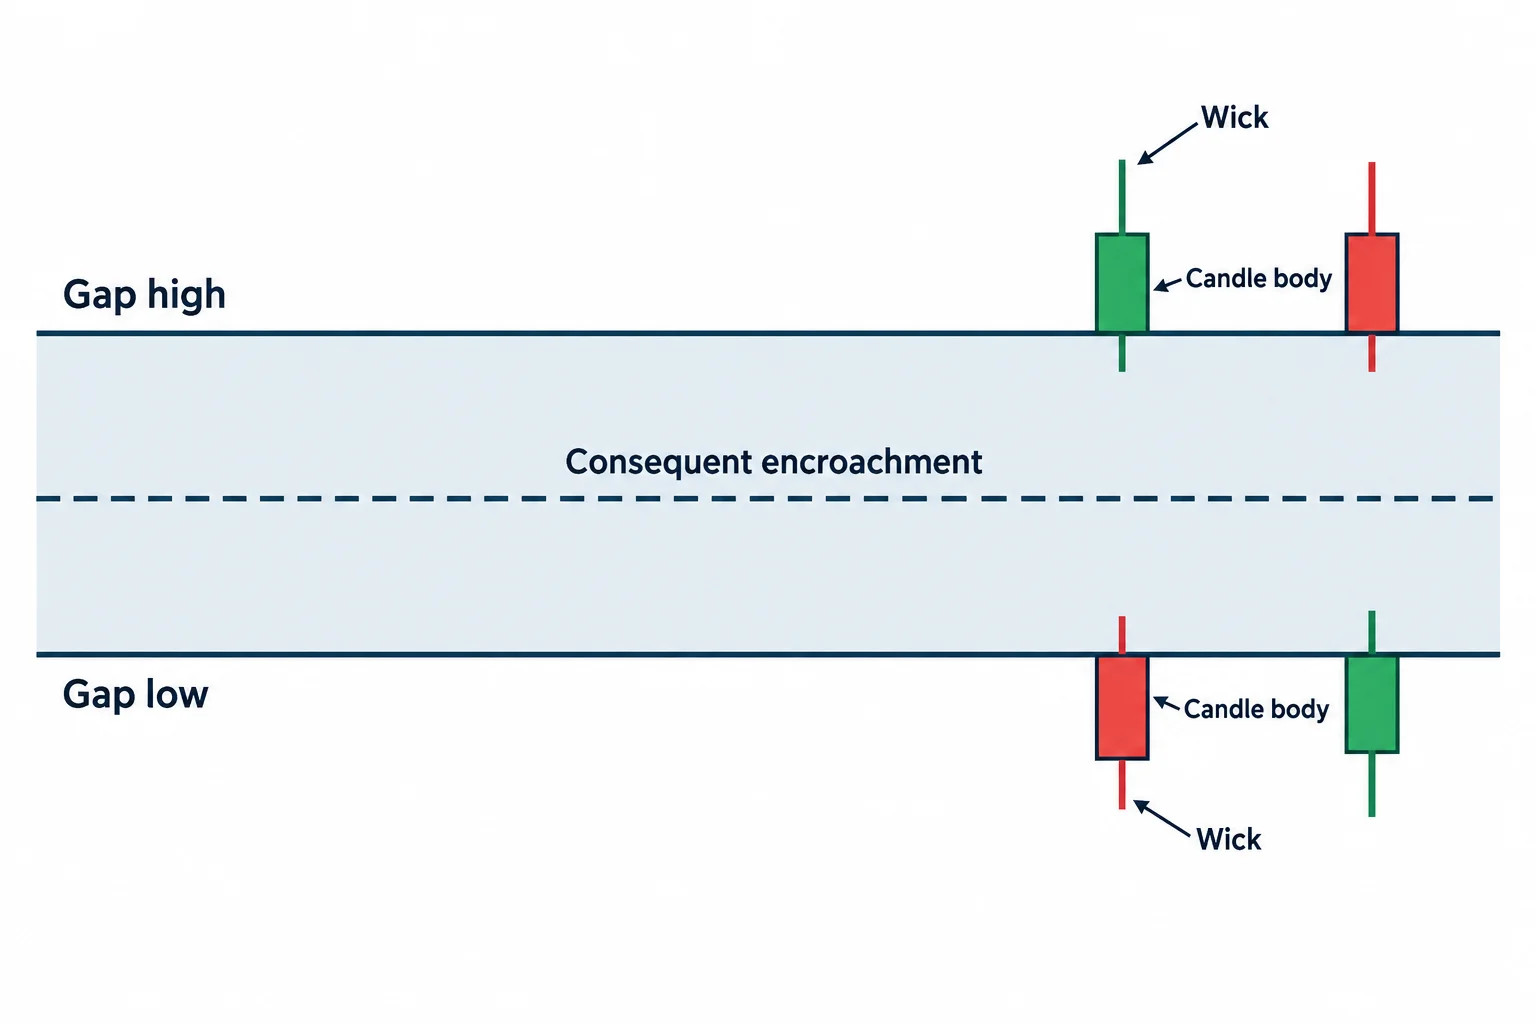
From 2:57 he relates the hourly chart back to the daily fair value gap. He identifies the two candle levels that define the gap’s upper and lower boundaries, notes that he had discussed it the previous night, and adds the bearish order block level to the Nasdaq version of the same picture only that day. He distinguishes bodies from wicks throughout: in his account, the candle bodies respected the lower boundary of the daily gap, and it was the wicks that did the damage through it.
His narrated sequence is that buy-side liquidity was taken, price respected the lower level of the daily fair value gap with its bodies, then traded lower toward the gap’s consequent encroachment — the midpoint between its high and low — and down to the low of the inefficiency just outside it, before consolidating inside the range. He also notes a daily bearish order block and sell-side liquidity in the same area. By the afternoon he calls the action sloppy.
Fifteen-minute and five-minute detail
On the 15-minute charts at 4:15, ICT says the S&P reached the low of the daily fair value gap he had expected price to visit, then broke lower and worked down to the low of the daily inefficiency before a messy afternoon consolidation. For Nasdaq he describes a trip into the bearish order block, which puts price in what he calls premium, with relative equal lows below as the likely location for sell-side liquidity. He then narrates the lower-time-frame progression: price breaks lower through a smaller fair value gap and a breakaway gap, fails to recover the area, works over a breaker with a high, low and higher high, consolidates, then attacks the lows.
The five-minute review starts at 5:12. On the S&P he points to price digging into the daily fair value gap, breaking lower into consolidation, breaking again, and forming a small fair value gap that price traded back up into before displacing lower. He returns to the bodies-versus-wicks distinction around the sell-side boundary of the inefficiency, then describes a break below consequent encroachment and a further dig into the low of the daily inefficiency.
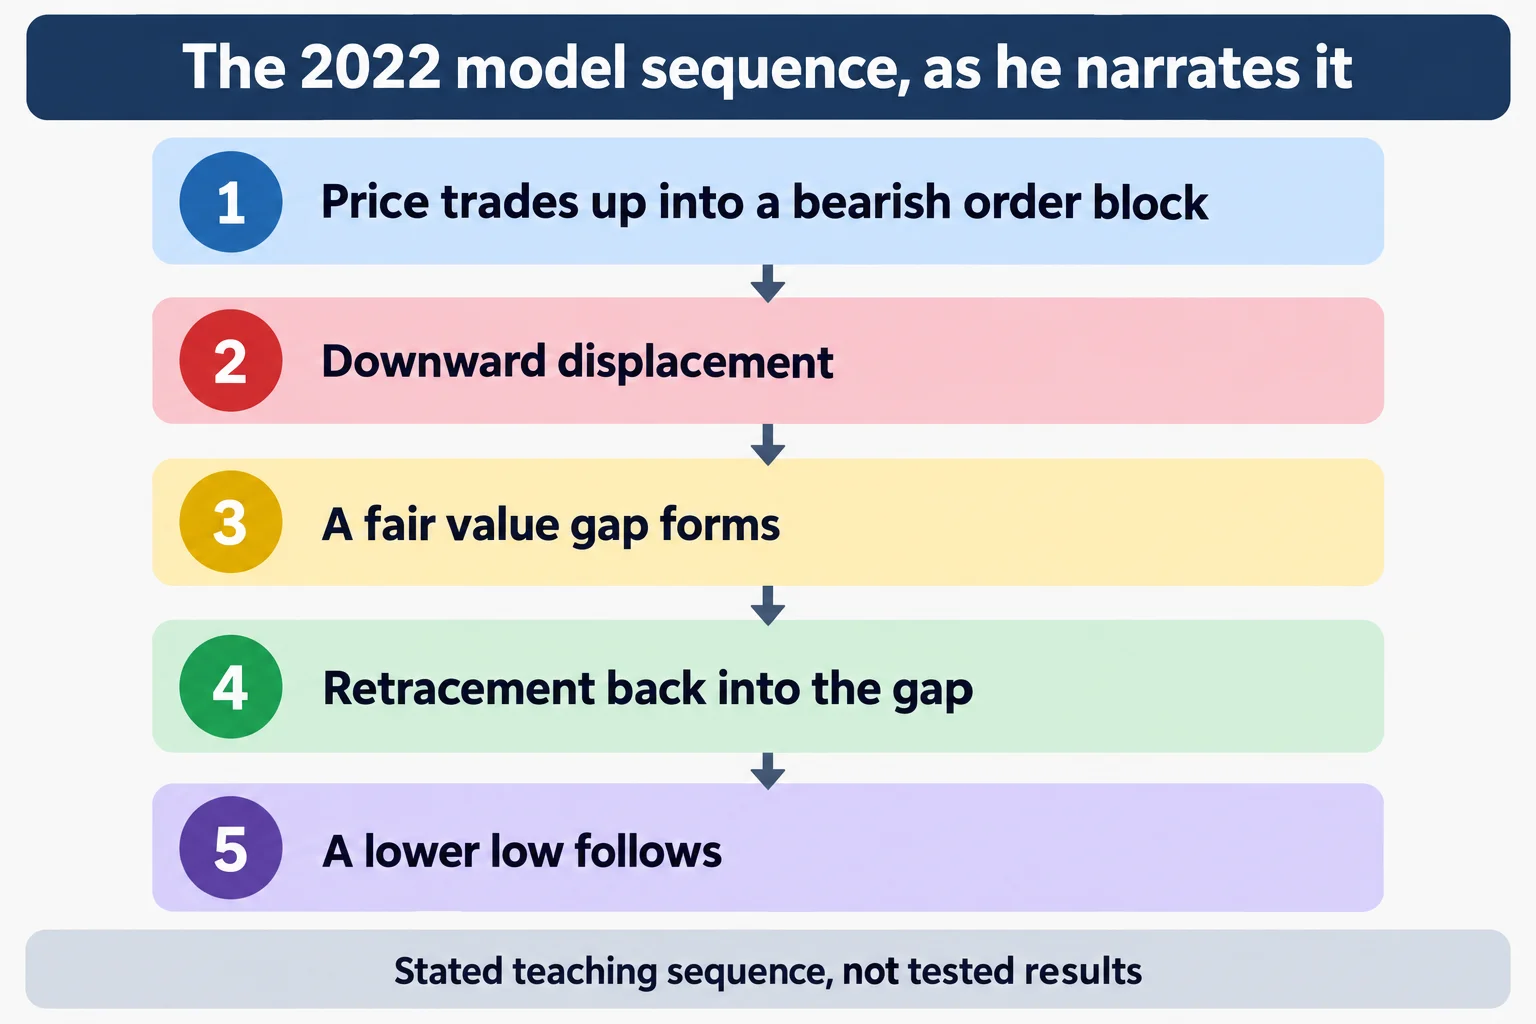
At 5:50 he returns to Nasdaq and explicitly labels the sequence as model 2022: price trades up into a bearish order block sitting above the daily inefficiency’s high, displaces lower from a short-term low, and forms a fair value gap. His stated playbook is to sell short, wait for displacement, and then watch how price behaves around a new inefficiency and its consequent encroachment. He describes a failure at that level, a break lower into sell-side liquidity, another fair value gap, a trade back up into it and then a lower low, followed by consolidation into the close. The recording is retrospective chart commentary; the captions alone do not establish that any short was executed or what it returned.
The process the session illustrates
Setting aside ICT’s directional conclusions, the review demonstrates a top-down chart-reading order:
- Begin with a daily imbalance or order-block area.
- Identify potential liquidity around prior or relative equal highs and lows.
- Use hourly and 15-minute charts to observe how price enters or rejects the daily area.
- On a five-minute chart, look for displacement, a newly formed imbalance, and a retracement into it.
- Avoid treating every consolidation as a clean setup, particularly when price action is range-bound.
That list restates his framework. It is not proof of a repeatable trading edge, and he presents the sequence as chart study rather than as a signal to copy.
What this review does not establish
What can be checked is that ICT said these things, on this date, about this session. The recording is verbal commentary over charts: no statements, fill history, order tickets or account records appear in it, and no confirmed entry, exit or result is claimed anywhere. The automated captions are rough on parts of the terminology, and the recording contains no readable chart values, so this article does not infer exact prices, fills or later outcomes from the narration.
The directional statements are attributed to him throughout. “Very soft bias,” the expectation of a deeper euro run, and the sell-side liquidity pool beneath the S&P are his chart interpretations at that moment, not independently verified market rules, and a review recorded after the session shows what he says he expected rather than a tested forecast.
Watch the original recording
ICT Mentorship 2023 – August 22, 2023 Forex & Index Futures Review
The Inner Circle Trader · uploaded 22 August 2023 · about 7 minutes. This is the primary source for this article; every timestamp link above points into it.
The recording is not embedded here because the video owner has disabled playback on other websites. That was checked directly on 15 September 2026: the player loads and returns “Playback on other websites has been disabled by the video owner” rather than playing.
The recording runs about seven minutes and is the only primary source used for this article. The channel is The Inner Circle Trader on YouTube.
Resources
These are the sources checked for this article. The CFTC and Investor.gov pages are general regulator and investor-education material — on leveraged foreign-exchange fraud, on trading systems sold online, and on what leverage is. They are not assessments of ICT or of anything said in the recording, and none of them verifies anything claimed here. Third-party copies, notes and indicator bundles derived from his material circulate outside his own distribution and were not tested here.
- [1] ICT Mentorship 2023 – August 22, 2023 Forex & Index Futures Review — The Inner Circle Trader (primary source; watch page read 15 September 2026, 6M51S)
- [2] CFTC Learn & Protect — Forex Frauds (read 15 September 2026)
- [3] CFTC — Fraud Advisory: Commodity Trading Systems Sold on the Internet (read 15 September 2026)
- [4] Investor.gov — Glossary: Leverage (read 15 September 2026)
This is independent educational commentary on one market review. It is not official ICT material, it is not a tested trading system, and it is not investment advice. All directional statements and level references are the speaker’s own chart interpretations. Index futures and leveraged foreign-exchange trading involve substantial risk and are not suitable for everyone.

