
Key takeaways
In ICT Mentorship 2023 – Market Review June 24, 2023, a Saturday review recorded on 24 June 2023 that runs about 20 minutes, ICT works through the U.S.
Read the full summary
In ICT Mentorship 2023 – Market Review June 24, 2023, a Saturday review recorded on 24 June 2023 that runs about 20 minutes, ICT works through the U.S. Dollar Index, EUR/USD and E-mini S&P futures with his gap and liquidity framework, and deliberately holds back a longer-term view until he has seen the Sunday open and Monday’s trade (0:26, 1:20). He defines an opening range gap as the distance from one session’s settlement to the next 9:30 a.m. New York open, says opening range gaps and new day opening gaps are short-term imbalances he gives a five-day expiry, and says new week opening gaps can stay on his chart for months (7:59, 9:49). Friday’s ES session is then reconstructed on five-minute and one-minute charts around the opening gap, its midpoint and a lower daily fair value gap, with two named intraday windows (11:09, 16:03, 17:58). The levels and the outcome he reports are his own account; captions do not establish fills or results.
How we researched this article
BestProps used document-based research from primary firm sources, checked September 24, 2026. The complete source list, scope, limitations, and commercial-state record appear near the end of this article.
What this review covers
In ICT Mentorship 2023 – Market Review June 24, 2023, published on the The Inner Circle Trader channel on 24 June 2023, ICT reviews the U.S. Dollar Index, EUR/USD and E-mini S&P 500 futures through his fair value gap, liquidity and opening-gap framework. The upload date and the session date agree: it is a Saturday review of the week just ended. He also emphasizes uncertainty. Rather than presenting a firm forecast, he says he wants to observe the Sunday open and let Monday’s trade develop before committing to a broader view (1:20). Counting the sessions in a five-day window is the same kind of date arithmetic as the site’s trading day requirement calculator, which is kept here as a related internal tool and is not part of the speaker’s lesson.
Dollar Index: two conditional paths around a weekly gap
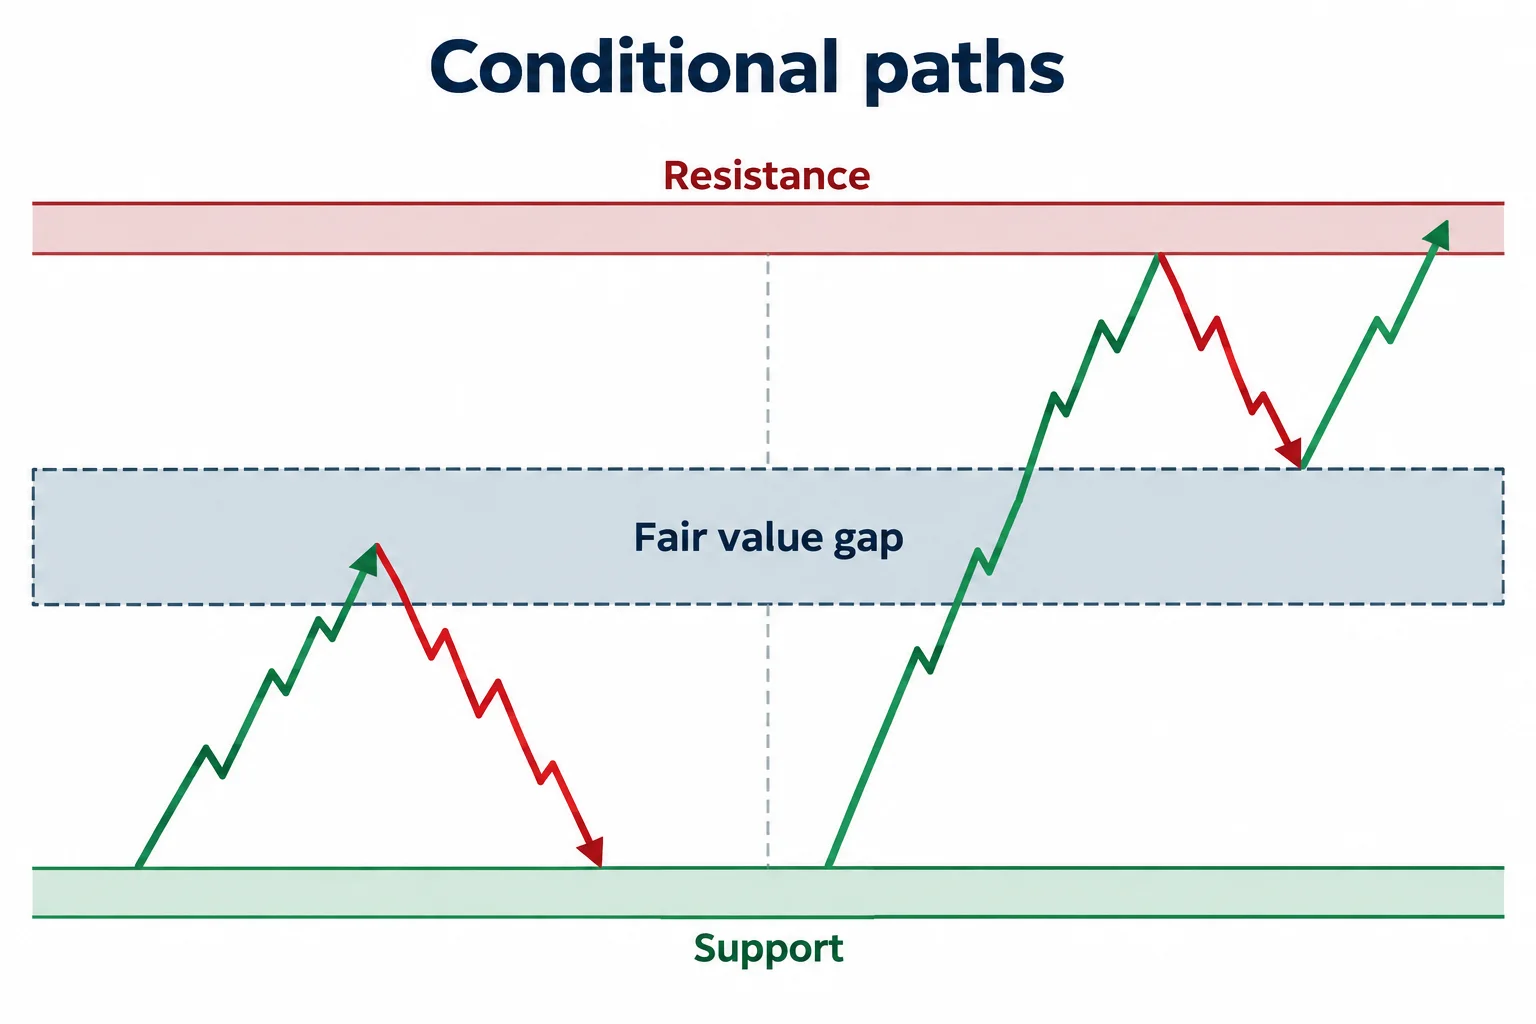
ICT opens with a weekly Dollar Index chart and identifies a fair value gap left by the previous week’s trading, the weekly candle he points to. At 0:26 he sets out two conditional readings rather than a prediction. If price trades into the area and rejects it, he would treat the gap as resistance. If price moves above it and then comes back down into it, he would expect it to act as support, with the rejection block and eventually the high and the midpoint of a wick becoming possible objectives (1:08).
On the daily view at 1:42, he notes that the same weekly gap does not look like an imbalance on daily candles at all, which is his reason for moving between time frames. He adds that price had traded down into an area he described in earlier commentaries and rallied up into the midpoint of a wick. The captions render that phrase inconsistently as “consequent encouragement”; in his terminology this is consequent encroachment, but the generated captions are unclear and the exact wording is not asserted here.
EUR/USD: marking the imbalance, and why he stayed intraday
Beginning at 2:40, ICT marks a weekly imbalance on EUR/USD and suggests viewers locate it themselves: put a rectangle on the daily chart from a low to a candle’s high, then switch to the weekly chart and the gap becomes obvious. That exercise, he says, is the point of leaving something for the viewer to investigate rather than placing every element on the chart for them.
He then raises context that is not chart-based, mentioning drought conditions affecting corn, wheat and soybeans and the possibility that grain prices rise while the dollar consolidates or falls, and referring to added uncertainty from war without naming a specific headline (3:41). These are his own contextual remarks; nothing in the transcript establishes that they caused any price move, and they are not a repeatable edge. He says that because of the uncertainty he preferred intraday sessions to longer-term positioning at that time.
On the lower-time-frame EUR/USD views he describes a sequence of a run above buy-side liquidity, a shift in market structure, an optimal trade entry and a further sell-off. At 6:09 he explains his use of “breakaway gap”: when an imbalance forms close to a swing high or low and price then drops aggressively, that energetic displacement is the signature he wants, and he does not want the gap filled. The captions obscure several abbreviations in this section, so the exact terms are checked against context rather than asserted from the caption spelling.
ES: opening range gaps and the five-day filter
The review shifts to E-mini S&P futures at 6:52. He compares the weekly ES structure with Nasdaq, noting that Nasdaq had already traded up into the equivalent volume-imbalance area while ES had not. That comparison is his retrospective reading of the charts on screen; the transcript alone cannot establish the boundaries of those areas.
One of the clearest teaching sections begins at 7:59. ICT defines an opening range gap as the separation between where the market settles in the New York session and where it opens the following day at 9:30 a.m. New York time. He distinguishes it from a liquidity void, which he describes as an area where there was no trading at all, and from a new day opening gap, and he shows price returning into the gap and reacting around it.
At 9:49 he states his rule for his own analysis: he does not like to carry opening range gaps beyond five days and treats them as having expired after that. He is explicit that this is a filter he uses rather than a property of markets, acknowledging that examples can be found where price respected an older gap beyond his limit. By contrast, he says new week opening gaps can be held and used for months. This is best understood as a discretionary bookkeeping rule, not a statistically validated expiration date; whether five days is useful would require independent testing.
Friday’s intraday ES session
Using five-minute and one-minute charts, ICT reconstructs Friday’s session around the opening range gap, its 50 percent level and a lower daily fair value gap. At 11:09 he describes price trading above the morning short-term high, returning to the 9:30 opening price, and then rallying toward buy-side liquidity and back into part of the opening gap. He says he was interested in that daily fair value gap and had posted about it before the session.
His stated bias for the day was bearish. He notes that the largest move of the session was the decline, and points out that it ran one tick beyond the level he had already published. He relates the lunch-period advance to buying side liquidity being taken before the later decline (12:42, 13:06). He frames the day around two windows he marks on his chart:
- Morning window: 10:00 to 11:00 a.m. New York time ({ts(963, “16:03”)}).
- Afternoon window: 2:00 to 3:00 p.m. New York time ({ts(1078, “17:58”)}).
At 16:03 he reviews the morning window and an imbalance he says could have served as an entry area within his model, while repeating that he understands why the move might look bullish to someone else: he says the day’s largest move is what made it bearish for him, and that he favored the lower end of the range. At 17:58 he walks through the afternoon sequence: a move above relative equal highs that trips buying side, bearish displacement, a retracement into an imbalance around the opening gap midpoint and an old swing low, and then movement toward the opening-range low and the daily fair value gap.
Near the end he reports the levels he was reading: a daily gap boundary he cites as 4381.75 and a printed level of 4381.50, described as one tick into the gap. Those figures are what he states aloud in the narration. Captions do not show fills or a statement, no personal execution or result is verified here, and the fact that he says the level was reached is not evidence that anyone traded it profitably.
General takeaways
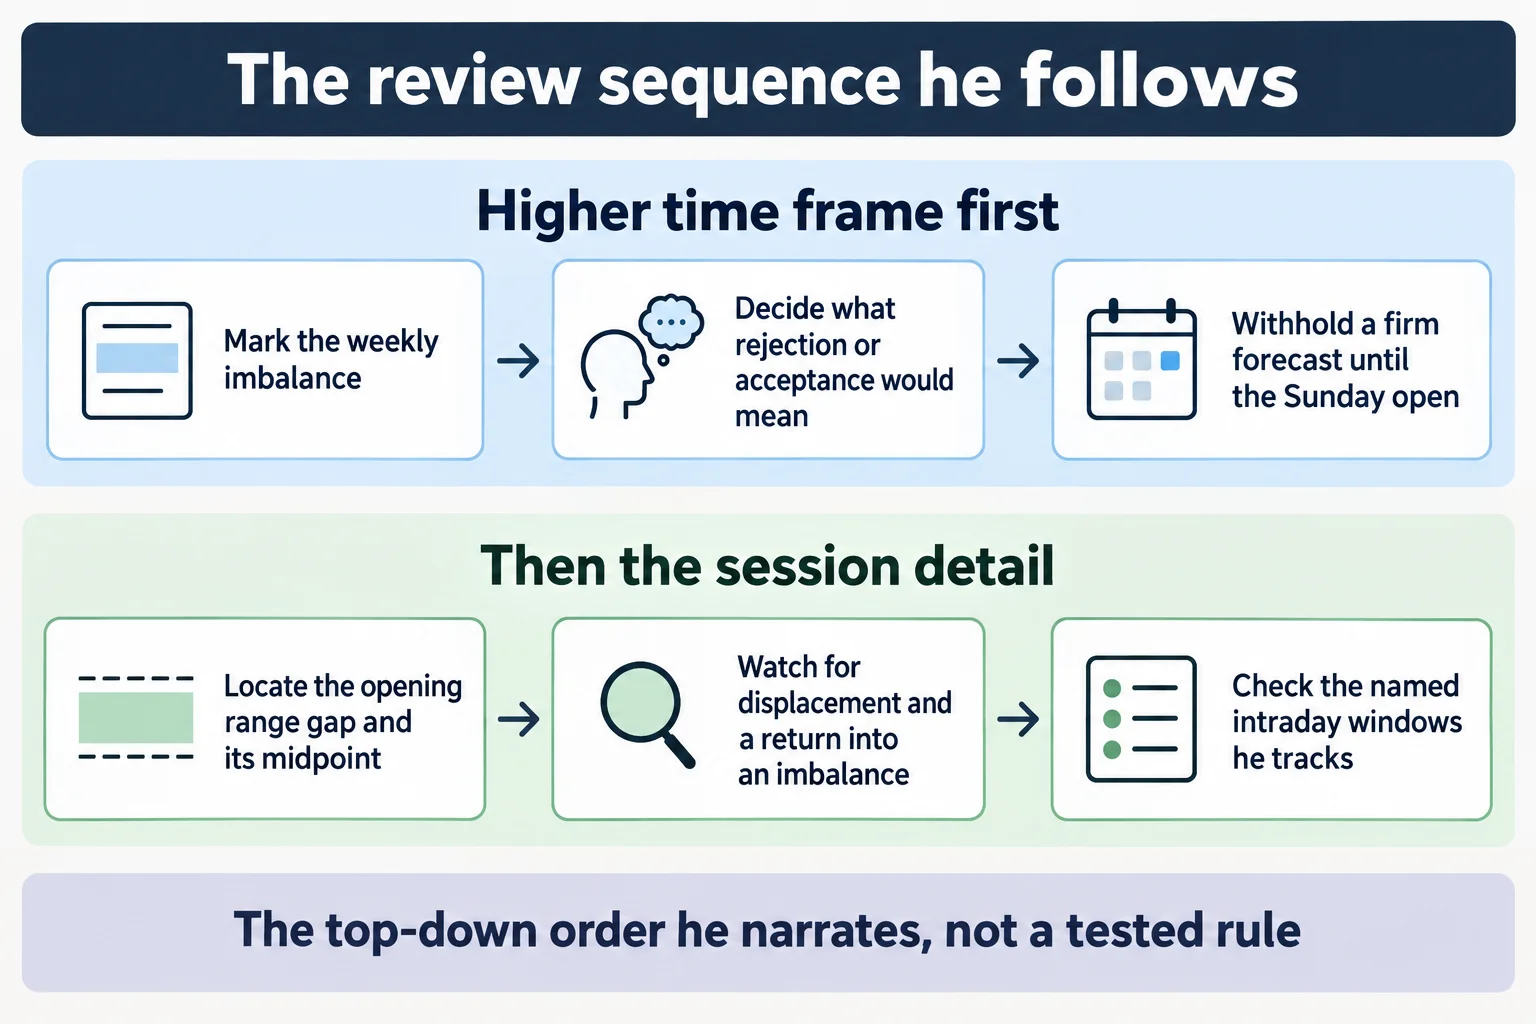
The session demonstrates a top-down process: identify higher-time-frame imbalances, form conditional scenarios rather than predictions, narrow the analysis to session-specific reference points, and then look for lower-time-frame displacement and a return into an imbalance. Just as importantly, he openly withholds conviction when conditions look uncertain. Whether the marked levels produce repeatable results is not something this or any single review can establish, and nothing here is investment advice.
Watch the original recording on YouTube
This video cannot be played inside another website. Its embedded player was loaded and clicked from a BestProps page on 15 September 2026 and reported “Video unavailable — Playback on other websites has been disabled by the video owner.”, staying on a “Watch on YouTube” prompt with no playback progress, while the public watch page plays normally. That is why there is no inline player here.
Watch ICT Mentorship 2023 – Market Review June 24, 2023 on YouTube ↗
The timestamp links above point at the passages being described. The chart annotations and levels are visible only in the recording, which is the sole source for everything said here about the session.
Resources
These are the sources checked for this article. The CFTC and Investor.gov pages are regulator background on futures, leverage and how evaluations of trading-system claims are presented. None of them assesses ICT, this recording or anything said in it, and no claim is made here about whether the method described works.
- [1] ICT Mentorship 2023 – Market Review June 24, 2023 – The Inner Circle Trader (primary source; watch page read 15 September 2026, 20M07S)
- [2] Investor.gov – Futures glossary (regulator description of futures contracts and leverage; read 15 September 2026)
- [3] CFTC – Commodity trading systems sold on the internet (advisory on how hypothetical and simulated results are presented; read 15 September 2026)
- [4] Investor.gov – Economic indicators glossary entry (context for scheduled releases that move index futures; read 15 September 2026)
This is independent educational commentary on one recorded review. It is not official ICT material, it is not a tested or backtested trading system, and it is not investment advice. The levels, bias and outcome discussed are the speaker’s own account of the session and are not independently verified here. Leveraged futures trading involves substantial risk and is not suitable for everyone.

