
Key takeaways
In ICT Mentorship 2023 – Advanced Theory On ICT Breaker, a recording published on 2 July 2023 that runs about 68 minutes, ICT argues that a breaker is not a break-and-retest pattern or a single candle shape, but a price array that engages resting orders across two liquidity pools (33:02, 33:55).
Read the full summary
In ICT Mentorship 2023 – Advanced Theory On ICT Breaker, a recording published on 2 July 2023 that runs about 68 minutes, ICT argues that a breaker is not a break-and-retest pattern or a single candle shape, but a price array that engages resting orders across two liquidity pools (33:02, 33:55). He shows a bearish version, where price runs a short-term high and then a more significant higher-timeframe buy-side pool before repricing lower, and a bullish mirror of it (40:00, 40:30). In both, he isolates the leg from the liquidity run to the reversal, calls it the A-to-B leg, and takes measured moves of that leg as targets, describing one standard deviation as the basic approach (37:39, 37:43). He then applies the bullish model to a 2 July 2023 five-minute ES chart and refines it on a one-minute chart (43:51, 54:54). Everything about the session, including the positions and scale-ins he describes, is his own account; the charts are only visible in the recording.
How we researched this article
BestProps used document-based research from primary firm sources, checked September 24, 2026. The complete source list, scope, limitations, and commercial-state record appear near the end of this article.
What this lesson covers
In ICT Mentorship 2023 – Advanced Theory On ICT Breaker, published on the The Inner Circle Trader channel on 2 July 2023, ICT reviews several markets before presenting an expanded interpretation of bearish and bullish breakers. His central point is that a breaker should not be reduced to a generic break-and-retest pattern. In his framework its meaning depends on directional bias, liquidity, time, displacement and the surrounding higher-timeframe narrative. He states plainly that the diagram he presents “is not a break and retest” (33:02).
The upload date and the session date agree: the watch page lists 2 July 2023 and he says in the recording that the current session is 2 July 2023 at a little after six in the morning New York time (43:51).
Market context before the breaker discussion
The session begins with the US Dollar Index and EUR/USD. At 0:36 he opens the Dollar Index on a weekly chart and describes an inefficient area between candles that price worked into but did not resolve. From 0:56 he calls the position in the middle of the weekly range indecisive, and says he prefers to sit still rather than impose a directional bias. He also notes that the 4 July holiday in the United States may affect volume, so he expects cleaner price action later in the week.
On EUR/USD he combines weekly inefficiencies, short-term premium and discount, liquidity above a recent high, and the time at which the high formed. At 6:11 he explicitly rejects a high-low-higher-high sequence that a viewer might label a breaker: he calls the intervening back-and-forth “time distortion” and says the algorithm refers to time first, not simply because price ran (6:47). He says the relevant candle is a specific down-close candle inside the later decline, and that the applicable session here is the New York open, which he names at 7:31.
Applying the idea to ES, and the SMT comparison
The review then moves to E-mini S&P futures. His interpretation was bullish because he believed the weekly chart pointed toward buy-side liquidity and a weekly volume imbalance above the market, which he identifies at 10:47. He uses daily and intraday fair value gaps, a bullish breaker and a comparison with Nasdaq to explain why he kept looking for higher prices.
At 13:13, he stresses that an intraday chart may not visibly show an inefficiency defined on the daily chart, and that the fix is to transpose higher-timeframe levels onto the lower-timeframe charts: otherwise, he says, “you’ll lose all the plot narrative and storyline behind why price should be reacting” at those levels.
He also discusses what he calls SMT divergence between ES and Nasdaq. From 18:08, he notes that ES made a lower low while Nasdaq did not, and calls it SMT divergence, which he associates with price trading higher. He is explicit about its role: SMT is “a qualifier” that gives “confirmation that order flow is probably not in the direction” of the lower low, and it is not something to “go long” on by itself (25:05, 25:19). He also notes that because Nasdaq had already run higher for weeks, the comparison supported a thesis he already held rather than selecting the instrument for him.
The bearish breaker model
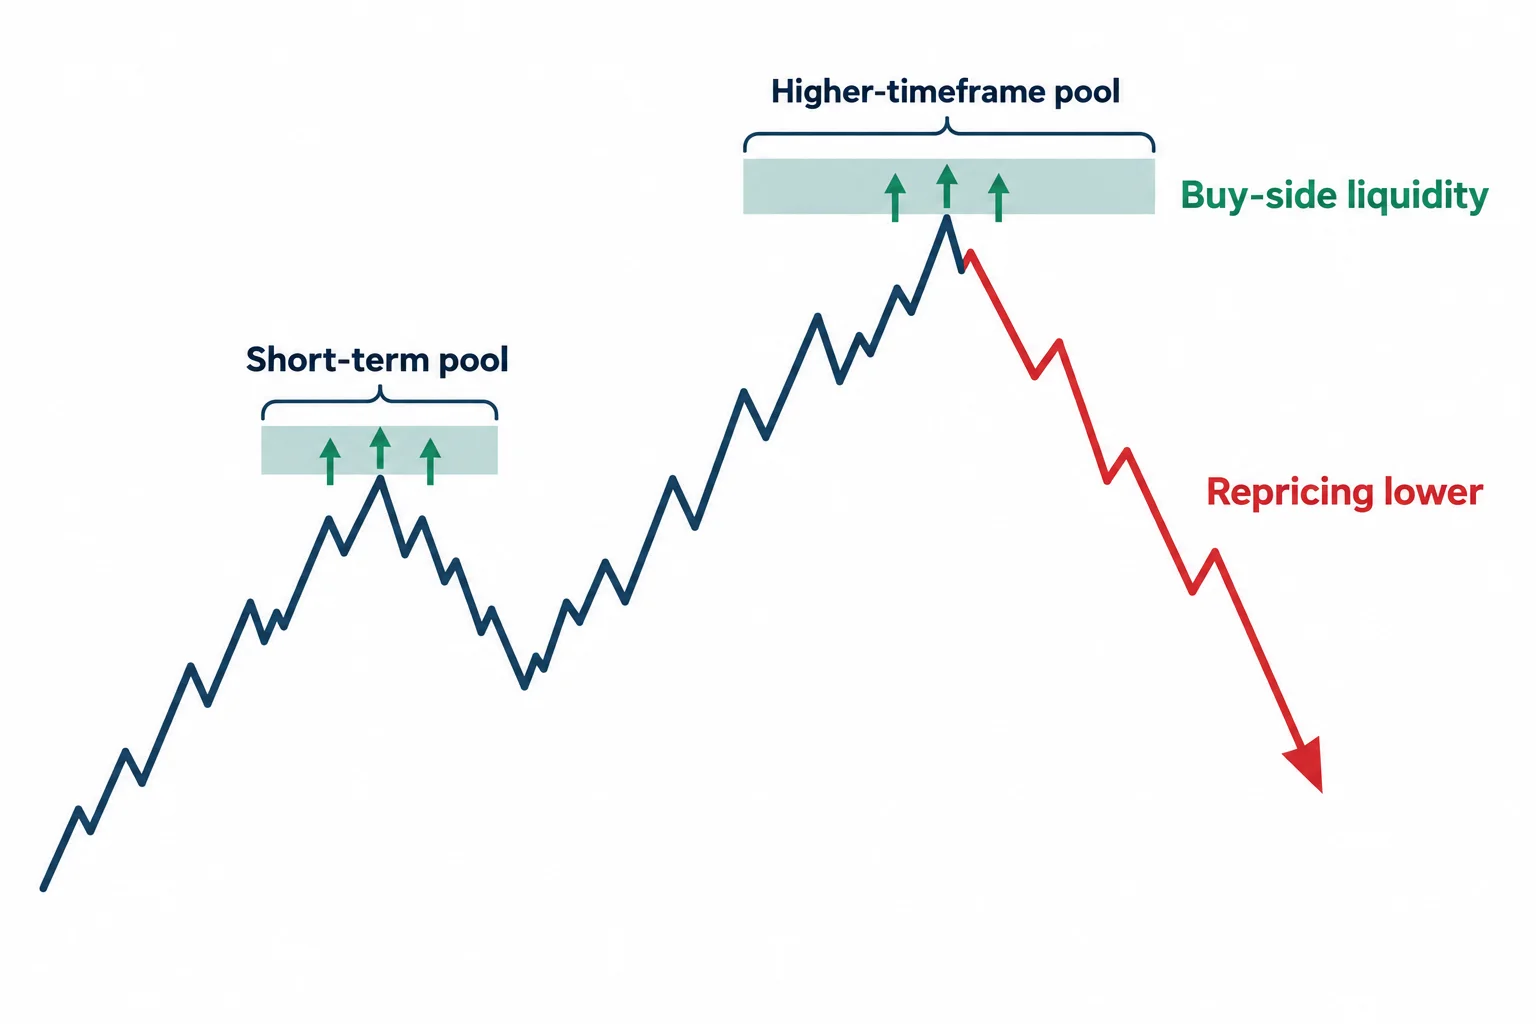
The dedicated breaker tutorial begins at 32:55. ICT introduces a bearish schematic and says it is a description of how runs on liquidity are followed by a repricing lower, not a candle pattern. He describes the pattern as one of the strongest of his PD arrays, and explains the reason in his own terms at 33:55: it “is acting on pending orders”, which is what he says capitalises on stops being taken before price runs in the opposite direction.
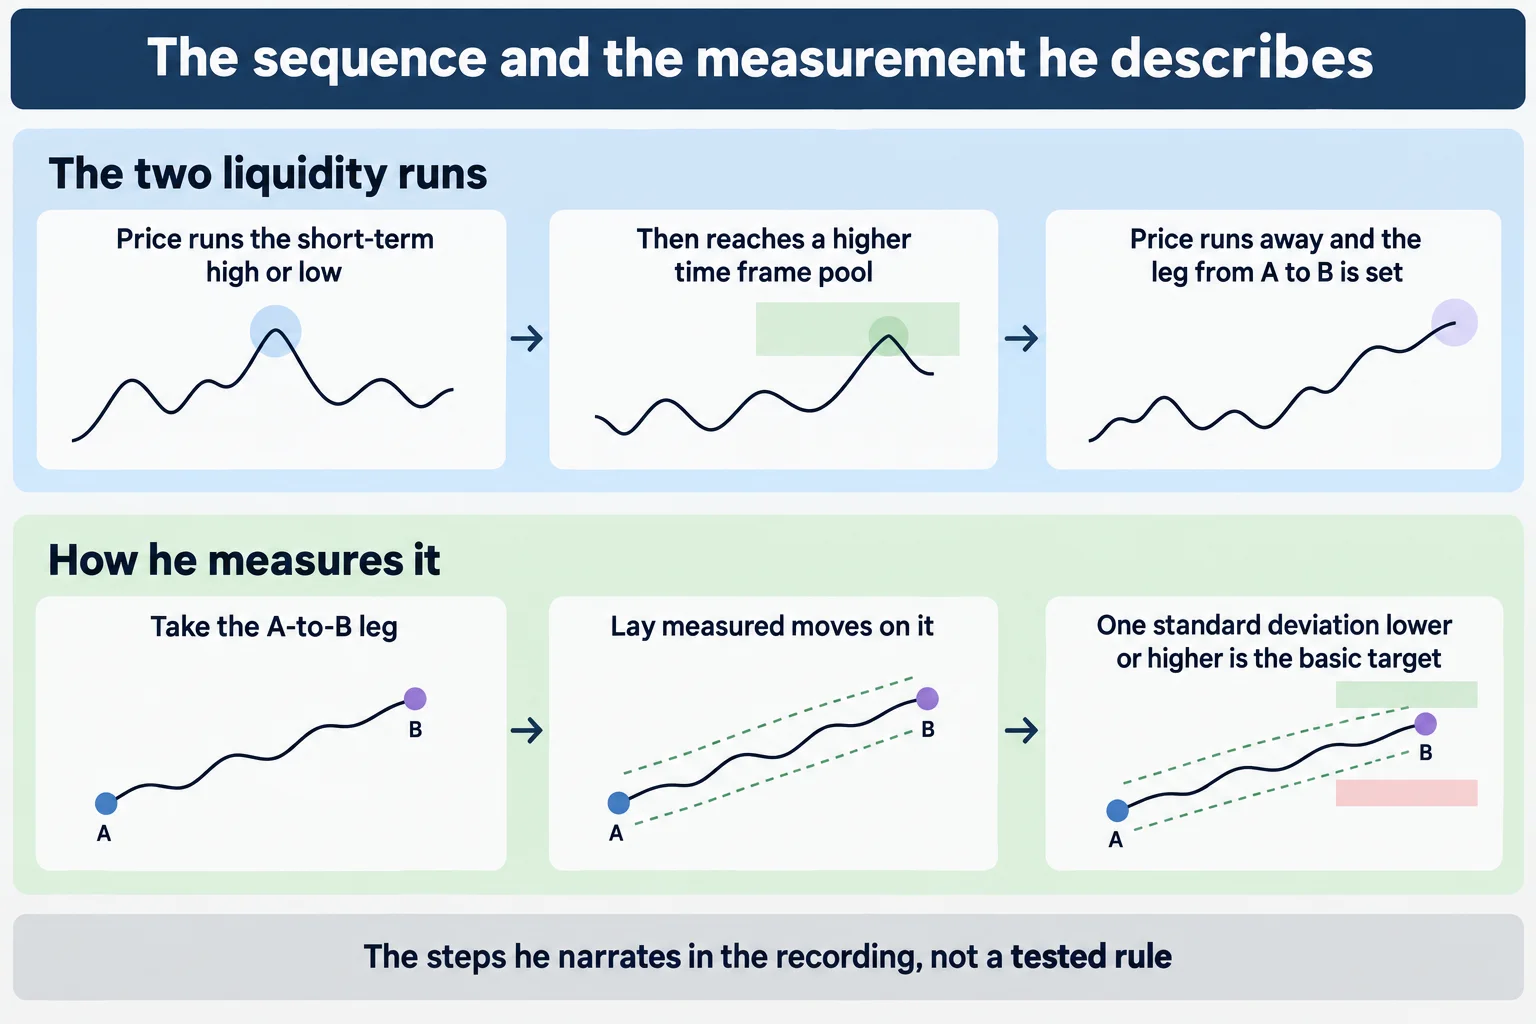
He describes the bearish sequence in two liquidity stages:
- First stage — the short-term pool. Price runs the short-term buy-side liquidity above a recent short-term high, which is where traders buying the breakout are said to be caught (34:15).
- Second stage — the higher-timeframe pool. Price then reaches into a larger buy-side pool, and the reversal occurs there. He says the “highest form of precision” comes from seeing both pools engaged.
- The measurement. Once price runs away from the second pool, he isolates the leg from the run to the reversal and calls it the A-to-B leg. He applies Fibonacci and standard deviations to it, and says one standard deviation lower is “the easiest bread and butter approach” to using the breaker (37:39, 37:43).
He separates the leg from the surrounding movement explicitly, calling the run from the low to the high the manipulation and telling the viewer to set it aside once it is done (35:33). He also distinguishes this from an earlier approach, saying it is not the “2022 model” and that the two use the price leg differently.
On position sizing he volunteers an example from his own trading in ES — one contract, then three, then six for what he calls a 10-lot position — while stating that he is not suggesting the viewer trade that way. That description is his own account of his execution and is not independently verified here.
The bullish breaker model
From 40:30, he reverses the schematic. In a bullish narrative, price first trades below a short-term low and then into a more significant higher-timeframe sell-side liquidity area, described as the best version of the setup: “the best breakers are going to see two levels of sell side”. The rally away creates the A-to-B leg used for upside projections.
He says a trader could wait for a conventional confirmation such as a later retracement after a short-term high is exceeded. Alternatively, someone already confident in the higher-timeframe thesis might look inside the displacement leg for a fair value gap, an inversion fair value gap or another entry model. The breaker therefore functions as a contextual price array rather than a single mandatory trigger, and he repeats that he is not teaching a break-and-retest approach (44:54).
The 2 July 2023 ES example and lower-timeframe refinement
From 43:51, ICT applies the bullish model to a five-minute ES chart for 2 July 2023, noting that New York time is a little after six in the morning. He identifies a low-high-lower-low sequence, treats the drop below the first low as a liquidity run, and measures the subsequent A-to-B leg for an upside projection. He adds that a trader who already understands where the market is likely to go can act inside that leg rather than waiting for the short-term high to be broken and retested.
At 54:54, he moves to a one-minute chart and refines the breaker to a smaller candle range. He divides that range into quarters, names the upper quarter and fifty-percent level, and calls the midpoint the mean threshold, then points to a down-close candle inside the breaker as the candle he would use (56:13, 56:23). He stresses that these levels are dynamic rather than fixed lines on a chart.
How he says the theory should be studied
The lesson’s main point is not to label every low-high-lower-low or high-low-higher-high sequence a breaker. His method asks the viewer to establish the expected higher-timeframe destination, identify liquidity on two scales, account for session timing, isolate the post-liquidity A-to-B leg, and only then use the breaker or its measured projections. In closing he returns to the same idea, saying the lesson is about understanding time first: what time of day the move occurs, and repricing against existing liquidity (66:12).
- Record the prior bias before looking for any breaker.
- Mark both proposed liquidity pools, the short-term one and the higher-timeframe one.
- Note the relevant session time, since he says time is referenced before price.
- Define the A and B points before measuring, so the projection is not fitted after the fact.
- Keep examples that fail as well as those that appear precise.
The recording itself provides no independent test of the theory, no complete chart data and nothing that would let a reader verify every execution claim. The positions, scale-ins and outcomes he describes are his own account of his session, not audited results, and this material is educational commentary rather than investment advice.
Watch the original recording on YouTube
This video cannot be played inside another website. Its embedded player was loaded and clicked from a BestProps page on 15 September 2026 and reported “Video unavailable — Playback on other websites has been disabled by the video owner.”, staying on a “Watch on YouTube” prompt with no playback progress, while the public watch page plays normally. That is why there is no inline player here.
Watch ICT Mentorship 2023 – Advanced Theory On ICT Breaker on YouTube ↗
The timestamp links above point at the passages being described. The charts, annotations and levels are visible only in the recording, which is the sole source for everything said here about the session.
Resources
These are the sources checked for this article. The CFTC and Investor.gov pages are regulator background on futures, leverage and how evaluations of trading-system claims are presented. None of them assesses ICT, this recording or anything said in it, and no claim is made here about whether the method described works.
- [1] ICT Mentorship 2023 – Advanced Theory On ICT Breaker – The Inner Circle Trader (primary source; watch page read 15 September 2026, 1H08M56S)
- [2] Investor.gov – Futures glossary (regulator description of futures contracts and leverage; read 15 September 2026)
- [3] CFTC – Commodity trading systems sold on the internet (advisory on how hypothetical and simulated results are presented; read 15 September 2026)
- [4] Investor.gov – Economic indicators glossary entry (context for scheduled releases that move index futures; read 15 September 2026)
This is independent educational commentary on one recorded session. It is not official ICT material, it is not a tested or backtested trading system, and it is not investment advice. The liquidity runs, positions and outcomes discussed are the speaker’s own account of the session and are not independently verified here. Leveraged futures trading involves substantial risk and is not suitable for everyone.
