
Key takeaways
ICT’s fourteen-minute January 31, 2023 session recap describes an unverified bullish intraday trade entered by phone before recording, using a market-maker buy model, a down-close candle order block and buy-side liquidity to target the New Week Opening Gap, defined as the zone between Friday’s close and Sunday evening’s first tick.
Read the full summary
ICT’s fourteen-minute January 31, 2023 session recap describes an unverified bullish intraday trade entered by phone before recording, using a market-maker buy model, a down-close candle order block and buy-side liquidity to target the New Week Opening Gap, defined as the zone between Friday’s close and Sunday evening’s first tick. He added five contracts, targeted the gap’s lower edge, midpoint and upper edge, and called the midpoint consequent encroachment, meaning the midpoint of any inefficiency. He said he removed 80% or 20 contracts at that midpoint, rolled the stop to lock in a spoken but unverified 2000, then peeled off single contracts above relative equal highs, moving from five remainder contracts to three before the final balance was stopped out. His framework treated the order block midpoint as the mean threshold, a one-minute fair value gap as potential support and a shaded area others might label a bearish breaker as merely a speed bump because the directional narrative remained bullish. Risk management was tightened because FOMC was scheduled for the next day. The entry, fills, account, profit amount and executions are not independently verified, captions garble some figures, and the retrospective example provides no sample size, win rate, trading costs or evidence of a tested system.
How we researched this article
BestProps used document-based research from primary firm sources, checked September 24, 2026. The complete source list, scope, limitations, and commercial-state record appear near the end of this article.
This is a retrospective explanation of his stated framework and of how he managed one position, not a tested system. He says at the outset that he could not reach his office in time to record the entry and opened the trade on his phone (0:03), so the recording documents his commentary and later management rather than the original entry. The captions are automatic and garble several terms and figures, which are flagged below where they matter.
ICT Session Bullish Premise
He describes the trade as based on an order block and on what he calls a market-maker buy model, with the expected path running up through buy-side liquidity and into the New Week Opening Gap (0:16). He adds that he had posted the same idea on Twitter that morning (0:23), and later says that without following that commentary the move will not make sense to a viewer (0:23, 2:45).
The methodological point he makes early is about labels. A shaded area on his chart could, he says, be read by traders applying what he calls a rip-off version of smart-money concepts as a sell signal, and would be called a bearish breaker by some. He rejects both readings: it is not a breaker, it is “just a speed bump”, and price is being drawn to the buy-side liquidity above it (0:32, 0:51). He returns to this at length near the end, arguing that without the narrative a shaded pink area would be mistaken for a bearish breaker, and that applying his vocabulary without understanding it harms people (7:45, 7:58).
He marks a recent down-close candle as an order block and notes its midpoint, which he calls the mean threshold, saying a retracement to that midpoint would not be a problem for the idea (1:29). At 1:47 he says he added five more contracts, and at 1:58 that he expects a quick move to take out the high of the day. He then says he knows he is on the right side (correcting himself to “most likely right”) and expects aggressive trade up into the shaded gap (2:20).
New Week Opening Gap Definition
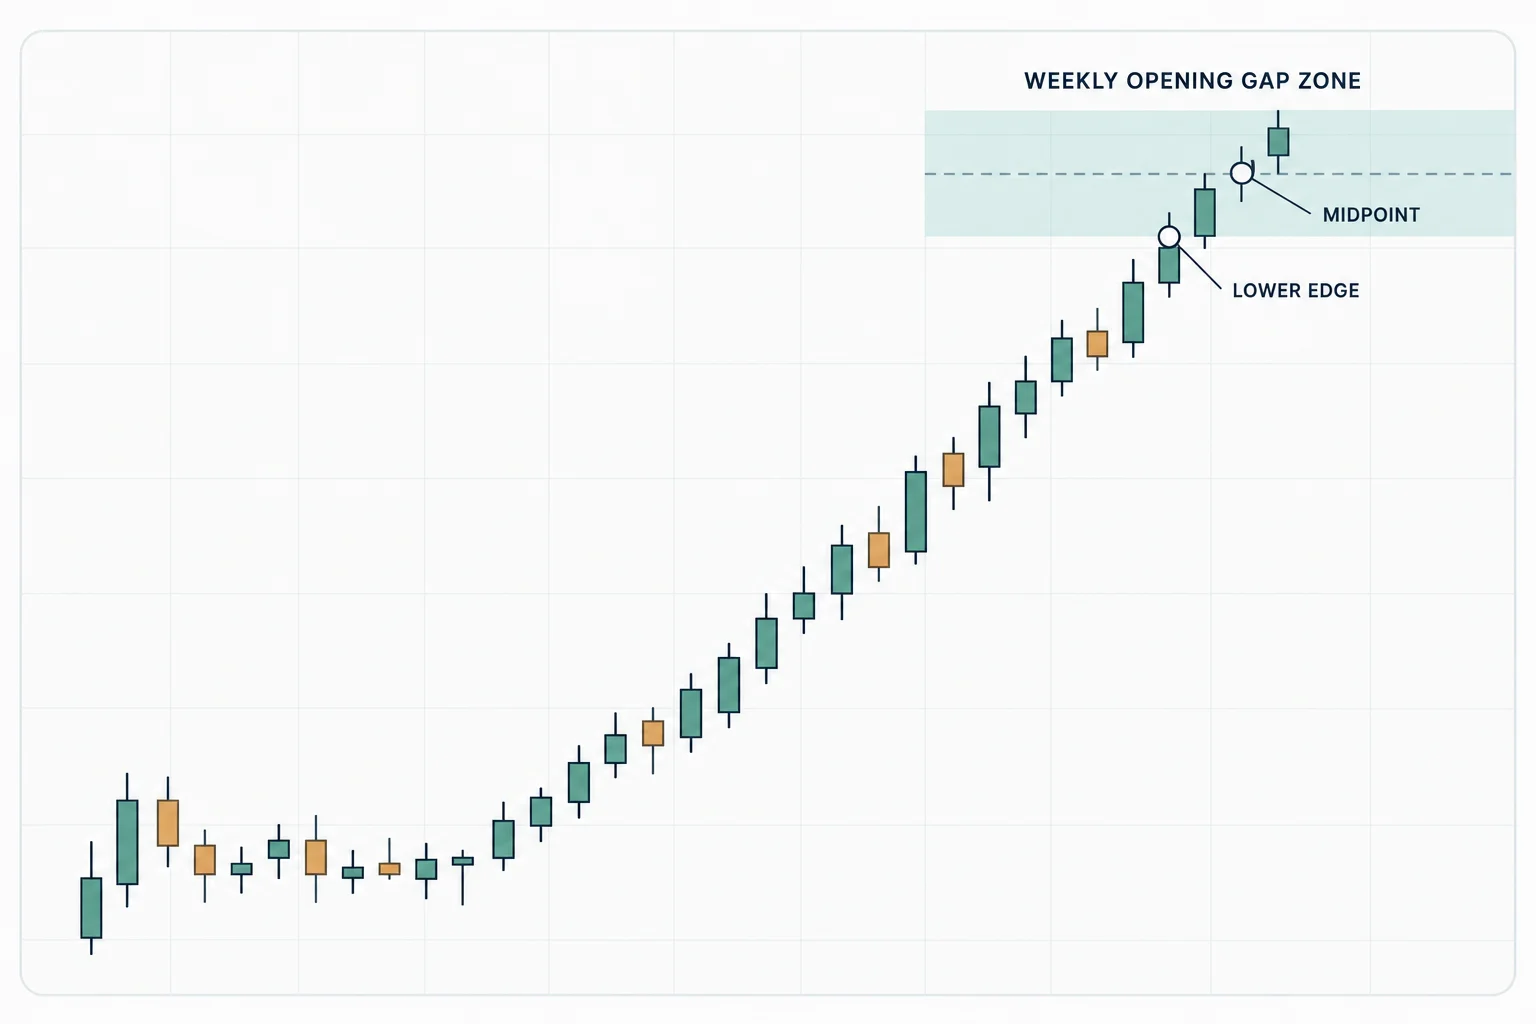
His definition is specific: the gap is created by the difference between Friday’s close and the opening price (the very first tick) when trading reopens on Sunday evening (4:00). He treats it as a zone rather than a line, referring separately to its low end, its midpoint and its top end.
He names the low end of that zone at 3:54. The captions carry the figure as “ 76.75”, which reads as a spoken price with the first digit doubled or dropped by the transcriber; the instrument and the exact level cannot be confirmed from the transcript, and no attempt is made here to reconstruct it. The substantive point is that his first stated objective was the lower edge of the gap, after which his attention shifts to the midpoint and eventually to the top of the zone (5:30).
ICT Session Liquidity and Fair Value Gap
At 3:42 he says price reacted off the order block as he had described and ripped into buy-side liquidity, which he reads as everything going to plan. He allows for a pullback at that point and notes a small fair value gap forming on the one-minute chart (4:25), then says he would want to see a drop into that gap, an immediate rejection of it, and a move higher (7:17). He reports that price reached the gap at 7:09.
He sets out his own sequence directly: a short-term high broken to the upside, a buy inside the first down-close candle that he annotates as an order block, buy-side liquidity and the gap’s lower edge as the initial targets, the fair value gap watched for support, and consequent encroachment with the upper part of the gap as later references (6:17).
His definition of consequent encroachment is the midpoint of a gap or any inefficiency, which he abbreviates as capital C, period, capital E, period in his annotations (8:21, 8:31). He then describes the reaction out of that level as a fast, expansive candle (8:39).
ICT Session Position Management
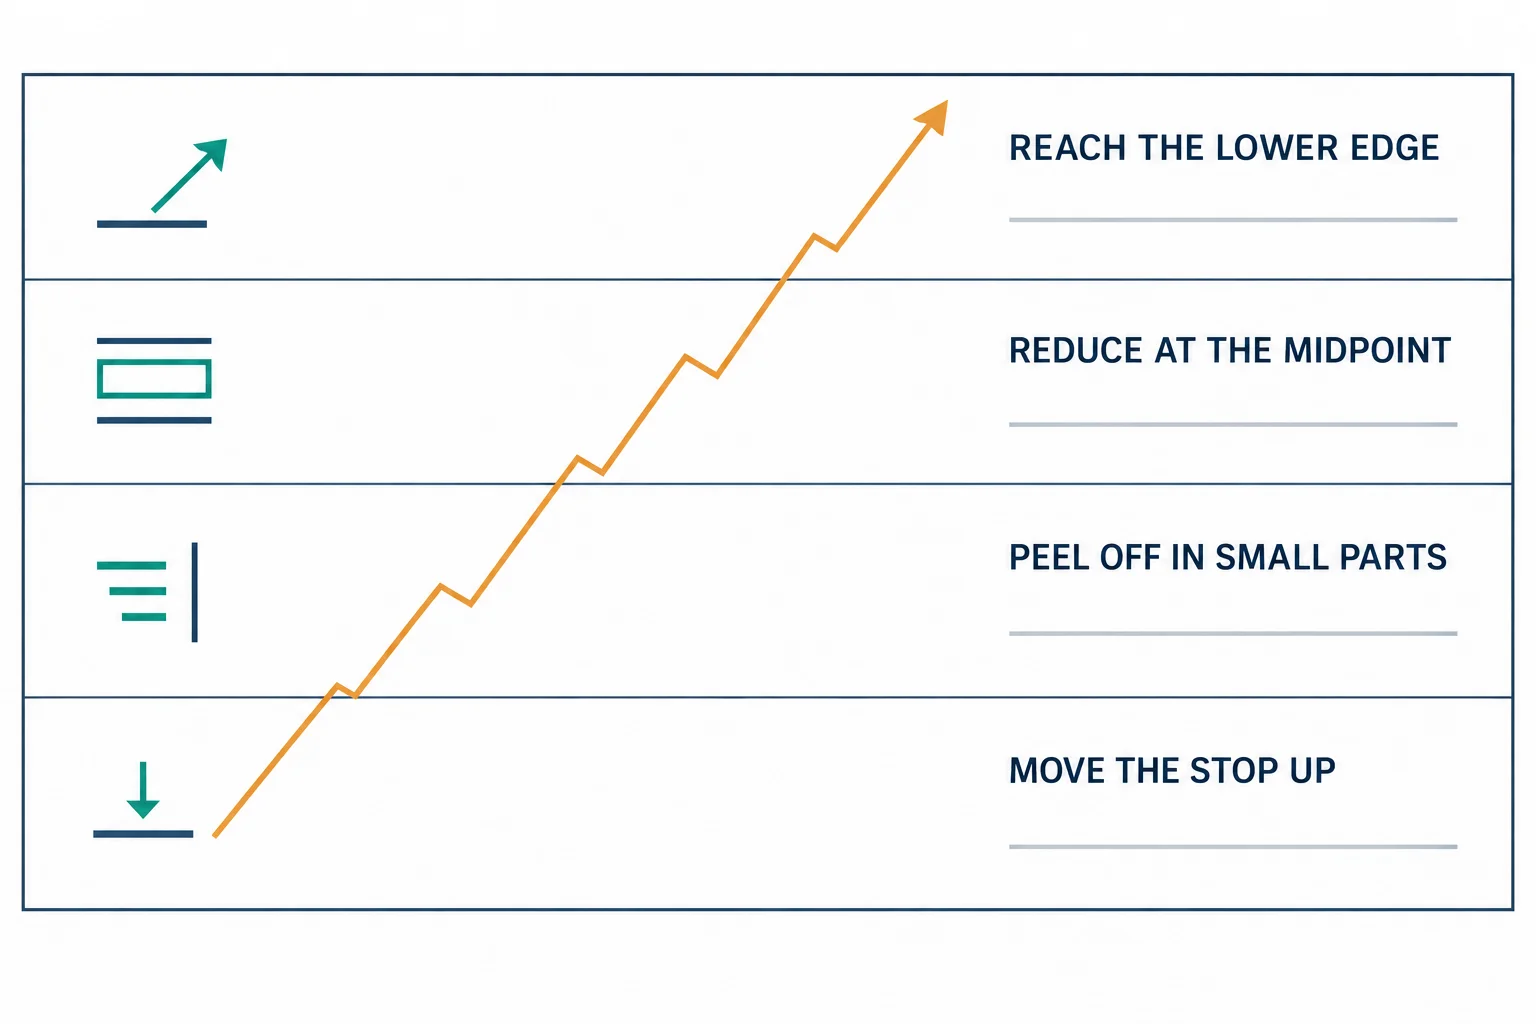
Position management occupies most of the second half. He says that at the level he is measuring (which he identifies as consequent encroachment) he will take 80% of the position off, and he puts that at 20 contracts; he is explicit that all his attention is on that level rather than elsewhere (4:45, 4:53). He says he is waiting to peel those contracts off the moment price touches the level (8:52).
Once that is done he reports rolling the stop up. The captions render the amount he says he is locking in as “lock in 2000” at 9:10; the currency, the contract multiplier and whether that refers to dollars of profit or to price levels are not established by the transcript, so the figure is reported as spoken rather than interpreted. He then says he wants to see support hold within the lower quarter of the zone without losing it entirely, and describes the stop as deliberately close, saying he does not care, because the following day is FOMC and price can do anything, including keep going (9:29, 9:44). That is his stated risk reasoning; the recording does not establish what the event actually did to the position.
From there he switches to single contracts and works the remainder into the upper half of the gap (10:09). He watches relative equal highs on the one-minute chart and takes one contract off each time a candle prints just above them (10:50), a habit he calls running down equity (taking partials into a move that has already been delivering rather than holding the whole remainder for one final target) (11:05). He describes starting with five contracts to peel (11:30) and later having three remaining (13:00).
He is candid about one lapse: at 12:05 he says he looked away from the monitor, realised he had missed an opportunity to reduce, and had to wait for the next higher high, while repeating that he is confident price will reach the top of the gap (12:20). He marks a halfway level between current price and the top of the shaded zone as his next reduction point (12:42), says he will roll the stop on the final balance (13:25), and at 13:47 says the stop was hit and that he is fine with it. He closes by saying he will show the executions and notes that they are not on a market replay (13:52), which is his assertion about his own screen; the captures of any such executions are not part of this transcript.
ICT Session Lessons and Limits
The transferable part is the method of reasoning, not the outcome. He fixes a directional premise first, names the liquidity and the weekly gap as destinations, treats a shaded area as an obstacle rather than a reversal signal because the narrative points the other way, and adapts his objectives as the gap is filled, lower edge first, then midpoint, then the upper half. He also reduces the position in stages rather than all at once, and says so explicitly about why: a scheduled FOMC release the next day makes the risk of giving the move back unattractive.
What the recording does not supply is equally important. The entry happened before recording began, so no fill is shown. The contract counts, the “%” reduction, the amount described as locked in and the final result are all spoken by the person managing the position, on charts he had already annotated, with the outcome known. There is no sample of similar trades, no win rate and no costed result, and the price levels that the captions garble are not repaired here by guessing. A viewer can study the sequence of decisions; that is a different thing from evidence that the sequence works.
Watch the ICT Session Recording
Watch the original lesson on YouTube
This recording cannot be played inside another website. Its embedded player was loaded from a BestProps origin and driven on 15 September 2026: it returned error 150 and reported the video as not playable, with no duration, and the upload’s own watch-page data for the same video reports that it is not playable in an embed. The recording itself is public and available (it is the embedding that is unavailable), so no iframe is left here and the direct link is given instead.
Watch January 31, 2023 PM Session Example \ New Week Opening Gap on YouTube ↗
ICT Session Sources and Further Reading
- [1] January 31, 2023 PM Session Example \ New Week Opening Gap the primary source and the only recording used for this article. Uploaded 31 January 2023 by The Inner Circle Trader; watch page read 15 September 2026. Use the timestamp links above to compare each step with what he actually said.
- [2] CME Group: E-mini S&P 500 Futures Contract Specs. The exchange specification for a contract of the kind used in the examples here. It defines the tick and multiplier that turn a stated point move or contract count into money; the recording never makes that conversion, which is why the figures above are left as he spoke them.
- [3] CFTC: Fraud Advisory: Commodity Trading Systems Sold on the Internet. US regulator guidance on hypothetical or retrospectively presented results and on the execution and cost assumptions such claims tend to omit. A general reference for reading a narrated trade recap like this one; it does not assess ICT, this session or any figure here.
- [4] CFTC Learn & Protect: Forex Frauds. Describes common patterns in trading promotions and states that two out of three retail foreign exchange traders lose money each quarter. Included as general context on promotional trading claims; it is not a comment on this recordist or his results.
BestProps is not affiliated with the CME Group, the CFTC or the Inner Circle Trader, and no source listed here endorses this article or any setup. Market-maker buy model, order block, mean threshold, breakaway gap, consequent encroachment and New Week Opening Gap are used as descriptive terms for what the recording teaches. The contract counts, the reduction percentages, the amount described as locked in, the price levels and the account of how the position ended are the speaker’s own narration over his own charts and are not verified here. This is independent educational commentary: it is not official ICT material, not a tested trading system and not investment advice. Index futures trading with leverage involves substantial risk and is not suitable for everyone.
