
Key takeaways
ICT’s 7 minutes 44 seconds YouTube forex review reads the 9 January 2023 Dollar Index as bearish and EUR/USD as bullish, moving from daily to hourly, 15-minute and five-minute charts.
Read the full summary
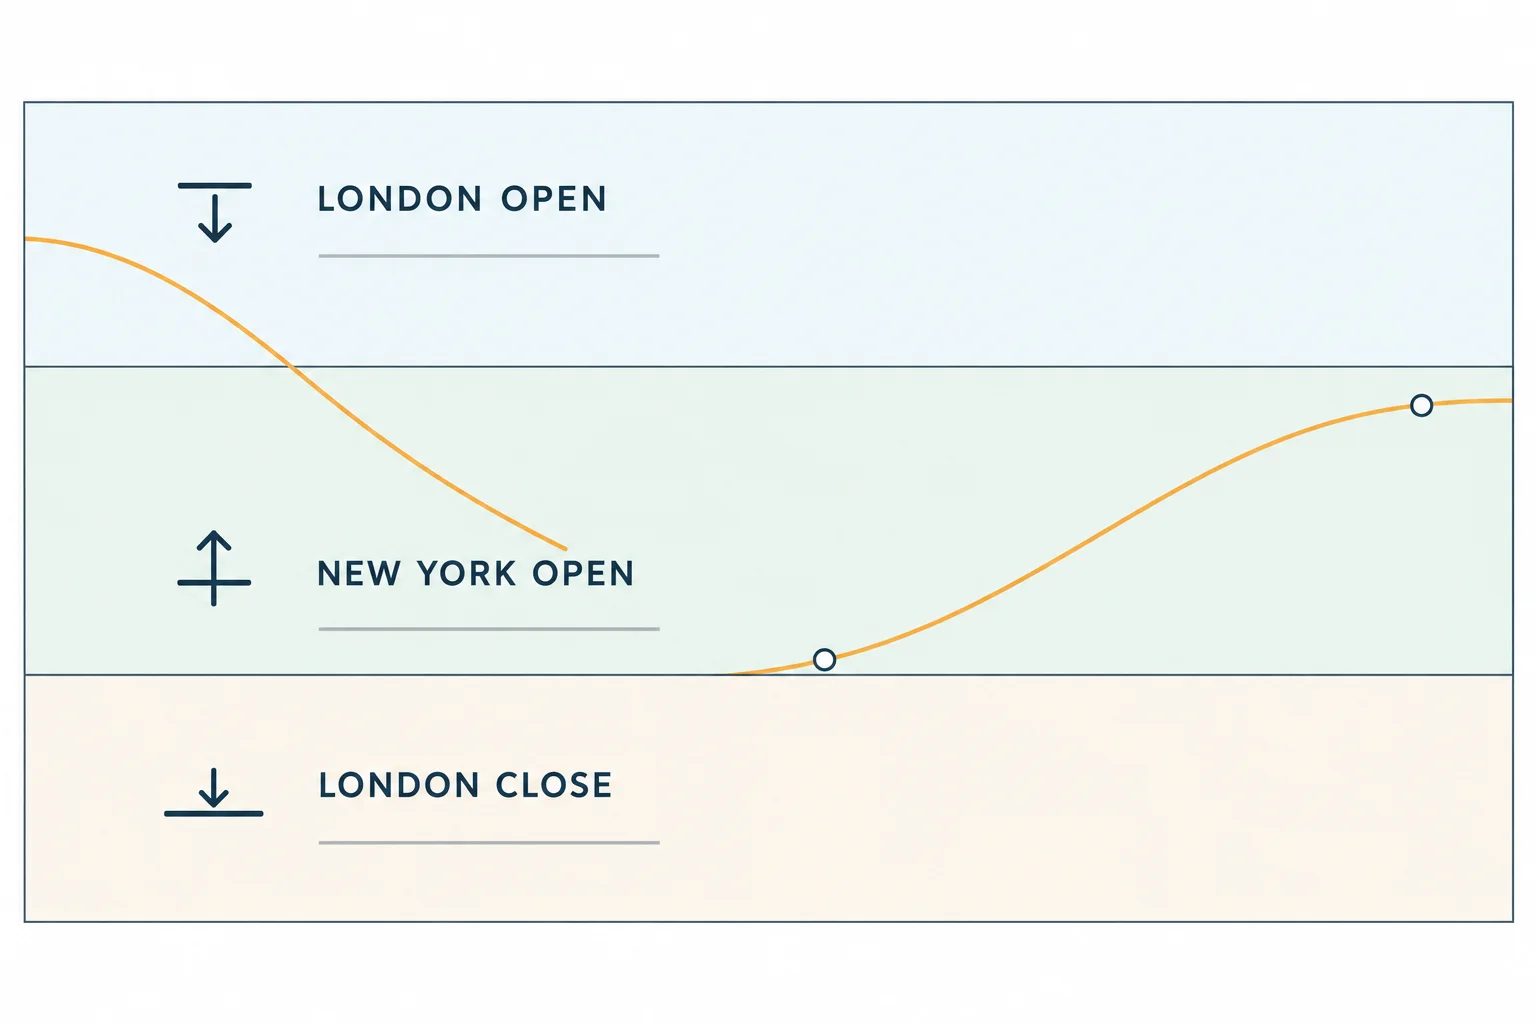
ICT’s 7 minutes 44 seconds YouTube forex review reads the 9 January 2023 Dollar Index as bearish and EUR/USD as bullish, moving from daily to hourly, 15-minute and five-minute charts. The Dollar Index framework targets old relatively equal lows, daily sell-side liquidity and a fair value gap after a New York open decline, short-term market structure shift and stop above the session high. ICT organizes the session around the London open from 2 a.m. to 5 a.m., New York open kill zone from 7 a.m. to 9 a.m., and London close from 10 a.m. to noon New York time, where he expects the opposite end of a trending day’s range to form. EUR/USD takes London sell-side liquidity, establishes a London-window low and continues higher through New York into buy-side liquidity. His homework anchors Fibonacci between the identified low and high only after price clears the swing high, then tests standard projections at 1, 1.5, 2.5, 3 and 3.5 or beyond until closing prices align with a kill-zone time window. The captions provide no prices, orders or verified results, include a January versus September date ambiguity, and document only ICT’s retrospective interpretation rather than evidence of a repeatable trading edge.
How we researched this article
BestProps used document-based research from primary firm sources, checked September 24, 2026. The complete source list, scope, limitations, and commercial-state record appear near the end of this article.
This article is a source-grounded reading of ICT Forex Review January 09, 2023, built from the recording's timestamped English captions. The video's own watch page gives a publication time of 9 January 2023, 4:02 p.m. Pacific, and a running length of 7 minutes 44 seconds. It is a short chart review, a retrospective explanation of one trader's interpretation, not evidence that the concepts it applies produce a repeatable edge.
ICT Forex Dollar Index Daily Framework
He opens on the daily Dollar Index chart and says the levels he is using were shared on Twitter beforehand (0:04, 0:10, 0:12). He describes price trading down into the sell-side liquidity and into a daily fair value gap, which he characterises in his own terms as a buy-side imbalance sitting outside an efficiency (0:20, 0:23, 0:27). His point is that everything lower in the review hangs off this daily logic (0:33).
On the hourly chart he points to an opening price on a candle that the captions render as “the 9th of September 2023” (0:39, 0:41). That month does not match the title or the video’s own watch-page date of 9 January 2023. The transcript alone cannot settle whether he misspoke or the transcriber misheard, so the sequence is described as spoken and the exact session date is left to the recording’s chart rather than asserted.
His stated intraday expectation is that the market opens, rallies, and then sells off down into the daily fair value gap (0:52, 0:55). That is the shape he is looking for, and it is conditional on the bearish Dollar Index read holding.
ICT Forex January 2023 Session Windows
Switching to the 15-minute chart he marks buy-side and sell-side liquidity taken during the London session, then the midnight opening candle and its opening price (1:03, 1:06, 1:10). His framing: if the Dollar Index is bearish, price should look for lower prices; if it rallies, it will take out buy-side liquidity or trade into an inefficiency in the form of what the captions render as SIBI or fair value gap (1:12, 1:20, 1:25).
He then walks the sequence he says the session delivered: price traded above and took buy-side liquidity, attacked the sell-side liquidity at the New York open kill zone, which he places at 7:00 to 9:00 a.m. New York local time, and left a clean imbalance outside of balance (1:29, 1:34, 1:43). He identifies a line he had drawn as the old daily relatively equal low, and notes that the retracement did not come back up to it or to the equal lows, which is why he treats it as a reference rather than support and resistance (1:49, 1:55, 2:01).
The path he describes from there: a bounce off the buy-side inefficiency, a trade up to consequent encroachment (which he defines as the midpoint of that gap), a failure to return to the old daily and equal lows, then a sell-off into the daily fair value gap, with the session closing on the low of the day right at the noon London close kill zone (2:09, 2:12, 2:16, 2:33, 2:37). He attributes the turn to the algorithm kicking in at that point in time; that attribution is his model, not something the captions establish.
ICT Forex Five-Minute Model for January 2023
On the five-minute chart he shows the New York open kill zone starting the day, a break down, and a short-term shift in market structure from high to low, which he calls the model from his 2022 mentorship material rather than anything new in this recording (2:40, 2:45, 2:49, 2:53). He describes the stop as sitting above that high, and then price running to the equal lows, the daily sell-side liquidity pool, and the fair value gap below, with the turn again placed at noon (3:02, 3:04, 3:06, 3:12) and says the turn played out as he teaches it in his core content and on this channel (3:12, 3:14).
ICT Forex EUR/USD Daily Levels and New York Continuation
On EUR/USD he says the levels shown are the ones he gave on Twitter, and notes that following along there matters because otherwise the videos seem disjointed (3:19, 3:22, 3:26). The daily references he points to are a buy-side level, an old high further back, and a fair value gap, with price having traded up into the gap, consolidated intraday, and rallied into the buy-side coded pool (3:31, 3:34, 3:38, 3:43, 3:46).
On the hourly chart he marks an order block on the 8th, with price dropping into it, rallying away, and then consolidating before the down-close candle he uses as the opening-price reference (3:51, 3:54, 3:56, 3:59, 4:09, 4:11). On the 15-minute he points out a sell-side coded pool and makes an observation about selection that is worth separating from the analysis: he says either of two nearby levels would be correct, but he prefers the one his eye lands on, the area where candles come closest to being equal at the highs or lows (4:21, 4:22, 4:25, 4:29). That is a stated personal preference, not a rule the transcript tests.
His EUR/USD sequence is then a drop into the London open, a rally that takes out buy-side liquidity, expansion, a small retracement and a rally creating the high (4:44, 4:47, 4:49, 4:51). On the five-minute he names the London open kill zone as 2:00 to 5:00 a.m. New York local time, shows sell-side liquidity taken and a rally into 7:00 a.m., and describes the two rectangles as the London-open setup and the New York completion of the day’s range (4:59, 5:02, 5:07, 5:11, 5:22).
He generalises it as a daily-range rule: on a trending day the day’s high or low should be forming in one window and the opposite end of the range between 10:00 a.m. and noon New York local time (5:29, 5:33, 5:35, 5:37). With the Dollar Index bearish he pairs a bullish EUR/USD: the low from the London window, an alignment of balance, a trade down into it with a bullish order block, a retracement back into the order block, and then a ramp through buy-side liquidity (5:42, 5:44, 5:48, 5:53, 5:56, 5:59, 6:01).
ICT Forex Fibonacci Projection for January 2023
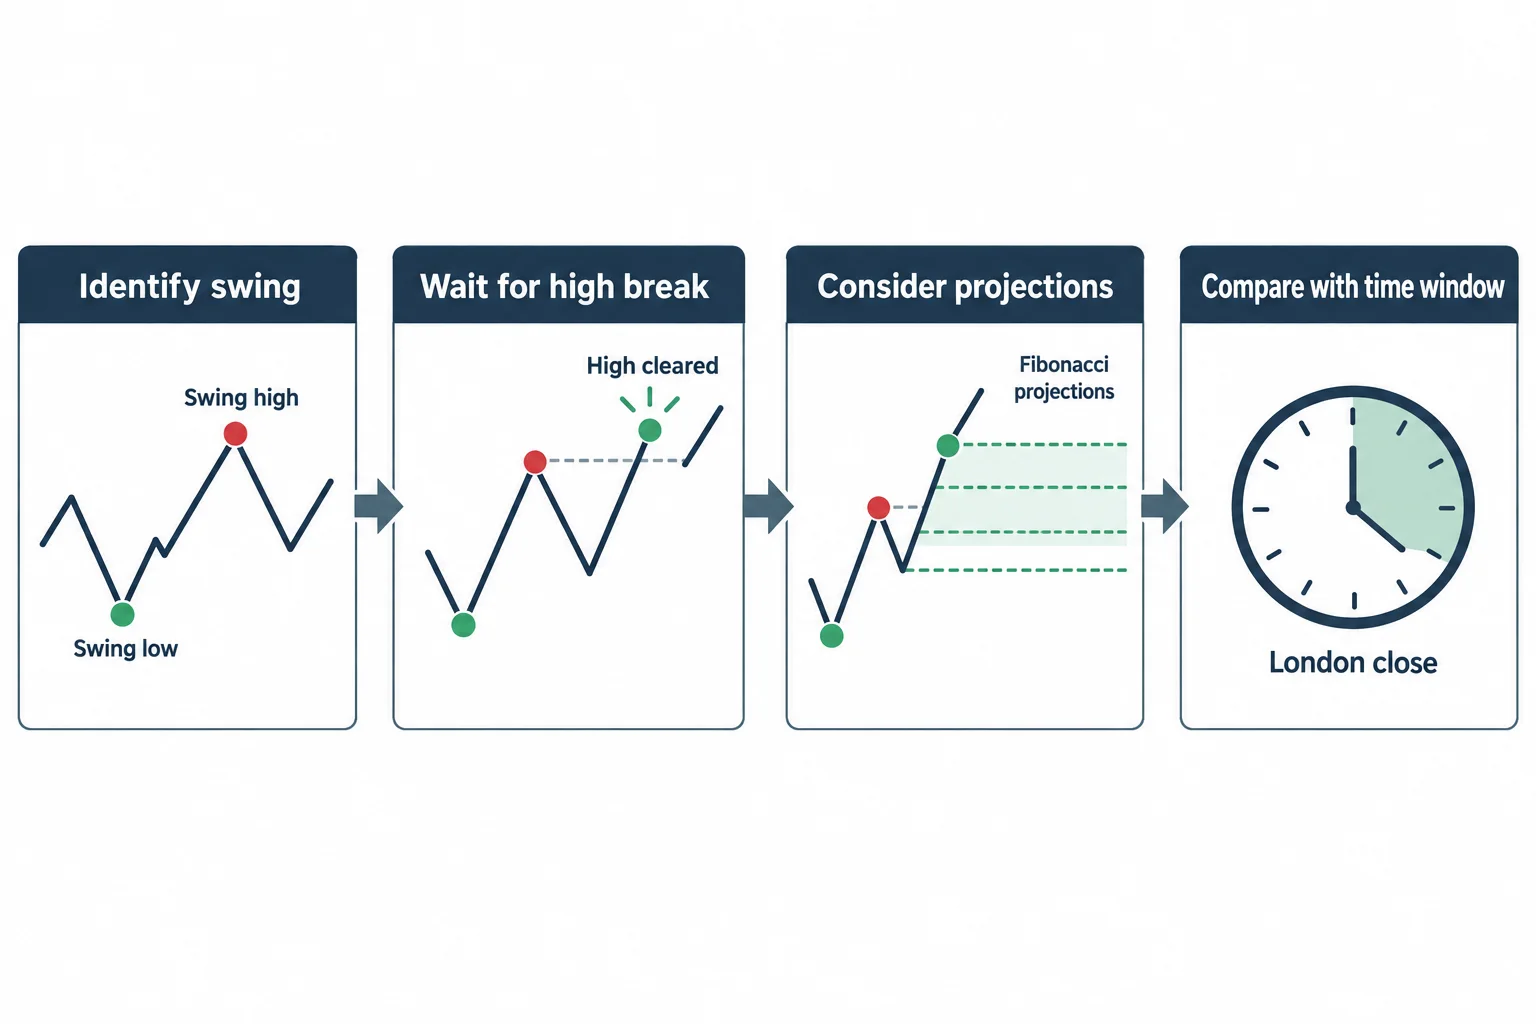
He marks a low and a high and says that if a reader anchors a Fibonacci to that low and high with a 1.5 standard deviation setting, the projections land on the closing prices in the London-close window, closing prices rather than wicks (6:06, 6:10, 6:14, 6:27, 6:31). He describes the two constraints he combines: time, being the London close and the 10:00 a.m. to noon window, and price, being the fulcrum point price has to run through (6:35, 6:37, 6:41).
Crucially, he states the condition: whether price goes up there is not known until it takes out that high, and only then does it make sense to work standard projections at 1, 1.5, 2.5, 3, 3.5 and beyond until one meets a time window such as the kill zone (6:43, 6:46, 6:49, 6:53, 7:00, 7:04). He sets the closing-price and opening-price anchor as homework and says the projections will take a reader up into that level (7:17, 7:19, 7:24, 7:26). No number for the resulting level is given in the recording, so none is stated here.
ICT Forex Review Takeaways for January 2023
- Set the daily context first (liquidity and imbalance on the higher timeframe) and let the intraday review depend on it rather than starting from the five-minute chart.
- Pair price with time. The windows he names (London open 2:00–:00 a.m., New York open 7:00–:00 a.m., London close, and 10:00–noon for the opposite end of the range) do the organising work in this review.
- Treat a lower-time-frame structure shift as a conditional confirmation inside a larger premise, not as a standalone signal.
- Keep correlated markets aligned: his bearish Dollar Index read is paired with a bullish EUR/USD read, and the two are meant to be read together.
- Treat projection levels as conditional on price clearing the swing that validates them, exactly as he states before extending the sequence.
Two limits are worth stating. First, the captions record what was said and when; they contain no prices, order tickets or results, so none of the described outcomes can be checked from the transcript, and the chart markings a reader would need are not visible in it. Second, this is a single short review. The equal-low selection point in particular is presented as his own eye and preference rather than a tested rule, and nothing here establishes that the framework holds up across sessions.
Watch the January 2023 ICT Forex Recording
The source is the auto-generated English caption track of the recording, 206 timestamped segments covering the full 7-minute 44-second runtime. Those captions garble a number of terms of art and spoken figures (the sell-side inefficiency or imbalance appears as “South Dakota”, “city” and “sibi”, “relatively equal” appears as “relatively cool” and “irelia”, “forex” appears as “4X”, and the session month is given once as September rather than January), so terms have been normalised only where the surrounding sentences make them unambiguous, and the captions' own wording is quoted where the ambiguity is material.
Watch the original lesson on YouTube
This recording cannot be played inside another website. Its embedded player was loaded from a BestProps origin and clicked on 15 September 2026: it reported “Video unavailable” and “Playback on other websites has been disabled by the video owner”, with no duration and no playback progress. The recording’s own watch-page data agrees that it is not playable in an embed, which is why no iframe is placed here. The video is public and available directly on YouTube.
ICT Forex January 2023 Sources and Further Reading
- ICT Forex Review January 09, 2023 The primary source and the only recording used for this article. Published 9 January 2023; watch page read 15 September 2026. Use the timestamp links above to compare each step with what he actually said.
- The Inner Circle Trader YouTube channel The publisher's own channel, where this review and the concept lessons it references are posted. Unofficial reuploads and summaries are not the source used here.
- CFTC Learn & Protect: Forex Fraud The US regulator's material on common patterns in retail forex promotions, including the use of past or hypothetical results. General context for reading a chart-review video like this one; it does not assess this presenter, this session or any figure here.
- CFTC: Fraud Advisory: Commodity Trading Systems Sold on the Internet Regulator guidance on retrospectively presented results, and on the execution and cost assumptions such presentations tend to omit. The specific point that matters for a Fibonacci projection exercise is that a level reached by a ratio is an assumption about price, not a demonstrated outcome.
BestProps is not affiliated with the Inner Circle Trader or the CFTC, and no source listed here endorses this article or any setup. Sell-side liquidity, fair value gap, buy-side imbalance, consequent encroachment, order block, kill zone and the model are used as descriptive terms for what the recording teaches. The levels, session timings, the projection settings and the described session outcomes are the speaker’s own reading of his own charts and are not verified here. This is independent educational commentary: it is not official ICT material, not a tested trading system and not investment advice. Leveraged forex and futures trading involves substantial risk and is not suitable for everyone.
