
Key takeaways
ICT’s public YouTube lesson is a roughly twelve-minute retrospective review of the E-mini S&P 500 on the April 12, 2023 CPI session, moving through weekly, daily, hourly, 15-minute and five-minute charts.
Read the full summary
ICT’s public YouTube lesson is a roughly twelve-minute retrospective review of the E-mini S&P 500 on the April 12, 2023 CPI session, moving through weekly, daily, hourly, 15-minute and five-minute charts. ICT says price finished one tick or 0.25 point short of his roughly 4180 upside objective, then identifies 4085.25 as weekly fair value gap consequent encroachment and says a complete close of that area would suggest a more bearish outlook. His Silver Bullet setup forms from 10 a.m. to 11 a.m. New York time around a fair value gap, targets sell-side liquidity and seeks at least five handles. For afternoon trading he calls 2 p.m. to 4 p.m. the sweet spot, identifies an institutional order flow entry drill and breakaway gap, and says a negative three-standard-deviation projection at 4113.50 became the low during the three fifteen p.m. to three forty five p.m. market-on-close window. ICT explicitly calls CPI trading a gamble, says he did not execute the CPI idea and distinguishes his desired next move from what the market will actually do. The recording provides no orders, fills, realized result, frequency data, tested edge, reproducible definitions or transaction-cost analysis, so its levels and pattern labels are unverified retrospective commentary rather than documented performance or investment advice.
How we researched this article
BestProps used document-based research from primary firm sources, checked September 24, 2026. The complete source list, scope, limitations, and commercial-state record appear near the end of this article.
This is a retrospective explanation of his terminology and his reading of one session, not evidence of a repeatable edge. He narrates over his own annotated charts; the recording contains no order tickets, no fills and no realised result, and the levels and projections below are reported as he states them rather than reproduced as verified chart data.
ICT Emini S&P 500 Weekly Outlook and 4180 Target
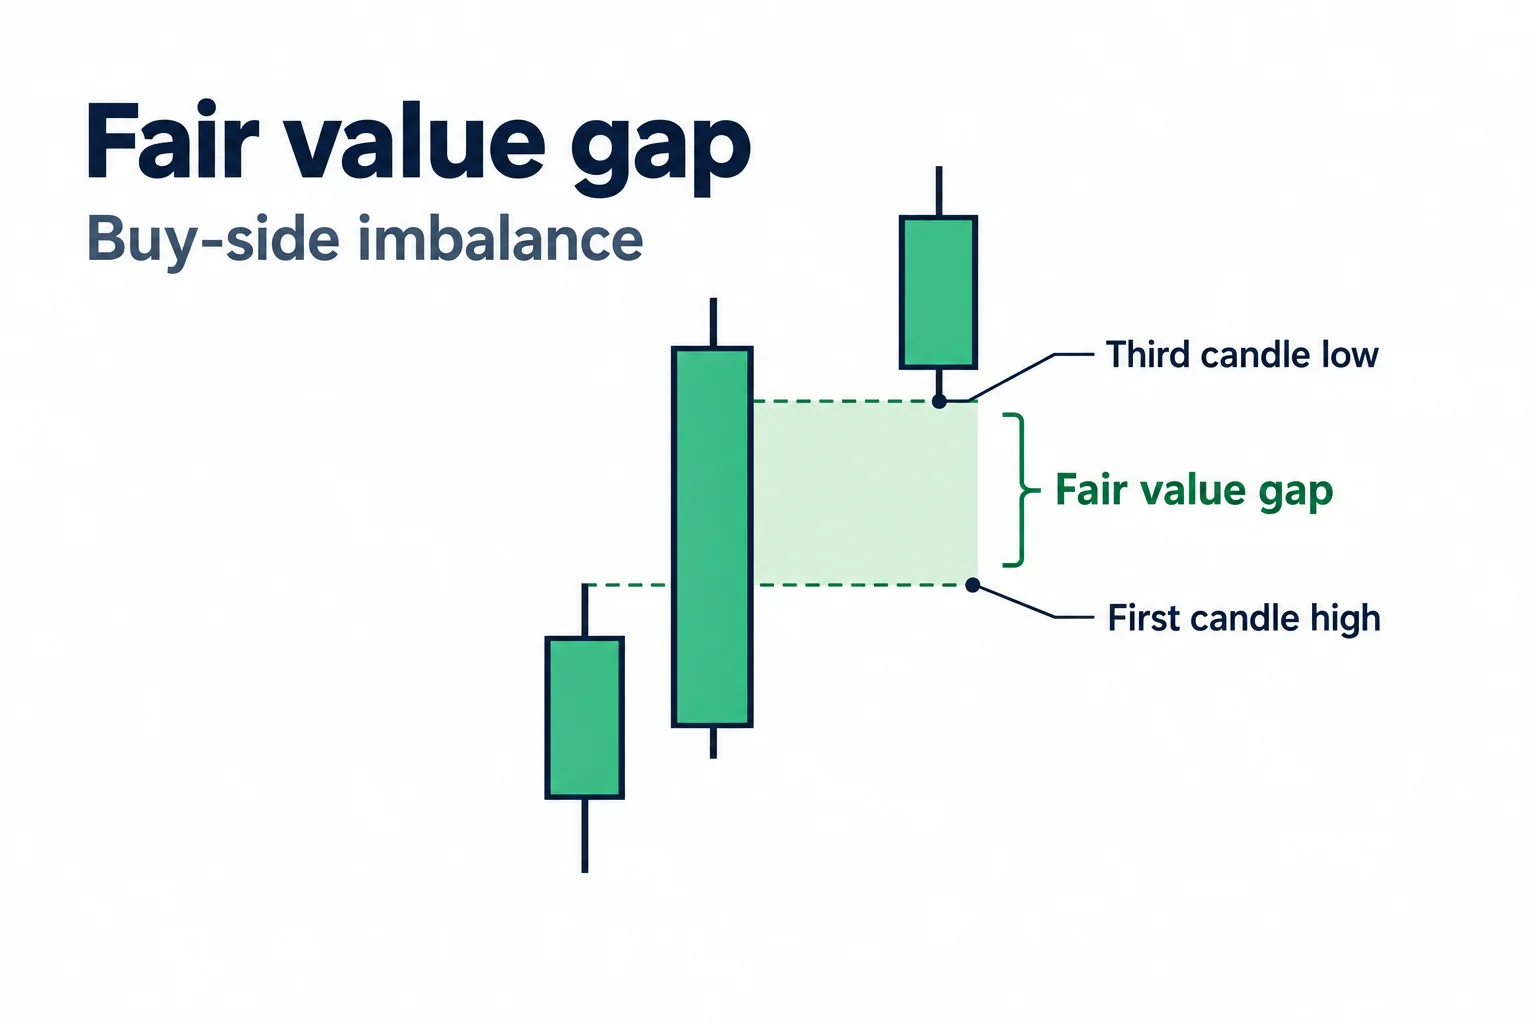
He opens on the weekly chart (0:23), notes that price had traded above the previous week’s high (0:33), and says he had been watching 4180 (the captions render the passage as “41 80 41 81”) as a possible upside objective for the week (0:39, 1:06). His stated reason for caring about that level was conditional: trading there would tell him something about how the rest of the week might develop.
He then says the session finished one quarter point, or one tick, short of it (1:23). With the prior week’s high already taken and much of the week’s gain surrendered, he says he was entertaining a move back down into the gap between one weekly candle’s high and another’s low, which he describes in his own vocabulary as a fair value gap in the form of a buy-side imbalance (the captions render it as “busy box on a bowel cell efficiency”) (1:49). He gives 4085.25 as the consequent-encroachment level he calculated for that area (1:57).
His conditional reading is set out plainly: he would be looking for reasons for price to drop into that range, and if it closed the area entirely he would read the market as probably very bearish and look for lower targets (2:08). He flags that further commentary would come via Twitter or a live session planned for the next day. These are forward-looking opinions stated in a review, not targets the recording demonstrates being met.
ICT Emini S&P 500 CPI Reversal
On the daily chart (2:45) he points to an opening price and a previous candle high he had marked, notes sell-side liquidity and an imbalance beneath the market, and describes the day as having produced an intraday reversal after that high was taken (3:17).
The hourly discussion (3:47) ties the reversal to the CPI release. He says the run up reached his targets but fell short of 4180, and that he had said in advance that if he was wrong about the CPI move running higher, price would run for the sell side resting below, where he describes a large amount of sell stops (4:31). He calls it bearish from where the market stood, while allowing that even a longer-term bullish view would tolerate a sweep below that liquidity if it were then rejected and price traded more animatedly upward (5:02).
The risk qualification he attaches to this is worth keeping separate from the market call. At 5:38 he says he tells students not to stand in front of CPI because being wrong “can rip your face off”, and at 6:00 that it happened to be correct that day but that CPI is a gamble and neither he nor anyone else knows for certain what it will do. At 6:11 he states there was no button pushed on that trade idea and calls it a tape-reading takeaway only. That is his own statement. The recording does not document any order either way.
ICT Emini S&P 500 Silver Bullet Setup
He then drops to the five-minute chart (6:53) and revisits the 8:30 a.m. CPI reaction: the push up into the fair value gap, the failure to reach 4180, and the breakdown that followed. On this reading price ran back over the buy-side imbalance into a candle, created a fair value gap, and then ran up into the range between 10 and 11 (7:56). That is the passage he labels the Silver Bullet, and he adds that if he were only going to trade once a day he would focus between 10 and 11 a.m., wait for the gap, identify its location, and read the direction from the preceding rejection and breakdown (8:08).
The objectives he describes are relative equal lows as sell-side references (8:24) and, for anyone taking a more ambitious read, the larger imbalance the market does trade into during the 11 o’clock hour. He states the aim as liquidity plus a minimum of five handles (8:44), and reads the candle bodies rather than the wicks as the market telling the story. His phrasing is that the wicks do the damage (8:58), after which he says the market broke lower, took out the sell side and dug into the imbalance (9:01).
The five-handle figure is the minimum he seeks from his own model. It is not a measured distribution, and the recording supplies no sample of similar formations.
ICT Emini S&P 500 Afternoon Session Low
He carries the same fair value gap into the afternoon and starts his PM study at 1:30 p.m. (9:10). At 9:29 he calls 2:00 p.m. to 4:00 p.m. the sweet spot for an afternoon trader, with the morning’s activity already behind you, and says a continuation is generally what he expects in that window. On this day he reads the afternoon decline as continuation of the bearish morning.
The final-hour review begins at 9:51. He notes a high taken at the start of the 3 o’clock hour (9:57), a shift in market structure (10:01), and then price trading to the midpoint of an imbalance, which he calls consequent encroachment, describing it as arriving exactly to the tick and stopping there (10:10). He labels the subsequent partial repricing into a fair value gap, one that does not reach the midpoint, as his institutional order flow entry drill (10:28), and reads the opening imbalance as staying open, which he calls a breakaway gap (10:53).
Those labels are his framework, not demonstrated facts: nothing in the recording shows institutional participation, and an “entry drill” here describes a chart pattern rather than an executed entry. Likewise his measurement for a downside projection, a swing measured from a high to a low, projected as a negative three-standard-deviation level at 4113.50, which he says became the day’s low inside the 3:15 to 3:45 p.m. market-on-close macro window (11:09, 11:15), is a spoken claim. The captions carry the level as “41 13 and a half”, the chart data needed to recompute it is not in the transcript, and he emphasises the precision himself.
He closes by describing the market trading back up into the imbalance, failing to take out the low, and going into range-bound trading (11:43), then states what he would like to see into the next overnight session (a gap lower, a fill of that gap, and a move lower) before drawing the distinction directly: what the market does and what he would like to see are two different things (11:50, 12:01).
ICT Emini S&P 500 Review Lessons
The clearest value in this recording is the separation it maintains between three different things: a forecast, a chart pattern being named, and an executed trade. He states a directional opinion, names the formations he would use to act on it, and then says no trade was taken from the CPI idea. Keeping those apart is what makes the review useful as a study of method rather than as a performance record.
It also shows where the limits sit. The session was reviewed after the fact on charts he had already marked, so the identification of the gap, the structure shift and the consequent-encroachment level is presented with the outcome known. The review supplies no frequency data, no definition precise enough to code without interpretation, and no treatment of the costs that would apply to an actual position. The named levels and the three-standard-deviation projection should be read as the speaker’s statements about his own charts, not as independently verified market data.
Watch the ICT Emini S&P 500 April 2023 Recording
Watch the original lesson on YouTube
This recording cannot be played inside another website. Its embedded player was loaded from a BestProps origin and driven on 15 September 2026: it returned error 150 and reported the video as not playable, with no duration, and the upload’s own watch-page data for the same video reports that it is not playable in an embed. The recording itself is public and available (it is the embedding that is unavailable), so no iframe is left here and the direct link is given instead.
ICT Emini S&P 500 Sources and Further Reading
- [1] Emini S&P 500 Review – April 12, 2023 The primary source and the only recording used for this article. Uploaded 12 April 2023 by The Inner Circle Trader; watch page read 15 September 2026. Use the timestamp links above to compare each reading with what he actually said.
- [2] CME Group (E-mini S&P 500 Futures Contract Specs). The exchange specification for the contract reviewed here. It sets the contract’s tick, which is what the “one tick” shortfall he refers to actually amounts to in money; the recording never makes that conversion.
- [3] CFTC (Fraud Advisory: Commodity Trading Systems Sold on the Internet). US regulator guidance on distinguishing hypothetical or retrospective results from real performance, and on the execution and cost assumptions trading-system claims tend to omit. A general reference for reading a retrospective review like this one; it does not assess ICT, this session or any level discussed here.
- [4] CFTC Learn & Protect (Forex Frauds). Describes common patterns in trading promotions and states that two out of three retail foreign exchange traders lose money each quarter. Included as general context on promotional trading claims; it is not a comment on this recordist or his results.
BestProps is not affiliated with the CME Group, the CFTC or the Inner Circle Trader, and no source listed here endorses this article or any setup. Consequent encroachment, fair value gap, buy-side and sell-side imbalance, market-structure shift, breakaway gap and institutional order flow entry drill are used as descriptive terms for what the recording teaches. The levels, the three-standard-deviation projection and the account of what the session did are the speaker’s own narration over his own charts and are not verified here. This is independent educational commentary: it is not official ICT material, not a tested trading system and not investment advice. Index futures trading with leverage involves substantial risk and is not suitable for everyone.
